
Trade The World
Top 3 Price Prediction: Bitcoin, Ethereum, Ripple – BTC steadies, ETH finds support, XRP breaks bullish pattern
작성자 Manish Chhetri
게시일: 15 Sep 2025 | 수정일: 15 Sep 2025


POPULAR ARTICLES

Bitcoin (BTC), Ethereum (ETH), and Ripple (XRP) hover around key levels after recovering by nearly 4%, 7%, and 6%, respectively, last week.
- Bitcoin price holds steady below resistance at $116,000, with a breakout likely to trigger a fresh bullish leg.
- Ethereum price finds support after reclaiming the upper range boundary at $4,488 on Friday.
- Ripple price confirms a breakout above a falling wedge pattern, indicating renewed bullish momentum.
Bitcoin (BTC), Ethereum (ETH), and Ripple (XRP) hover around key levels after recovering by nearly 4%, 7%, and 6%, respectively, last week. At the start of this week, BTC is hovering below its key resistance level at $116,000, while ETH and XRP show signs of resilience that could fuel further upside momentum.
Bitcoin could hit $120,000 if it closes above $116,000
Bitcoin price continued its second consecutive week of recovery, increasing by 3.72% last week. However, it found resistance around the $116,000 daily level on Saturday and declined slightly the next day. At the time of writing on Monday, it hovers around $115,300.
If BTC closes above the daily resistance level at $116,000 on a daily basis, it could extend the rally toward its psychological level at $120,000.
The Relative Strength Index (RSI) on the daily chart reads 56, which is above its neutral level of 50, showing that bullish momentum is gaining traction. The Moving Average Convergence (MACD) indicator displayed a bullish crossover on September 6, which remains in effect, indicating sustained bullish momentum and an upward trend ahead.
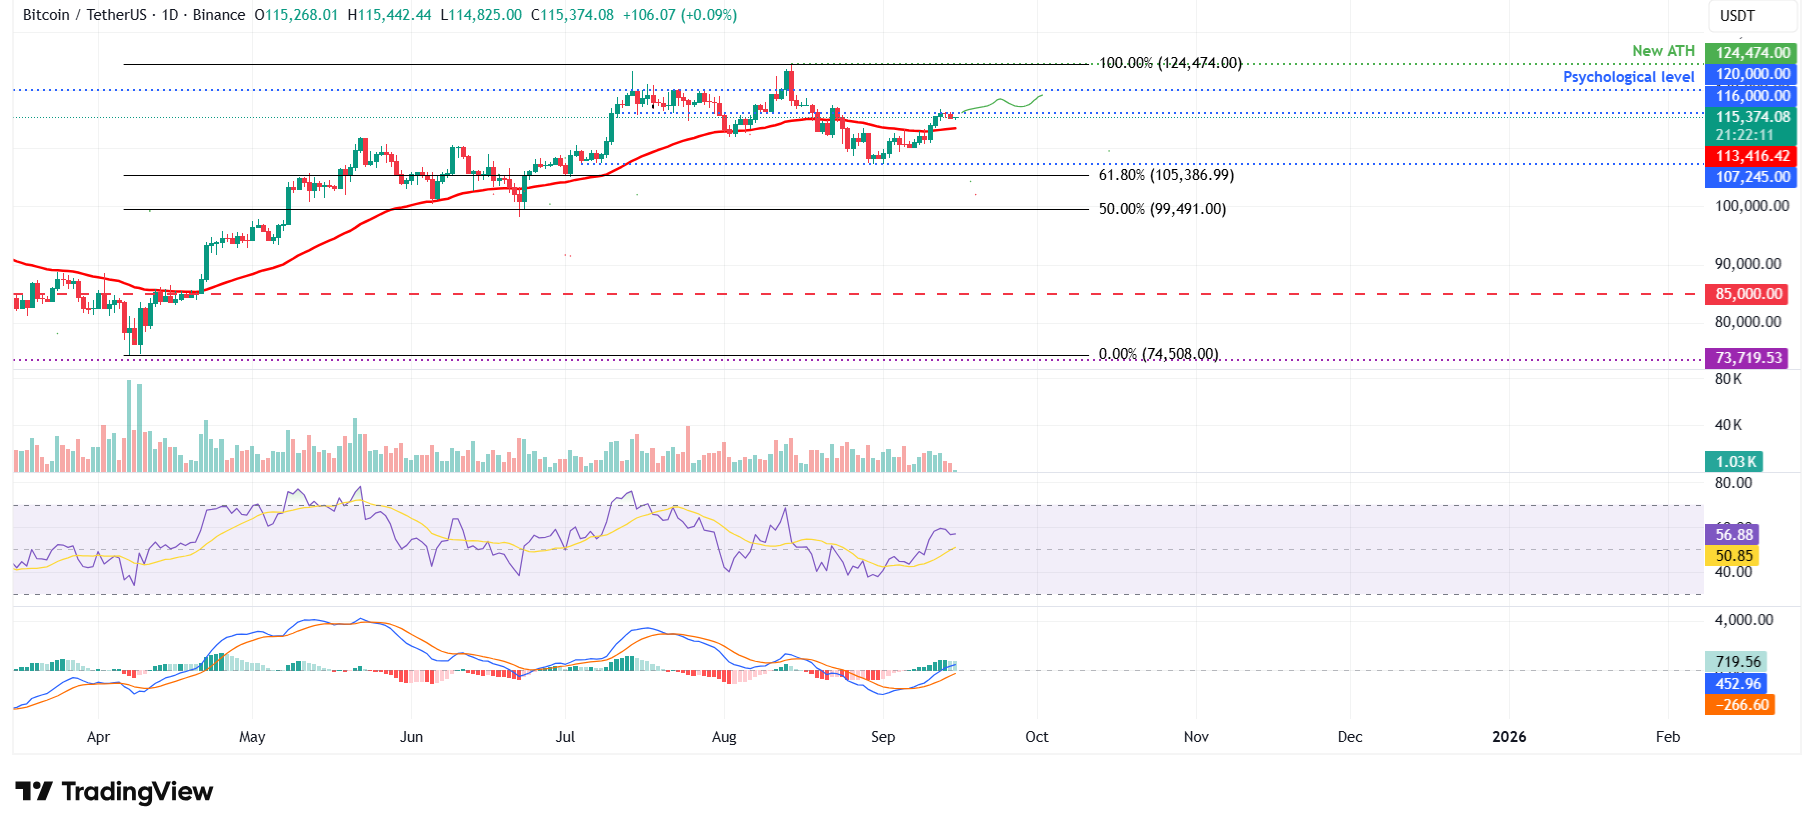
BTC/USDT daily chart
On the contrary, if BTC fails to close above the $116,000 resistance level and continues to correct, it could extend the decline toward its 50-day Exponential Moving Average (EMA) at $113,416.
Ethereum bulls aiming for record highs
Ethereum price broke above the upper consolidating boundary at $4,488 on Friday and rallied by 5.68%. However, it failed to maintain its upward momentum and declined 2.25% in the next two days. At the time of writing on Monday, it trades at around $4,620.
If ETH finds support around the upper consolidating boundary at $4,488, it could extend the rally towards its record high at $4,956.
The RSI on the daily chart reads 59 above its neutral level of 50, showing that bullish momentum is gaining traction. The MACD exhibited a bullish crossover on Friday, providing a buy signal and further bolstering the bullish thesis.
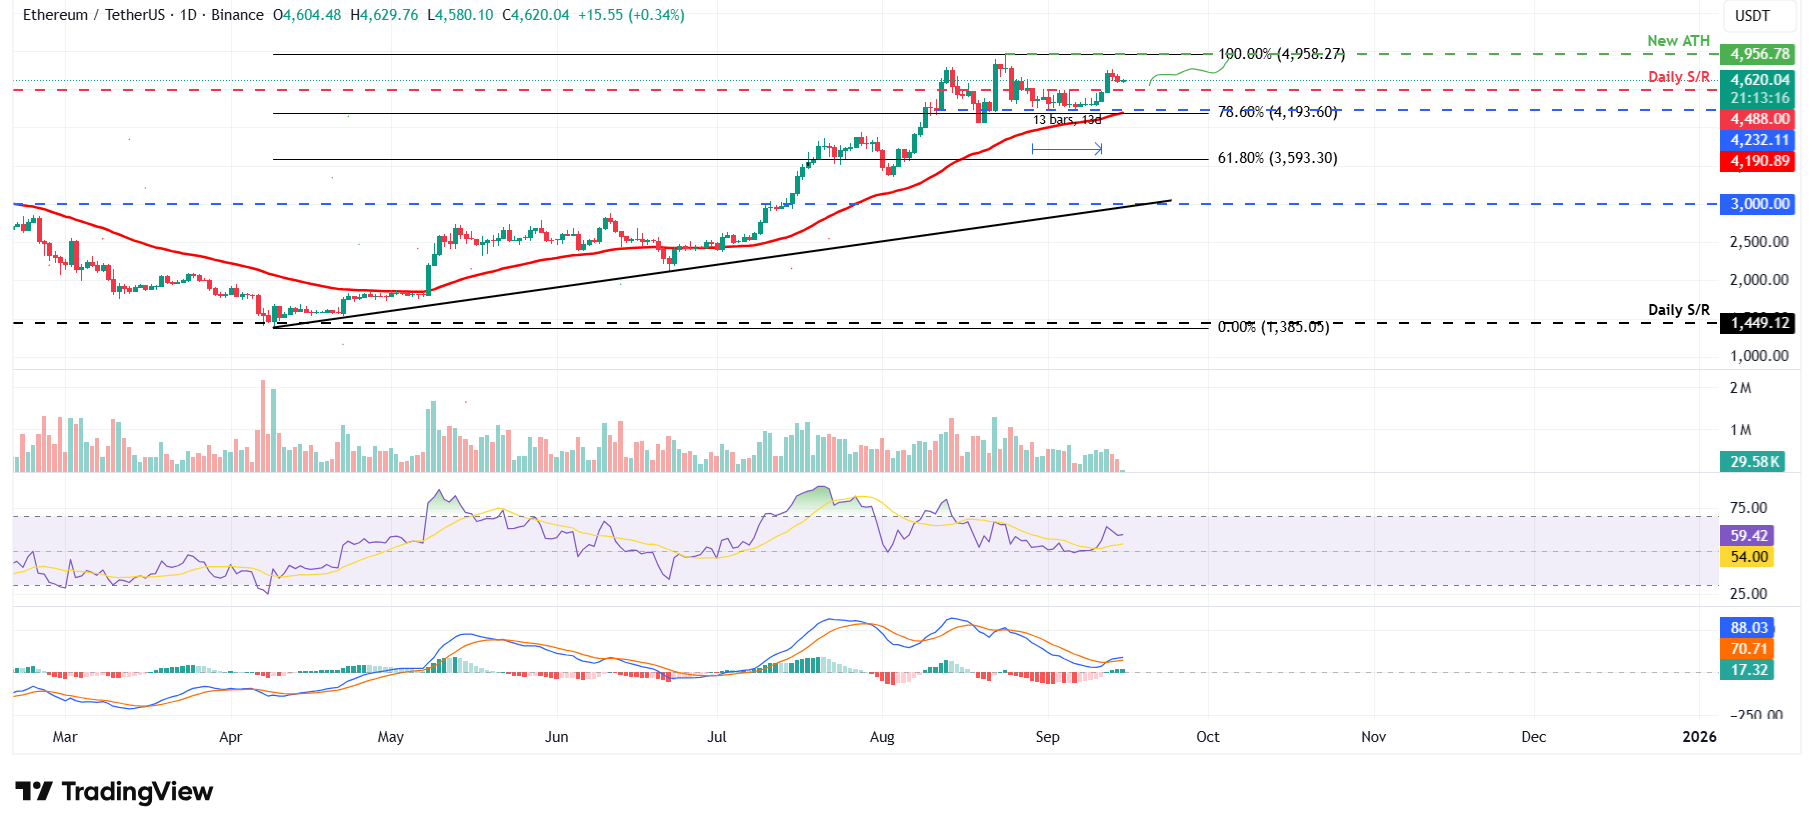
ETH/USDT daily chart
However, if ETH closes below the $4,488 level, it could extend the decline toward the lower boundary at $4,232.
XRP breaks above falling wedge pattern
Ripple price broke above the falling wedge pattern (drawn by connecting multiple highs and lows with two trendlines since mid-July) on Thursday; a breakout of this pattern favors the bulls. XRP rallied 2.5% in the next two days but declined slightly on Sunday. At the time of writing on Monday, it hovers around $3.03.
If XRP continues its upward momentum, it could extend the rally toward its daily resistance at $3.40.
Like Bitcoin and Ethereum, XRP’s RSI stands above the neutral level of 50, indicating bullish momentum. Additionally, the MACD showed a bullish crossover last week, which remains in effect, indicating sustained bullish momentum and an upward trend ahead.
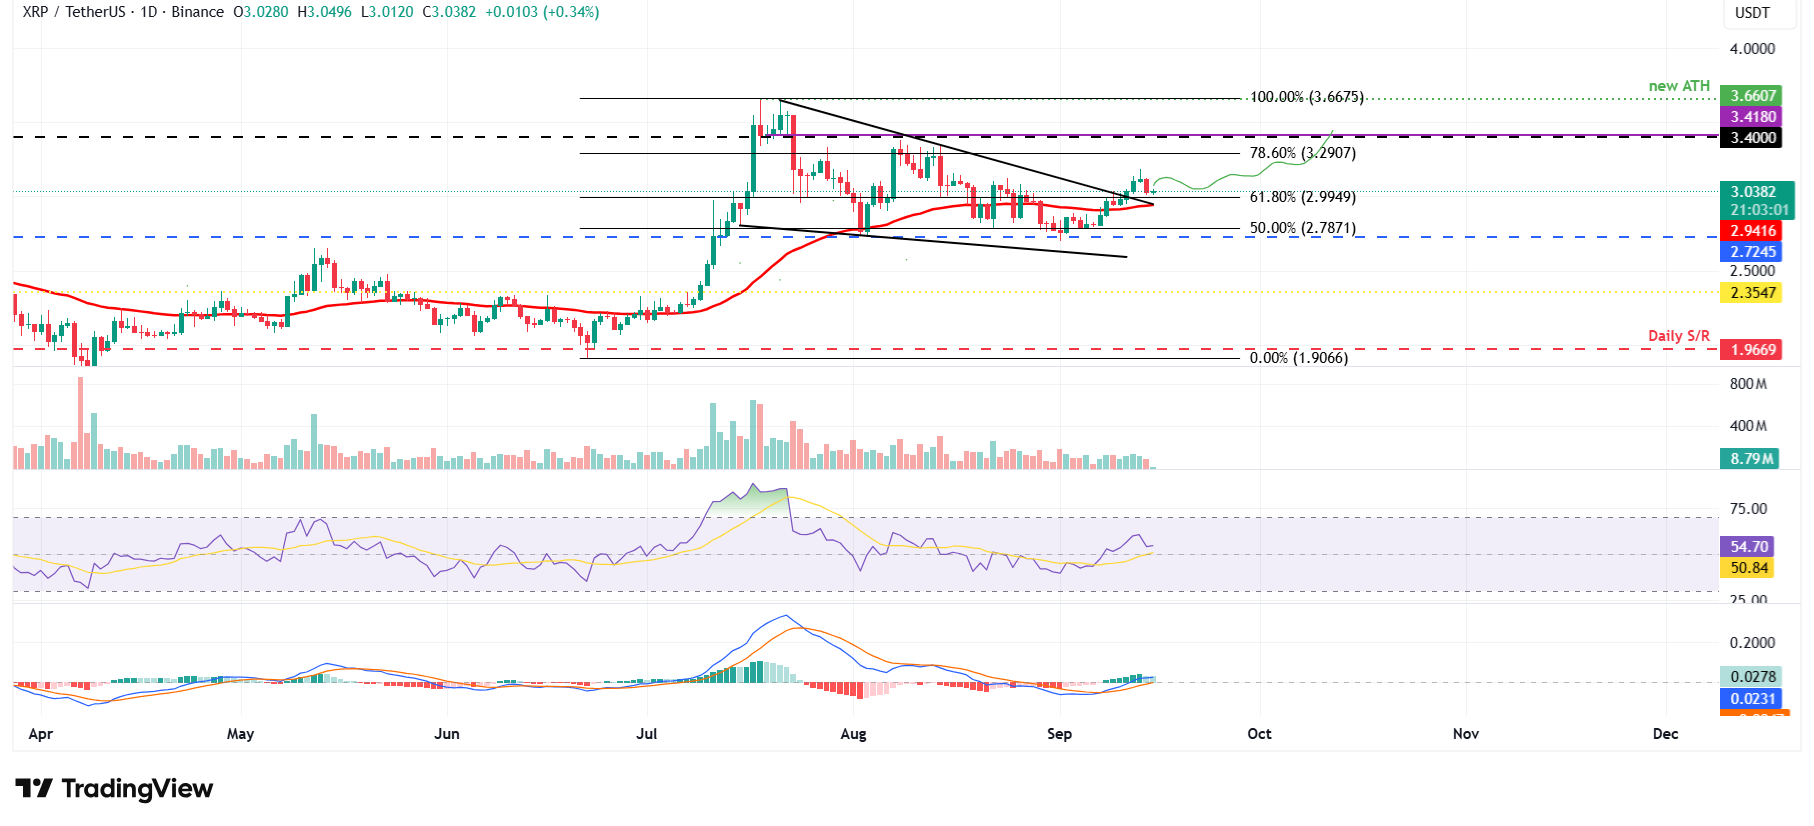
XRP/USDT daily chart
On the other hand, if XRP faces a correction, it could extend the decline toward its 50-day EMA at $2.94.
Cryptocurrency prices FAQs
Token launches influence demand and adoption among market participants. Listings on crypto exchanges deepen the liquidity for an asset and add new participants to an asset’s network. This is typically bullish for a digital asset.
A hack is an event in which an attacker captures a large volume of the asset from a DeFi bridge or hot wallet of an exchange or any other crypto platform via exploits, bugs or other methods. The exploiter then transfers these tokens out of the exchange platforms to ultimately sell or swap the assets for other cryptocurrencies or stablecoins. Such events often involve an en masse panic triggering a sell-off in the affected assets.
Macroeconomic events like the US Federal Reserve’s decision on interest rates influence crypto assets mainly through the direct impact they have on the US Dollar. An increase in interest rate typically negatively influences Bitcoin and altcoin prices, and vice versa. If the US Dollar index declines, risk assets and associated leverage for trading gets cheaper, in turn driving crypto prices higher.
Halvings are typically considered bullish events as they slash the block reward in half for miners, constricting the supply of the asset. At consistent demand if the supply reduces, the asset’s price climbs.

Acuity Trading
Acuity Trading은 2013년에 설립된 런던 기반 핀테크로, AI 기반 대체 데이터와 심리 분석을 통해 트레이딩과 투자를 지원합니다. 시각화된 뉴스와 심리 도구로 온라인 트레이딩 경험을 혁신했으며, 최신 AI 연구와 기술로 알파를 창출하는 대체 데이터와 높은 몰입도의 트레이딩 도구를 제공하며 시장을 선도하고 있습니다.
Read More


