
Trade The World
US Dollar Index Price Forecast: Drops to near 97.00 as bearish bias strengthens
작성자 Akhtar Faruqui
게시일: 16 Sep 2025 | 수정일: 16 Sep 2025


POPULAR ARTICLES

The US Dollar Index (DXY), which measures the value of the US Dollar (USD) against six major currencies, is extending its losses for the second consecutive session and trading around 97.10 during the European hours on Tuesday.
- The US Dollar Index is likely to encounter initial support around the psychological 97.00 level.
- Bearish bias prevails as the 14-day Relative Strength Index remains below the 50 level.
- The initial barrier appears at the nine-day EMA of 97.57.
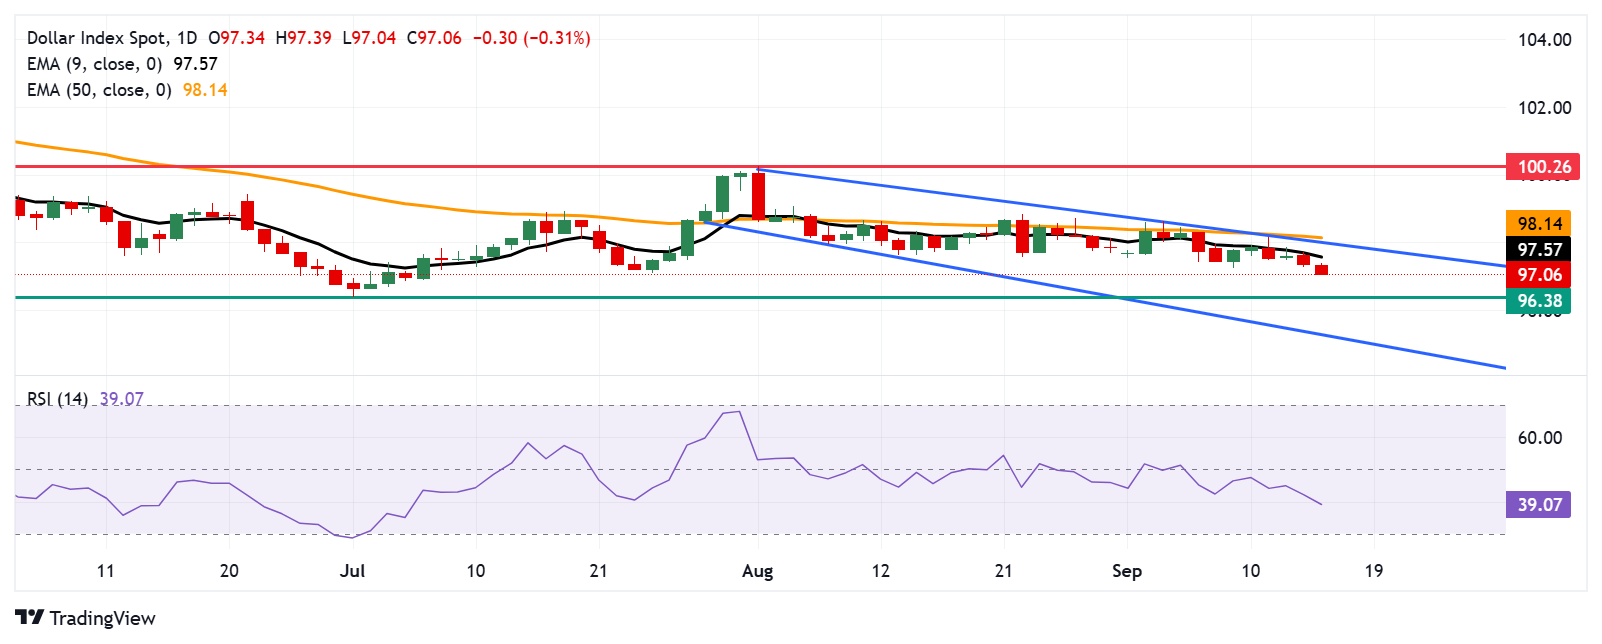
The US Dollar Index (DXY), which measures the value of the US Dollar (USD) against six major currencies, is extending its losses for the second consecutive session and trading around 97.10 during the European hours on Tuesday. The technical analysis of the daily chart shows the dollar index consolidating within the descending channel pattern, suggesting a prevailing bearish bias.
The 14-day Relative Strength Index (RSI) is positioned below the 50 level, strengthening the bearish bias. Additionally, the short-term price momentum is weaker as the DXY remains below the nine-day Exponential Moving Average (EMA).
On the downside, the US Dollar Index may find its immediate support at the psychological level of 97.00, followed by 96.38, the lowest since February 2022, reached on July 1. Further declines would prompt the dollar index to test the lower boundary of the descending channel around 95.30.
The DXY may find its primary barrier at the nine-day EMA of 97.57. A break above this level would improve the short-term price momentum and support the dollar index to approach the descending channel’s upper boundary around the psychological level of 98.00, aligned with the 50-day EMA at 98.14.
US Dollar Index: Daily Chart
US Dollar Price Today
The table below shows the percentage change of US Dollar (USD) against listed major currencies today. US Dollar was the weakest against the Swiss Franc.
| USD | EUR | GBP | JPY | CAD | AUD | NZD | CHF | |
|---|---|---|---|---|---|---|---|---|
| USD | -0.33% | -0.28% | -0.26% | -0.06% | -0.01% | 0.01% | -0.34% | |
| EUR | 0.33% | 0.05% | -0.03% | 0.27% | 0.38% | 0.33% | -0.00% | |
| GBP | 0.28% | -0.05% | -0.06% | 0.22% | 0.34% | 0.29% | -0.07% | |
| JPY | 0.26% | 0.03% | 0.06% | 0.27% | 0.33% | 0.10% | -0.03% | |
| CAD | 0.06% | -0.27% | -0.22% | -0.27% | 0.06% | 0.03% | -0.28% | |
| AUD | 0.00% | -0.38% | -0.34% | -0.33% | -0.06% | 0.04% | -0.38% | |
| NZD | -0.01% | -0.33% | -0.29% | -0.10% | -0.03% | -0.04% | -0.30% | |
| CHF | 0.34% | 0.00% | 0.07% | 0.03% | 0.28% | 0.38% | 0.30% |
The heat map shows percentage changes of major currencies against each other. The base currency is picked from the left column, while the quote currency is picked from the top row. For example, if you pick the US Dollar from the left column and move along the horizontal line to the Japanese Yen, the percentage change displayed in the box will represent USD (base)/JPY (quote).

Acuity Trading
Acuity Trading은 2013년에 설립된 런던 기반 핀테크로, AI 기반 대체 데이터와 심리 분석을 통해 트레이딩과 투자를 지원합니다. 시각화된 뉴스와 심리 도구로 온라인 트레이딩 경험을 혁신했으며, 최신 AI 연구와 기술로 알파를 창출하는 대체 데이터와 높은 몰입도의 트레이딩 도구를 제공하며 시장을 선도하고 있습니다.
Read More


