
Trade The World
USD/CAD Price Forecast: Tests upper ascending channel boundary near 1.3900
작성자 Akhtar Faruqui
게시일: 8 Jan 2026 | 수정일: 8 Jan 2026


POPULAR ARTICLES

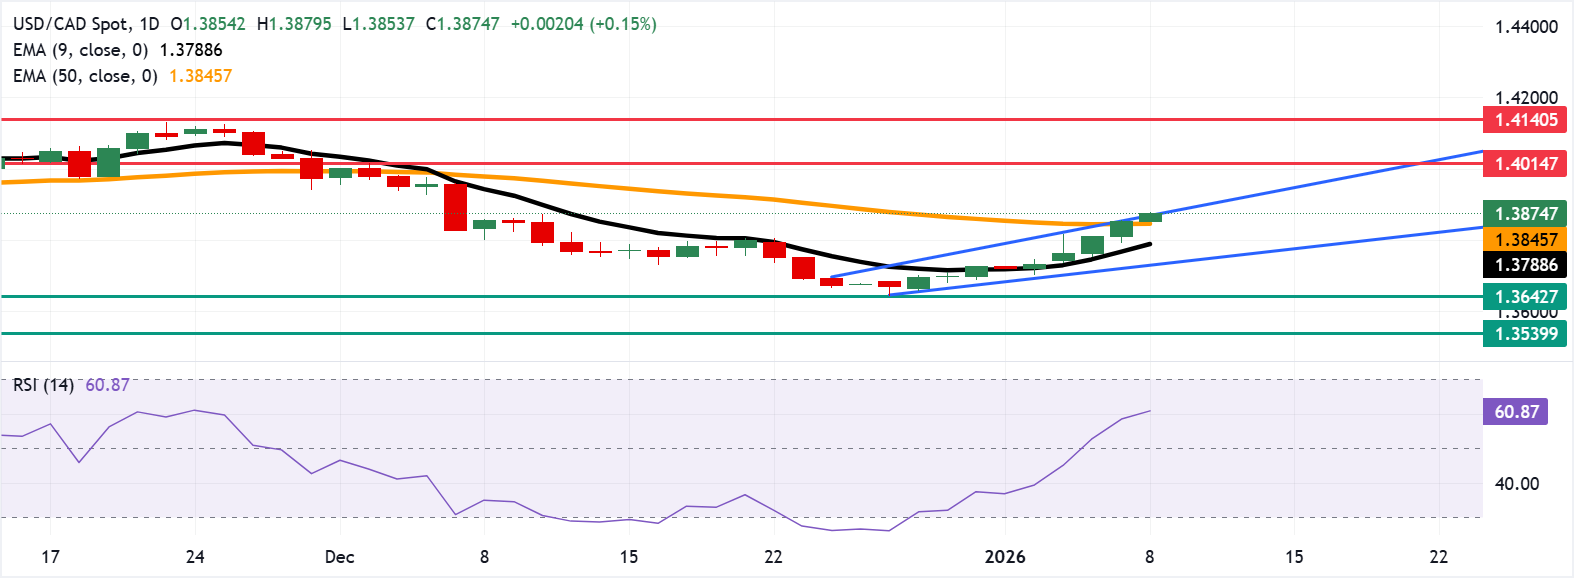
USD/CAD extends its gains for the fifth successive session, trading around 1.3870 during the European hours on Thursday. The technical analysis of the daily chart shows a potential for an upside breakout above an ascending channel pattern.
- USD/CAD tests the upper ascending channel boundary around 1.3870.
- The 14-day Relative Strength Index at 60.8 signals bullish conditions, reinforcing positive momentum.
- The initial support lies at the 50-day EMA of 1.3845.
USD/CAD extends its gains for the fifth successive session, trading around 1.3870 during the European hours on Thursday. The technical analysis of the daily chart shows a potential for an upside breakout above an ascending channel pattern. The 14-day Relative Strength Index (RSI) at 60.8 (bullish) advances, reinforcing positive momentum.
The USD/CAD pair holds above the nine-day Exponential Moving Average (EMA) and the 50-day EMA, maintaining a topside bias. The short-term average rises, and the medium-term average turns slightly higher, signaling an improving trend alignment.
Maintaining closes above the 50-day EMA at 1.3845 would keep buyers in control and preserve focus on the upside. Further advances above the confluence resistance zone around the medium-term average, aligned with the upper ascending channel boundary around 1.3870, would strengthen the price momentum and support the pair to target the six-week high of 1.4014, reached on December 2.
A drop back under the nine-day EMA at 1.3788 would slow the advance and shift risk toward those supports, while holding above it would keep the path higher. Further support lies at the lower ascending channel boundary around 1.3730. A break below the channel would weaken the bullish bias and put downward pressure on the USD/CAD pair to test the five-month low of 1.3642, recorded on December 26.
Canadian Dollar Price Today
The table below shows the percentage change of Canadian Dollar (CAD) against listed major currencies today. Canadian Dollar was the strongest against the Australian Dollar.
| USD | EUR | GBP | JPY | CAD | AUD | NZD | CHF | |
|---|---|---|---|---|---|---|---|---|
| USD | -0.01% | 0.07% | -0.14% | 0.15% | 0.33% | 0.31% | -0.02% | |
| EUR | 0.01% | 0.08% | -0.09% | 0.18% | 0.34% | 0.33% | -0.01% | |
| GBP | -0.07% | -0.08% | -0.19% | 0.08% | 0.27% | 0.25% | -0.09% | |
| JPY | 0.14% | 0.09% | 0.19% | 0.26% | 0.46% | 0.41% | 0.09% | |
| CAD | -0.15% | -0.18% | -0.08% | -0.26% | 0.19% | 0.17% | -0.17% | |
| AUD | -0.33% | -0.34% | -0.27% | -0.46% | -0.19% | -0.01% | -0.35% | |
| NZD | -0.31% | -0.33% | -0.25% | -0.41% | -0.17% | 0.01% | -0.34% | |
| CHF | 0.02% | 0.01% | 0.09% | -0.09% | 0.17% | 0.35% | 0.34% |
The heat map shows percentage changes of major currencies against each other. The base currency is picked from the left column, while the quote currency is picked from the top row. For example, if you pick the Canadian Dollar from the left column and move along the horizontal line to the US Dollar, the percentage change displayed in the box will represent CAD (base)/USD (quote).
(The technical analysis of this story was written with the help of an AI tool.)

Acuity Trading
Acuity Trading은 2013년에 설립된 런던 기반 핀테크로, AI 기반 대체 데이터와 심리 분석을 통해 트레이딩과 투자를 지원합니다. 시각화된 뉴스와 심리 도구로 온라인 트레이딩 경험을 혁신했으며, 최신 AI 연구와 기술로 알파를 창출하는 대체 데이터와 높은 몰입도의 트레이딩 도구를 제공하며 시장을 선도하고 있습니다.
Read More


