
USD/CHF Price Forecast: Rebounds on firm USD, targets 0.7800
작성자 Christian Borjon Valencia
게시일: 27 Feb 2026 | 수정일: 27 Feb 2026


인기 기사

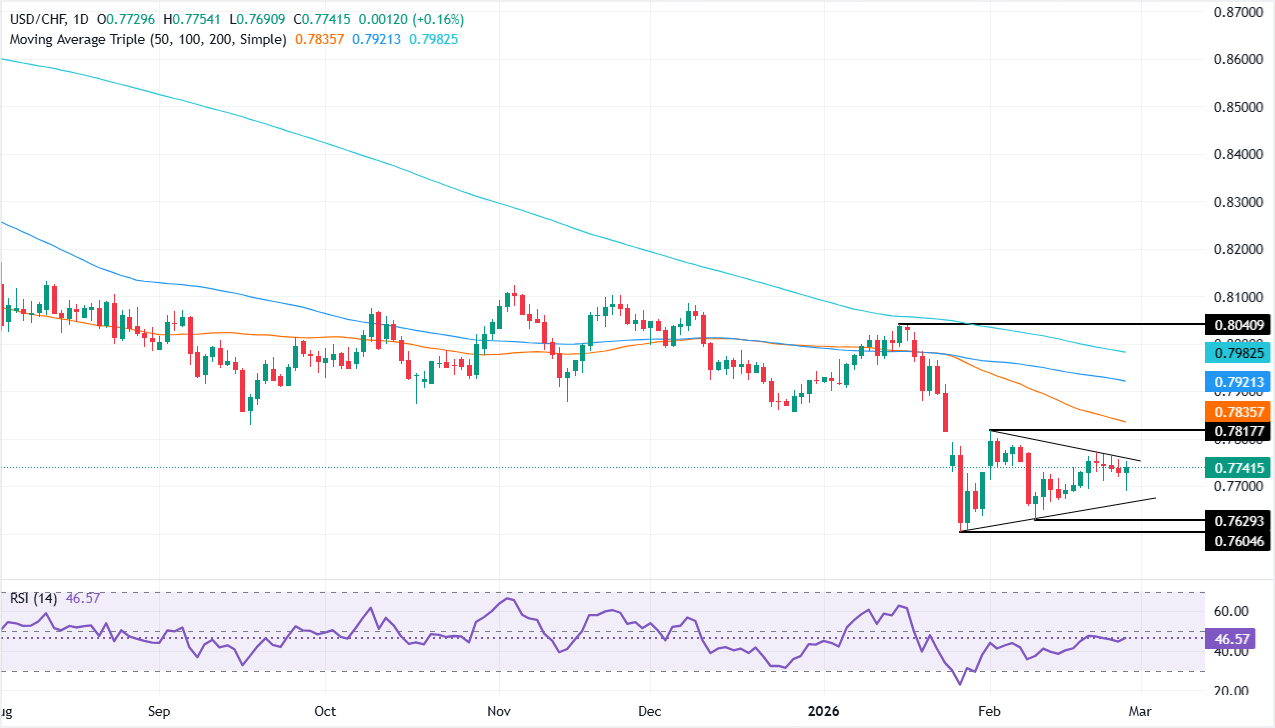
USD/CHF recovers some ground on Thursday, rising some 0.19% as the Greenback appreciates and bounces off daily lows beneath 0.7700 on solid US data. At the time of writing, the pair trades at 0.7743, yet it remains shy of the key resistance level seen at 0.7817, the February 2 daily peak.
- USD/CHF climbs 0.19% as solid US data revives Dollar demand.
- Price tests triangle resistance near 0.7760, with RSI still below neutral.
- Break above 0.7800 exposes 50-day SMA, while drop under 0.7700 risks 0.7600.
USD/CHF recovers some ground on Thursday, rising some 0.19% as the Greenback appreciates and bounces off daily lows beneath 0.7700 on solid US data. At the time of writing, the pair trades at 0.7743, yet it remains shy of the key resistance level seen at 0.7817, the February 2 daily peak.
USD/CHF Price Forecast: Technical outlook
The USD/CHF technical picture shows some consolidation within a symmetrical triangle on a downtrend, yet price action seems closer to the resistance trendline of the chart pattern, which, if broken, would clear the way for further upside. However, momentum seems tilted to the downside as depicted by the Relative Strength Index (RSI) below its neutral level.
For a bearish continuation, a break below 0.7700 is needed to challenge the key support trendline of the triangle at around 0.7650-0.7665. On further weakness, the next stop would be 0.7600 ahead of the August 2011 low of 0.7069.
For a bullish reversal, buyers need to clear the triangle’s resistance trendline at around 0.7760-75, ahead of 0.7800. Additional gains lie overhead at the 50-day SMA at 0.7835, ahead of the 100-day SMA at 0.7921.
USD/CHF Price Chart – Daily
Swiss Franc Price This week
The table below shows the percentage change of Swiss Franc (CHF) against listed major currencies this week. Swiss Franc was the strongest against the Japanese Yen.
| USD | EUR | GBP | JPY | CAD | AUD | NZD | CHF | |
|---|---|---|---|---|---|---|---|---|
| USD | 0.01% | 0.02% | 0.78% | 0.07% | -0.37% | -0.07% | -0.07% | |
| EUR | -0.01% | 0.01% | 0.76% | 0.06% | -0.38% | -0.07% | -0.06% | |
| GBP | -0.02% | -0.01% | 0.93% | 0.05% | -0.43% | -0.09% | -0.06% | |
| JPY | -0.78% | -0.76% | -0.93% | -0.70% | -1.12% | -0.77% | -0.83% | |
| CAD | -0.07% | -0.06% | -0.05% | 0.70% | -0.43% | -0.08% | -0.12% | |
| AUD | 0.37% | 0.38% | 0.43% | 1.12% | 0.43% | 0.32% | 0.33% | |
| NZD | 0.07% | 0.07% | 0.09% | 0.77% | 0.08% | -0.32% | 0.02% | |
| CHF | 0.07% | 0.06% | 0.06% | 0.83% | 0.12% | -0.33% | -0.02% |
The heat map shows percentage changes of major currencies against each other. The base currency is picked from the left column, while the quote currency is picked from the top row. For example, if you pick the Swiss Franc from the left column and move along the horizontal line to the US Dollar, the percentage change displayed in the box will represent CHF (base)/USD (quote).

Acuity Trading은 2013년에 설립된 런던 기반 핀테크로, AI 기반 대체 데이터와 심리 분석을 통해 트레이딩과 투자를 지원합니다. 시각화된 뉴스와 심리 도구로 온라인 트레이딩 경험을 혁신했으며, 최신 AI 연구와 기술로 알파를 창출하는 대체 데이터와 높은 몰입도의 트레이딩 도구를 제공하며 시장을 선도하고 있습니다.
더 읽기


