
USD/CHF Price Forecast: Struggles at 0.7800, dives below 50-day SMA
작성자 Christian Borjon Valencia
게시일: 7 Mar 2026 | 수정일: 7 Mar 2026


인기 기사

The USD/CHF pair retreats on Friday during the North American session, down 0.53% as the Greenback weakens following a dismal jobs report, and a break to four day low beneath the 0.7800 figure.
- USD/CHF drops 0.53% to 0.7771 as weak US jobs data pressures the Dollar.
- Break below 0.7700 could expose trendline support near 0.7670 and 0.7601.
- Reclaiming 0.7800 would target 0.7878 and the 100-day SMA at 0.7905.
The USD/CHF pair retreats on Friday during the North American session, down 0.53% as the Greenback weakens following a dismal jobs report, and a break to four day low beneath the 0.7800 figure. At the time of writing, the pair trades at 0.7771, yet it remains to end the week with gains of more than 1%.
USD/CHF Price Forecast: Technical outlook
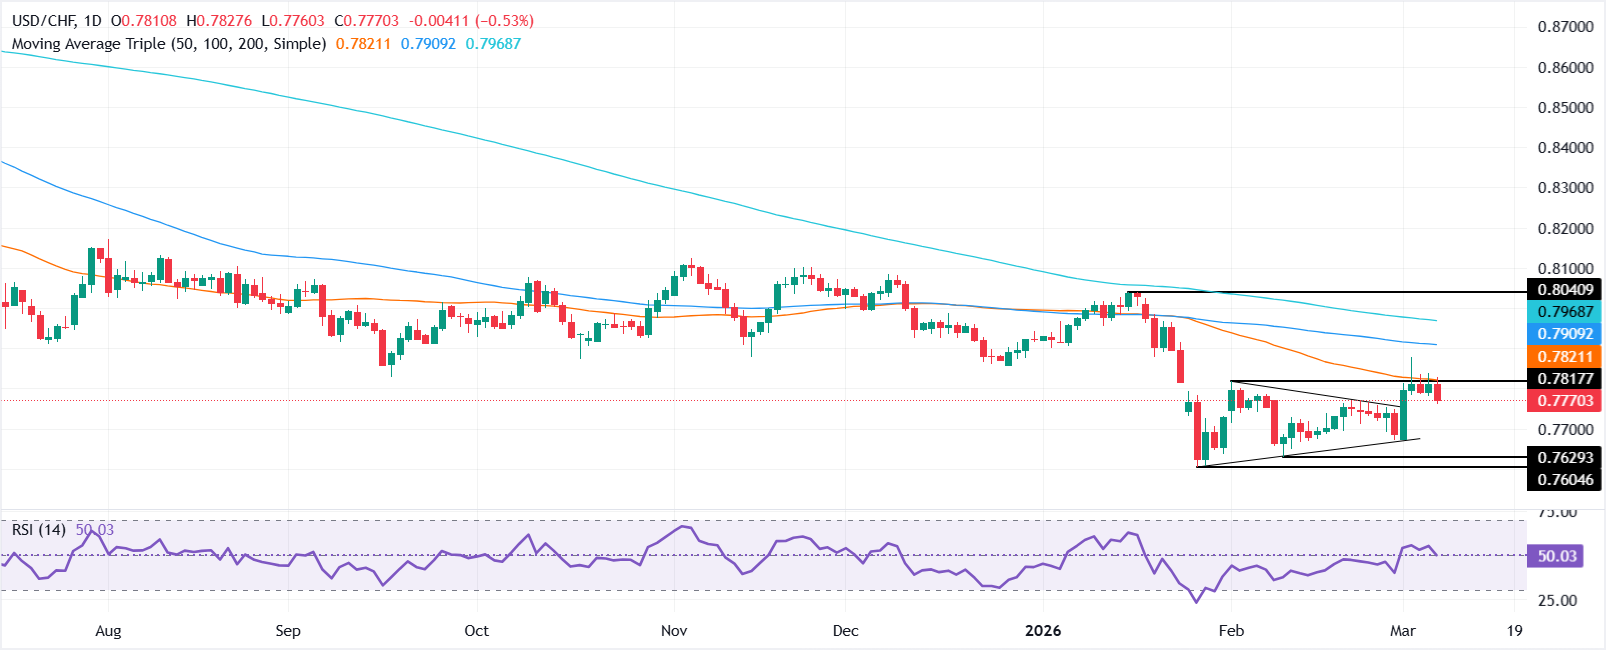
The technical picture shows USD/CHF remaining downward biased as the pair failed to clear 0.7800, opening the door for further downside. Momentum has begun to shift slightly negatively, as depicted by the Relative Strength Index (RSI), about to clear its neutral level. That said, the path of least resistance is tilted to the downside.
The first area of demand will be a support trendline drawn from current year lows of around 0.7601, which passes near the 0.7670-0.7700 range. A breach of the latter will expose the January 28 swing low of 0.7606.
On the other hand, if USD/CHF reclaims 0.7800, expect a test of the March 3 swing high at 0.7878. On further strength, the next area of interest will be the 100-day Simple Moving Average (SMA) at 0.7905.
USD/CHF Price Chart – Daily
US Dollar Price Today
The table below shows the percentage change of US Dollar (USD) against listed major currencies today. US Dollar was the strongest against the Japanese Yen.
| USD | EUR | GBP | JPY | CAD | AUD | NZD | CHF | |
|---|---|---|---|---|---|---|---|---|
| USD | 0.02% | -0.23% | 0.16% | -0.60% | -0.16% | 0.00% | -0.52% | |
| EUR | -0.02% | -0.27% | 0.15% | -0.63% | -0.19% | -0.03% | -0.55% | |
| GBP | 0.23% | 0.27% | 0.40% | -0.37% | 0.08% | 0.23% | -0.29% | |
| JPY | -0.16% | -0.15% | -0.40% | -0.77% | -0.33% | -0.19% | -0.70% | |
| CAD | 0.60% | 0.63% | 0.37% | 0.77% | 0.43% | 0.59% | 0.08% | |
| AUD | 0.16% | 0.19% | -0.08% | 0.33% | -0.43% | 0.16% | -0.36% | |
| NZD | -0.00% | 0.03% | -0.23% | 0.19% | -0.59% | -0.16% | -0.52% | |
| CHF | 0.52% | 0.55% | 0.29% | 0.70% | -0.08% | 0.36% | 0.52% |
The heat map shows percentage changes of major currencies against each other. The base currency is picked from the left column, while the quote currency is picked from the top row. For example, if you pick the US Dollar from the left column and move along the horizontal line to the Japanese Yen, the percentage change displayed in the box will represent USD (base)/JPY (quote).

Acuity Trading은 2013년에 설립된 런던 기반 핀테크로, AI 기반 대체 데이터와 심리 분석을 통해 트레이딩과 투자를 지원합니다. 시각화된 뉴스와 심리 도구로 온라인 트레이딩 경험을 혁신했으며, 최신 AI 연구와 기술로 알파를 창출하는 대체 데이터와 높은 몰입도의 트레이딩 도구를 제공하며 시장을 선도하고 있습니다.
더 읽기


