
Trade The World
USD/JPY Price Forecast: Subdued at around 150.00
작성자 Christian Borjon Valencia
게시일: 21 Oct 2025 | 수정일: 21 Oct 2025


POPULAR ARTICLES

The USD/JPY holds firm on Monday, hovering around 150.60 amid a risk-on environment amid the Fed blackout period and the lack of US data, due to the government shutdown. The lack of market moving comments by US President Donald Trump, could keep the pair trading at familiar levels.
- USD/JPY finds firm support at 20-day SMA near 150.14, maintaining a bullish technical structure.
- Fed blackout and US government shutdown mute macro signals, keeping price action rangebound.
- Break above 151.20 opens path toward 152.00, while a drop below 150 risks deeper pullback.
The USD/JPY holds firm on Monday, hovering around 150.60 amid a risk-on environment amid the Fed blackout period and the lack of US data, due to the government shutdown. The lack of market moving comments by US President Donald Trump, could keep the pair trading at familiar levels.
USD/JPY Price Forecast: Technical outlook
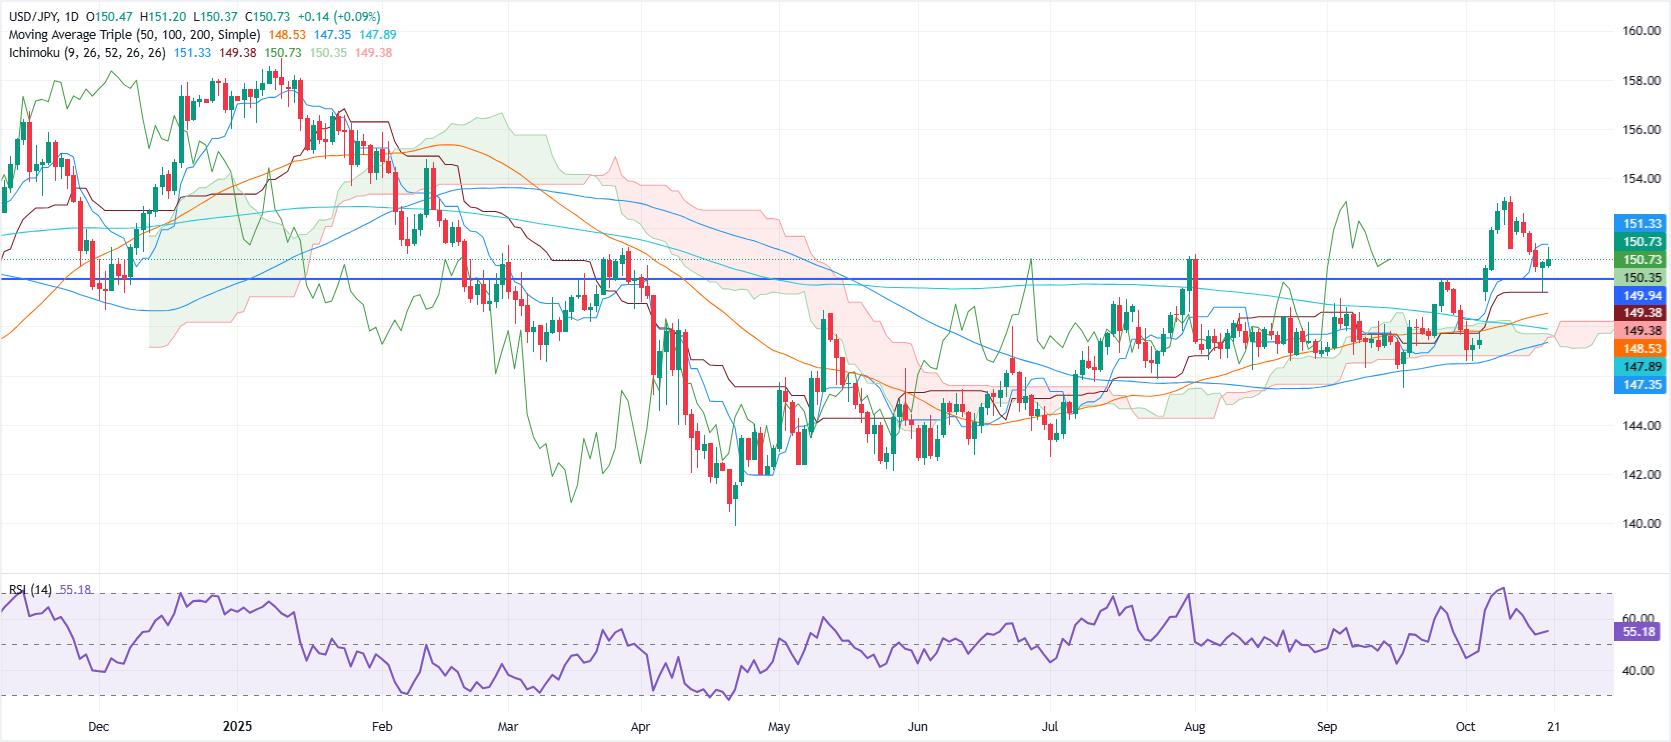
The technical picture shows that the pair found support at the 20-day Simple Moving Average (SMA) around 150.14, after bouncing off daily lows of 149.37, reached last Friday, which ultimately finished the session above 150.00.
For a bullish continuation, buyers must clear the October 20 peak at 151.20. If surpassed, this clears the path towards 152.00, followed by October 10 high if 153.27.
On the flip side, if sellers drive the exchange rate below 150.00, the next support would be 149.37 followed by the 50-day SMA at 148.57.
USD/JPY Price Chart – Daily
Japanese Yen Price This week
The table below shows the percentage change of Japanese Yen (JPY) against listed major currencies this week. Japanese Yen was the strongest against the Swiss Franc.
| USD | EUR | GBP | JPY | CAD | AUD | NZD | CHF | |
|---|---|---|---|---|---|---|---|---|
| USD | -0.03% | 0.07% | 0.02% | -0.00% | -0.02% | -0.05% | 0.04% | |
| EUR | 0.03% | 0.01% | 0.07% | 0.02% | -0.03% | -0.03% | 0.07% | |
| GBP | -0.07% | -0.01% | 0.02% | 0.00% | -0.03% | -0.03% | 0.07% | |
| JPY | -0.02% | -0.07% | -0.02% | -0.02% | -0.03% | -0.12% | 0.04% | |
| CAD | 0.00% | -0.02% | -0.00% | 0.02% | -0.04% | -0.05% | 0.05% | |
| AUD | 0.02% | 0.03% | 0.03% | 0.03% | 0.04% | -0.00% | 0.09% | |
| NZD | 0.05% | 0.03% | 0.03% | 0.12% | 0.05% | 0.00% | 0.10% | |
| CHF | -0.04% | -0.07% | -0.07% | -0.04% | -0.05% | -0.09% | -0.10% |
The heat map shows percentage changes of major currencies against each other. The base currency is picked from the left column, while the quote currency is picked from the top row. For example, if you pick the Japanese Yen from the left column and move along the horizontal line to the US Dollar, the percentage change displayed in the box will represent JPY (base)/USD (quote).

Acuity Trading
Acuity Trading은 2013년에 설립된 런던 기반 핀테크로, AI 기반 대체 데이터와 심리 분석을 통해 트레이딩과 투자를 지원합니다. 시각화된 뉴스와 심리 도구로 온라인 트레이딩 경험을 혁신했으며, 최신 AI 연구와 기술로 알파를 창출하는 대체 데이터와 높은 몰입도의 트레이딩 도구를 제공하며 시장을 선도하고 있습니다.
Read More


