
Trade The World
Analysts compare Bitcoin to the Soybean crash, predict sharp moves ahead
작성자 Vishal Dixit
게시일: 22 Oct 2025 | 수정일: 22 Oct 2025


POPULAR ARTICLES

Bitcoin (BTC) is down 5% so far this month, failing to extend the six-year streak of “Uptober.” Analyst Peter Brandt notes that the BTC price movement mirrors the Soybean price ahead of its 1977 crash, when it declined 50% in value, while analyst Francis Hunt highlights a difference in the structure
- Peter Brandt finds the Bitcoin price behaving similarly to Soybean prices in 1977.
- Francis Hunt points out a key difference between the Bitcoin and Soybean prices, forecasting a potential upside.
- Holders with 100 to 1,000 BTC are on a buying spree, similar to what was seen before the 2021 bull run.
Bitcoin (BTC) is down 5% so far this month, failing to extend the six-year streak of “Uptober.” Analyst Peter Brandt notes that the BTC price movement mirrors the Soybean price ahead of its 1977 crash, when it declined 50% in value, while analyst Francis Hunt highlights a difference in the structure and locates an upside in the trend. The on-chain data corroborates Hunt’s discovery, forecasting a bull run similar to the 2021 rally.
Peter Brandt finds Bitcoin-Soybean connection
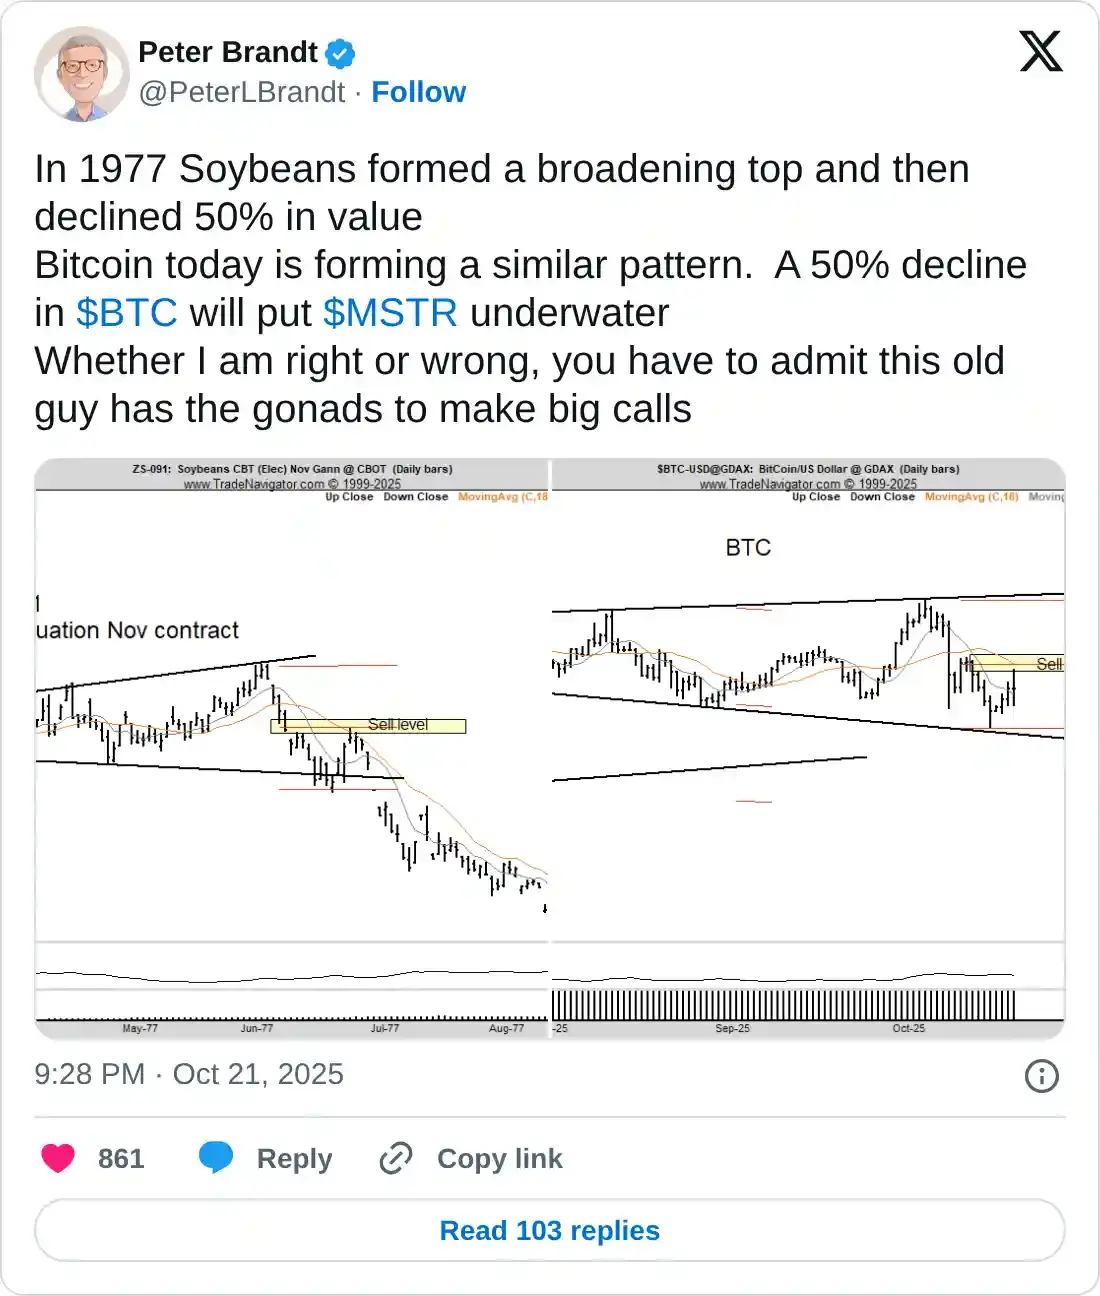
Peter Brandt, a veteran market analyst, shared in an X post on Tuesday that the Bitcoin price movement is forming a broadening top pattern on the daily price chart. This structure is formed by two diverging trendlines that connect the expanding price oscillation.
Brandt compares Bitcoin’s broadening top to a similar trend previously seen in Soybean, prior to its 1977 crash, which resulted in a 50% drop. The analyst shares a similar 50% drop warning in BTC, which could exceed the average buying price of Microstrategy’s (MSTR) Bitcoin holding.
Francis Hunt brings a fresh perspective
Francis Hunt, a Chartered Market Technician, shared a key difference between the Bitcoin and Soybean broadening top pattern. Hunt placed a splitting line between two patterns, distinguishing Soybean’s structure as an ascending Megaphone pattern on an uptrend. Typically, an ascending price following a rally is considered a potential reversal signal.
On the other hand, the splitter placed on Bitcoin’s pattern suggests a descending structure, which could be considered a short-term pullback before extending the prevailing uptrend.

Peter Brandt reposted the bullish possibility shared by Hunt and said, “I am willing to go with it in either direction. If BTC goes up I want to be long, if it goes down I want to be short.”
On-chain data points to a potential Bitcoin rally
Alphractal, a crypto data analysis platform, shared an ongoing buying spree among investors with 100 to 1,000 BTC from early 2024. A similar buying wave was observed in this cohort of traders before the 2021 bull run. However, a halt in their purchase trend aligns with the peaks of the 2017 and 2022 cycles.
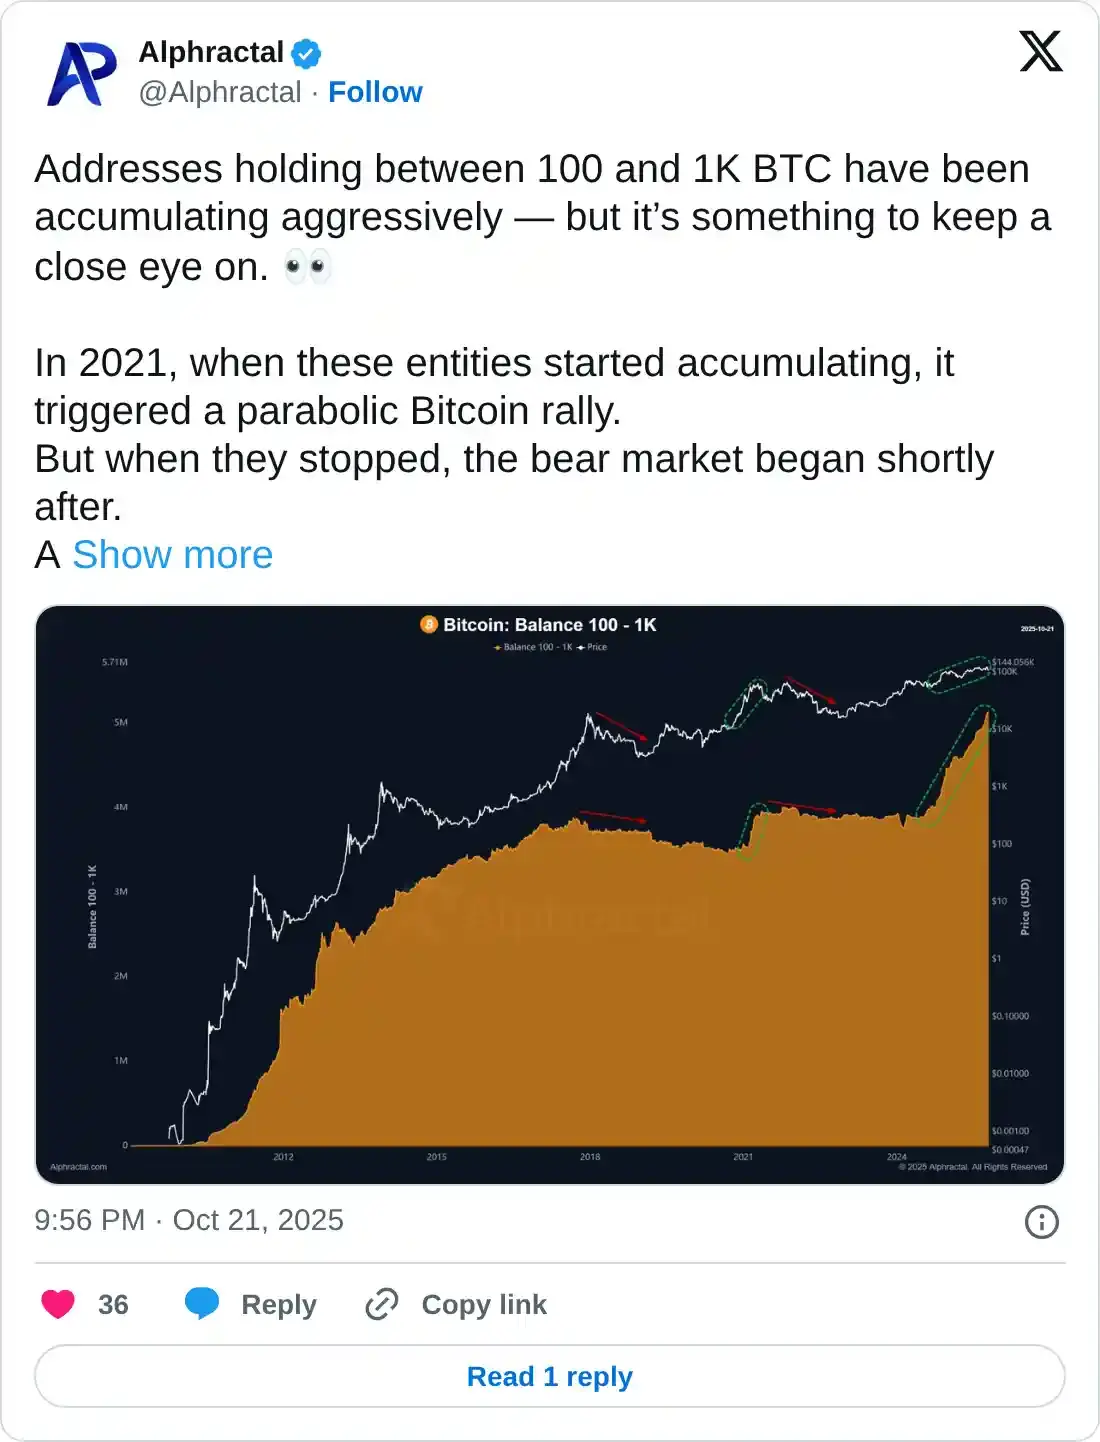
Currently, investors with 100 to 1,000 BTC continue to expand their holdings, which suggests a potential bullish trend extension. However, a pause or offloading in this activity could signal the top of the current Bitcoin upcycle.

FXStreet
100만 명이 넘는 사용자가 FXStreet를 통해 실시간 시장 데이터, 차트 도구, 전문가 인사이트, 포렉스 뉴스를 이용합니다. 포괄적인 경제 캘린더와 교육 웨비나는 트레이더가 정보를 유지하고 신중한 결정을 내리도록 돕습니다. FXStreet는 바르셀로나 본사와 전 세계 지역에 걸쳐 약 60명의 팀으로 구성되어 있습니다.
Read More


