
Aave Price Forecast: AAVE primed for breakout as bullish signals strengthen
작성자 Manish Chhetri
게시일: 12 Dec 2025 | 수정일: 12 Dec 2025


인기 기사

Aave (AAVE) price is trading above $204 at the time of writing on Friday and approaching the upper boundary of its descending parallel channel; a breakout from this structure would favor the bulls.
- Aave price continues to trade within a descending parallel channel pattern, with a breakout potentially paving the way for an upward move.
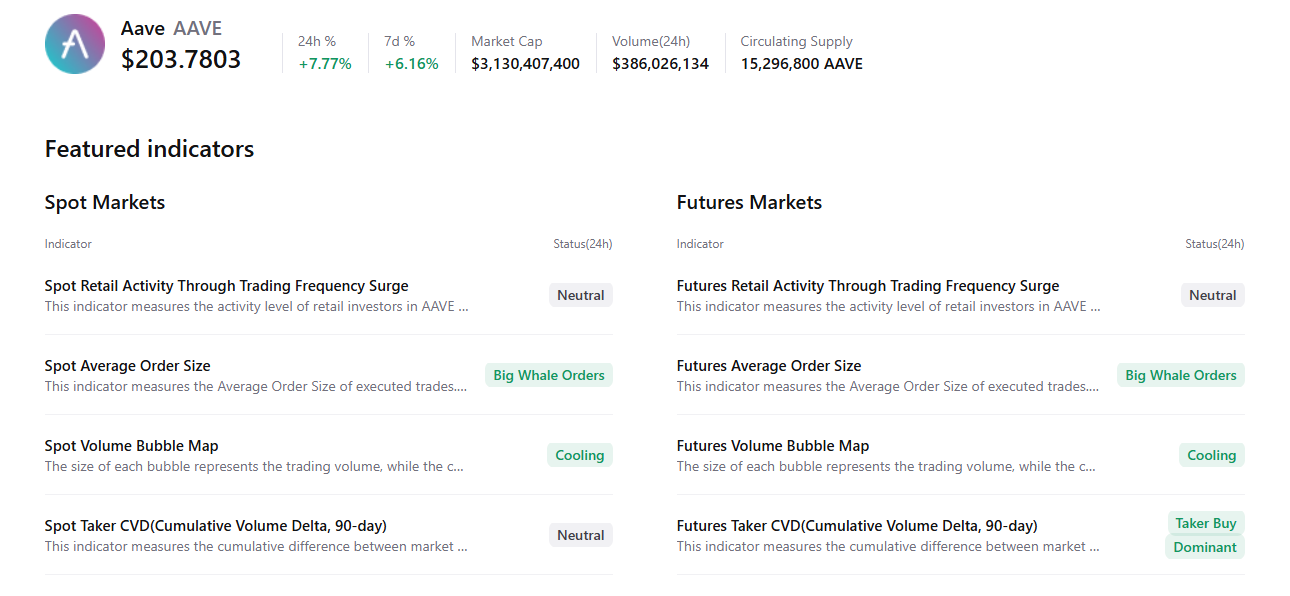
- On-chain and derivatives data indicate bullish sentiment, with large whale orders, cooling conditions, and buy-side dominance.
- The technical setup supports a potential breakout, with the pattern’s measured target near $296.
Aave (AAVE) price is trading above $204 at the time of writing on Friday and approaching the upper boundary of its descending parallel channel; a breakout from this structure would favor the bulls. Moreover, on-chain and derivatives data also support bullish sentiment, while the pattern’s technical target suggests a rally above $296.
Aave’s on-chain and derivatives data show a bullish bias
CryptoQuant’s summary data also supports the bullish outlook, as Aave’s spot and futures markets show large whale orders, cooling conditions, and buy dominance. These factors signal a potential rally in the upcoming days.
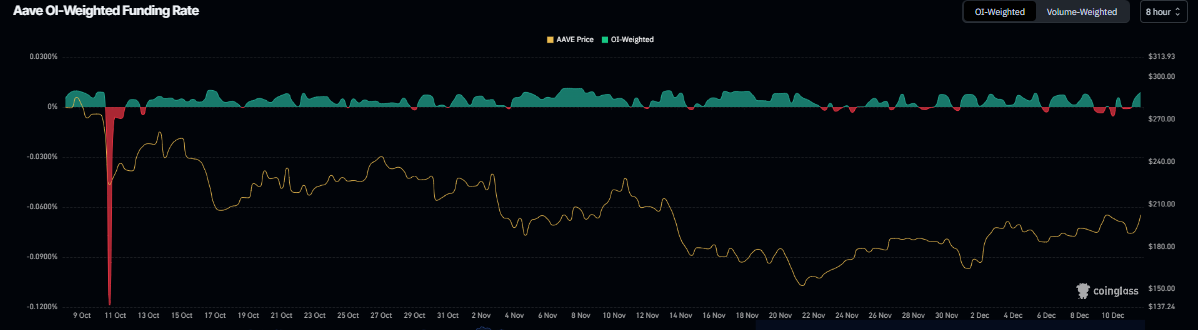
On the derivatives side, Aave’s funding rate data also support signs of a rally. According to Coinglass’s OI-Weighted Funding Rate data, the number of traders betting that the price of Aave will slide further is lower than those anticipating a price increase.
The metric has flipped to a positive rate on Wednesday and stands at 0.0088% on Thursday, indicating that longs are paying shorts. Historically, as shown in the chart below, when the funding rates have flipped from negative to positive, Aave’s price has rallied sharply.
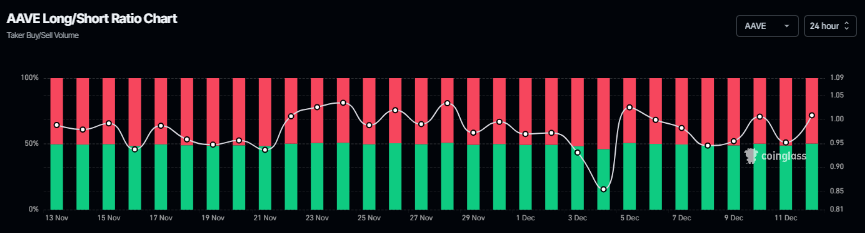
Additionally, Aave’s long-to-short ratio reads 1.01 on Thursday, nearing the monthly high. This ratio, above one, reflects bullish sentiment in the markets, as more traders are betting on the asset price to rally.
Aave Price Forecast: Aave nears upper trendline, eyes bullish breakout
Aave price trades within a descending parallel channel pattern (formed by connecting multiple highs and lows with two trendlines). At the time of writing on Friday, AAVE is approaching the upper boundary of this channel, and a breakout above it would signal a potential bullish shift.
If buyers push the price above the trendline, the measured move—based on the channel’s width—points to a technical target of $296.14.
The Relative Strength Index (RSI) on the daily chart reads 57, above the neutral level of 50, indicating bullish momentum gaining traction. Additionally, the Moving Average Convergence Divergence (MACD) showed a bullish crossover, which remains intact, further supporting the bullish thesis.
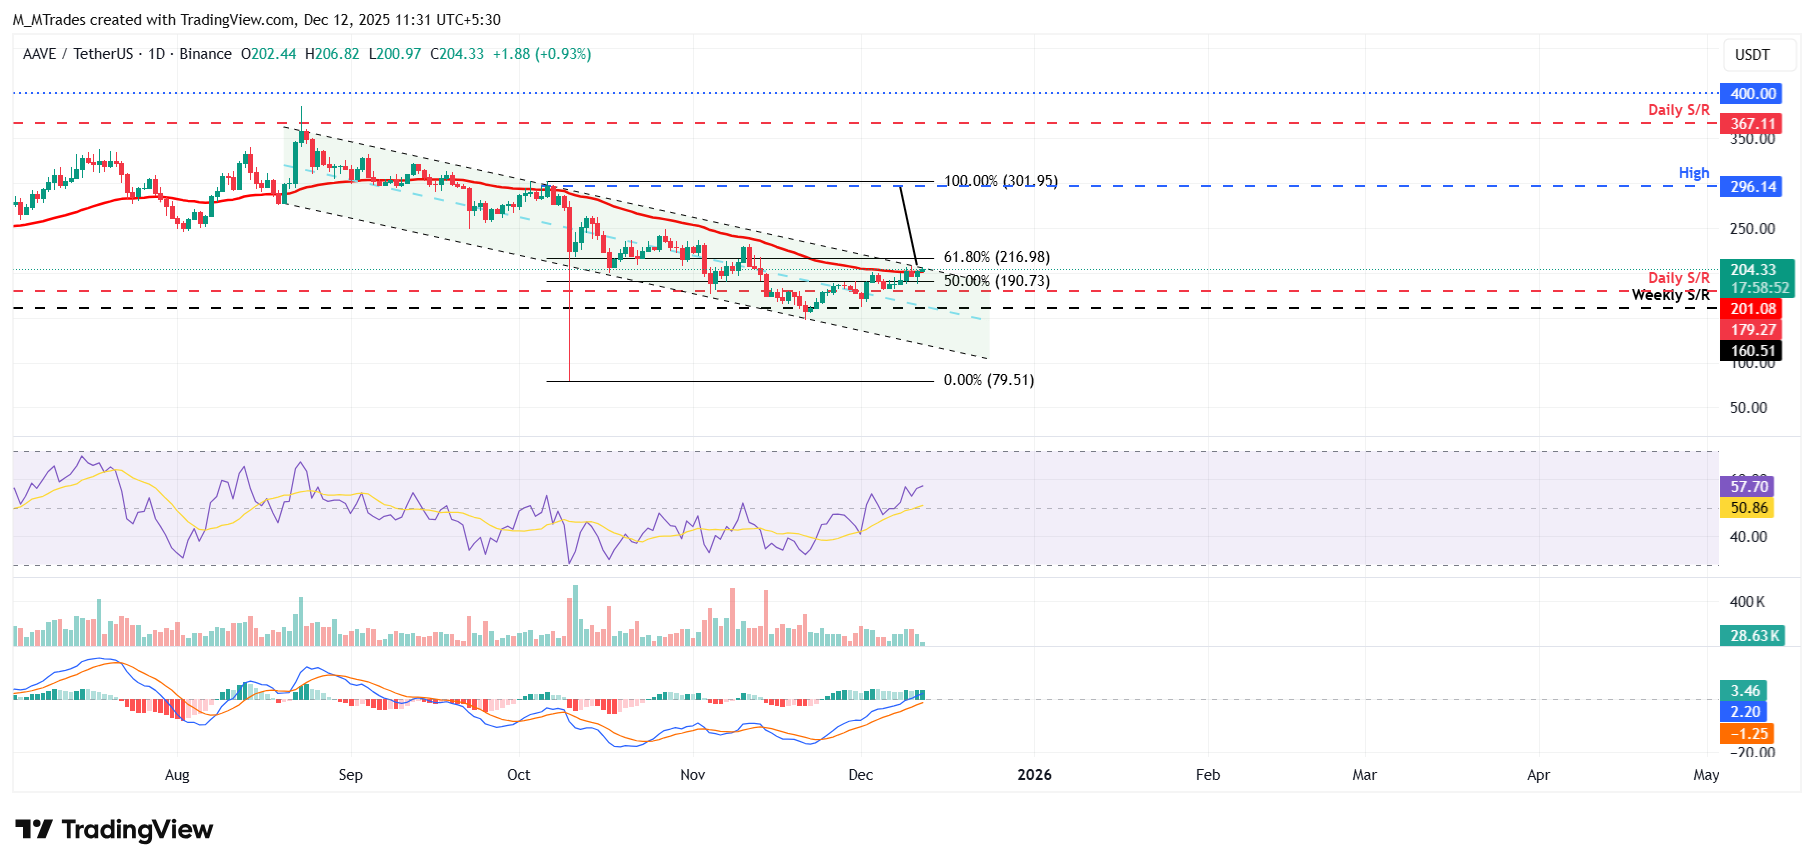
Looking up, if AAVE faces a rejection from the upper trendline boundary, it could extend the decline toward the daily support level at $201.08.

100만 명이 넘는 사용자가 FXStreet를 통해 실시간 시장 데이터, 차트 도구, 전문가 인사이트, 포렉스 뉴스를 이용합니다. 포괄적인 경제 캘린더와 교육 웨비나는 트레이더가 정보를 유지하고 신중한 결정을 내리도록 돕습니다. FXStreet는 바르셀로나 본사와 전 세계 지역에 걸쳐 약 60명의 팀으로 구성되어 있습니다.
더 읽기


