
AUD/USD Price Forecast: Holds position near 0.6900 due to overbought conditions
작성자 Akhtar Faruqui
게시일: 27 Jan 2026 | 수정일: 27 Jan 2026


인기 기사

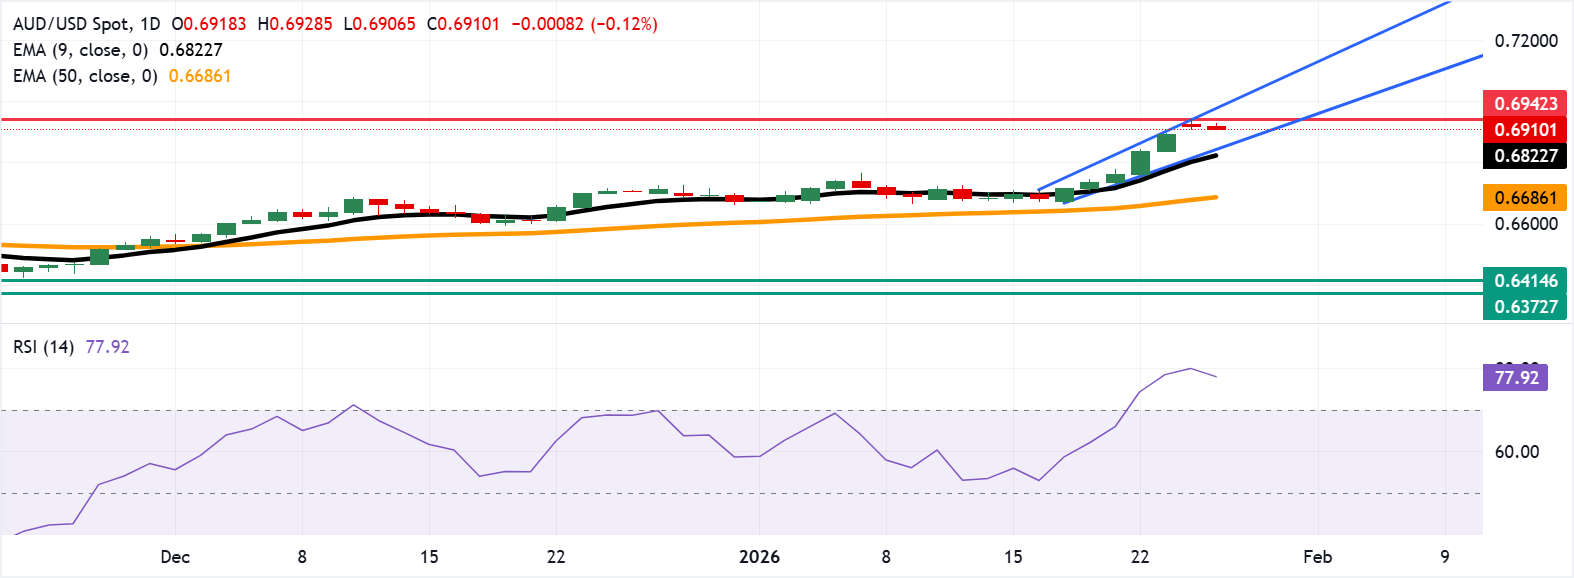
AUD/USD remains subdued for the second successive session, trading around 0.6910 during the European hours on Tuesday. Daily chart analysis indicates that the pair is rising within the ascending channel pattern, indicating a persistent bullish bias.
- AUD/USD may retest the barrier at 0.6942, the highest since February 2023.
- The 14-day Relative Strength Index is at 79, suggesting stretched momentum may limit further gains.
- Primary support is seen at the lower ascending channel boundary near 0.6850.
AUD/USD remains subdued for the second successive session, trading around 0.6910 during the European hours on Tuesday. Daily chart analysis indicates that the pair is rising within the ascending channel pattern, indicating a persistent bullish bias.
The AUD/USD pair holds above the rising 50-day Exponential Moving Average (EMA), and the nine-day EMA underpins the near-term advance. The bullish EMA slope supports the broader recovery, and dip-buying interest could emerge on pullbacks toward the nine-day average.
The 14-day Relative Strength Index (RSI) at 79 (overbought) shows stretched momentum that could cap gains. RSI remains overbought, so consolidation could precede a sustained break higher.
The AUD/USD pair could retest the confluence resistance at the upper boundary of the ascending channel near the 0.6942, the highest level since February 2023, which was recorded in September 2024.
On the downside, the primary support lies at the lower ascending channel boundary around 0.6850, followed by the nine-day EMA at 0.6824. A break below this confluence would weaken the bullish bias and target the 50-day EMA at 0.6686.
(The technical analysis of this story was written with the help of an AI tool.)
Australian Dollar Price Today
The table below shows the percentage change of Australian Dollar (AUD) against listed major currencies today. Australian Dollar was the weakest against the US Dollar.
| USD | EUR | GBP | JPY | CAD | AUD | NZD | CHF | |
|---|---|---|---|---|---|---|---|---|
| USD | 0.22% | 0.08% | 0.42% | 0.17% | 0.15% | 0.30% | 0.17% | |
| EUR | -0.22% | -0.14% | 0.20% | -0.05% | -0.07% | 0.07% | -0.05% | |
| GBP | -0.08% | 0.14% | 0.36% | 0.09% | 0.07% | 0.22% | 0.10% | |
| JPY | -0.42% | -0.20% | -0.36% | -0.26% | -0.27% | -0.14% | -0.25% | |
| CAD | -0.17% | 0.05% | -0.09% | 0.26% | -0.01% | 0.12% | 0.00% | |
| AUD | -0.15% | 0.07% | -0.07% | 0.27% | 0.01% | 0.14% | 0.02% | |
| NZD | -0.30% | -0.07% | -0.22% | 0.14% | -0.12% | -0.14% | -0.12% | |
| CHF | -0.17% | 0.05% | -0.10% | 0.25% | -0.01% | -0.02% | 0.12% |
The heat map shows percentage changes of major currencies against each other. The base currency is picked from the left column, while the quote currency is picked from the top row. For example, if you pick the Australian Dollar from the left column and move along the horizontal line to the US Dollar, the percentage change displayed in the box will represent AUD (base)/USD (quote).

100만 명이 넘는 사용자가 FXStreet를 통해 실시간 시장 데이터, 차트 도구, 전문가 인사이트, 포렉스 뉴스를 이용합니다. 포괄적인 경제 캘린더와 교육 웨비나는 트레이더가 정보를 유지하고 신중한 결정을 내리도록 돕습니다. FXStreet는 바르셀로나 본사와 전 세계 지역에 걸쳐 약 60명의 팀으로 구성되어 있습니다.
더 읽기


