
AUD/USD Price Forecast: Tests 0.7000 support as 14-day RSI suggests overbought conditions
작성자 Akhtar Faruqui
게시일: 30 Jan 2026 | 수정일: 30 Jan 2026


인기 기사

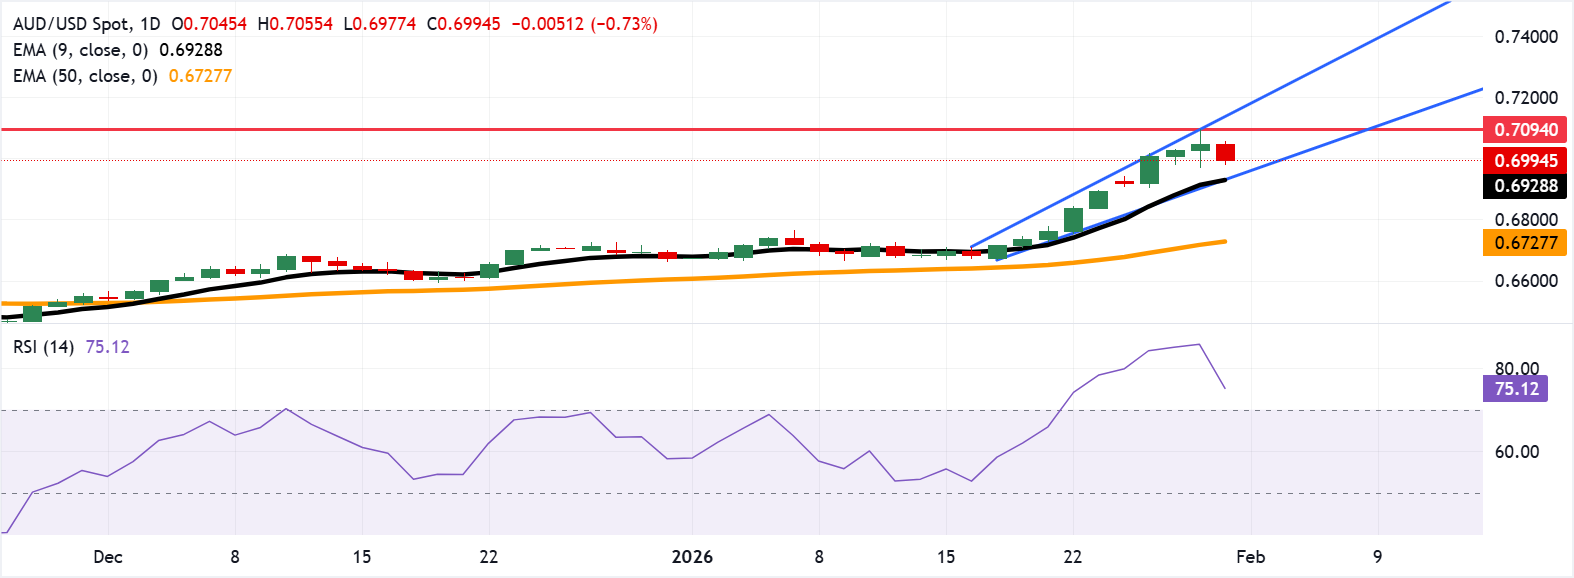
AUD/USD depreciates after three days of gains, trading around 0.7000 during the early European hours on Friday. Daily chart analysis indicates that the pair is remaining within the ascending channel pattern, indicating a persistent bullish bias.
- AUD/USD may test the 0.7094 barrier, the highest since February 2023.
- The 14-day Relative Strength Index is at 79, suggesting stretched momentum, limiting further gains.
- Primary support sits near the confluence at the lower ascending channel and nine-day EMA around 0.6931.
AUD/USD depreciates after three days of gains, trading around 0.7000 during the early European hours on Friday. Daily chart analysis indicates that the pair is remaining within the ascending channel pattern, indicating a persistent bullish bias.
The AUD/USD pair stands firmly above the rising nine-day Exponential Moving Average (EMA) and the 50-day EMA, underscoring a persistent bullish bias. The short-term average accelerates above the medium-term gauge, reinforcing positive momentum.
The 14-day Relative Strength Index (RSI) is at 76.86 (overbought), which could precede a pause or a shallow pullback. RSI has cooled from peak extremes but remains overbought, so momentum stays positive even as upside could slow.
The AUD/USD pair could test the 0.7094, the highest level since February 2023, which was recorded on January 29. Further advances would support the pair to test the upper boundary of the ascending channel around 0.7140.
On the downside, the primary support lies at confluence around the lower ascending channel boundary at the nine-day EMA of 0.6931. A break below the channel and the short-term average would cause the emergence of the bearish bias and put downward pressure on the AUD/USD pair to approach the 50-day EMA at 0.6728.
(The technical analysis of this story was written with the help of an AI tool.)
Australian Dollar Price Today
The table below shows the percentage change of Australian Dollar (AUD) against listed major currencies today. Australian Dollar was the weakest against the US Dollar.
| USD | EUR | GBP | JPY | CAD | AUD | NZD | CHF | |
|---|---|---|---|---|---|---|---|---|
| USD | 0.35% | 0.39% | 0.55% | 0.24% | 0.74% | 0.51% | 0.36% | |
| EUR | -0.35% | 0.05% | 0.20% | -0.11% | 0.40% | 0.17% | 0.01% | |
| GBP | -0.39% | -0.05% | 0.15% | -0.15% | 0.35% | 0.13% | -0.04% | |
| JPY | -0.55% | -0.20% | -0.15% | -0.30% | 0.20% | -0.05% | -0.19% | |
| CAD | -0.24% | 0.11% | 0.15% | 0.30% | 0.50% | 0.26% | 0.12% | |
| AUD | -0.74% | -0.40% | -0.35% | -0.20% | -0.50% | -0.23% | -0.39% | |
| NZD | -0.51% | -0.17% | -0.13% | 0.05% | -0.26% | 0.23% | -0.16% | |
| CHF | -0.36% | -0.01% | 0.04% | 0.19% | -0.12% | 0.39% | 0.16% |
The heat map shows percentage changes of major currencies against each other. The base currency is picked from the left column, while the quote currency is picked from the top row. For example, if you pick the Australian Dollar from the left column and move along the horizontal line to the US Dollar, the percentage change displayed in the box will represent AUD (base)/USD (quote).

100만 명이 넘는 사용자가 FXStreet를 통해 실시간 시장 데이터, 차트 도구, 전문가 인사이트, 포렉스 뉴스를 이용합니다. 포괄적인 경제 캘린더와 교육 웨비나는 트레이더가 정보를 유지하고 신중한 결정을 내리도록 돕습니다. FXStreet는 바르셀로나 본사와 전 세계 지역에 걸쳐 약 60명의 팀으로 구성되어 있습니다.
더 읽기


