
Avalanche Price Forecast: AVAX extends correction as Middle East tensions, weak derivatives weigh on sentiment
작성자 Manish Chhetri
수정됨: 23 Apr 2026


인기 기사

Avalanche (AVAX) price extends losses, trading below $9.30 on Thursday after being rejected at the key resistance zone the previous day. The risk appetite has dampened as Iran opened fire on three ships in the Strait of Hormuz, as the US maintains a blockade, keeping a lid on crypto markets.
- Avalanche price extends its correction on Thursday after being rejected from the key resistance zone the previous day.
- Rising tension and uncertainty in the Middle East, with Iran firing on three ships in the Strait of Hormuz, dampen risk appetite.
- Muted institutional demand and weakening derivatives metrics support a bearish outlook for AVAX.
Avalanche (AVAX) price extends losses, trading below $9.30 on Thursday after being rejected at the key resistance zone the previous day. The risk appetite has dampened as Iran opened fire on three ships in the Strait of Hormuz, as the US maintains a blockade, keeping a lid on crypto markets. Meanwhile, the bearish sentiment strengthens as AVAX’s institutional demand remains muted and as derivatives metrics weaken.
The Middle East conflict caps the risk sentiment
Iran fired on three ships in the Strait of Hormuz and escorted two of them to Iranian waters, the Wall Street Journal reported on Wednesday. The attacks came a day after US President Donald Trump extended a ceasefire while maintaining an American blockade of Iranian ports.
These developments dampened short-term risk sentiment, with risk-sensitive assets such as Bitcoin (BTC) pausing its price surge and trading around $77,800 on Thursday. Meanwhile, altcoins such as Avalanche extend their losses, trading below $9.30 during the same period.
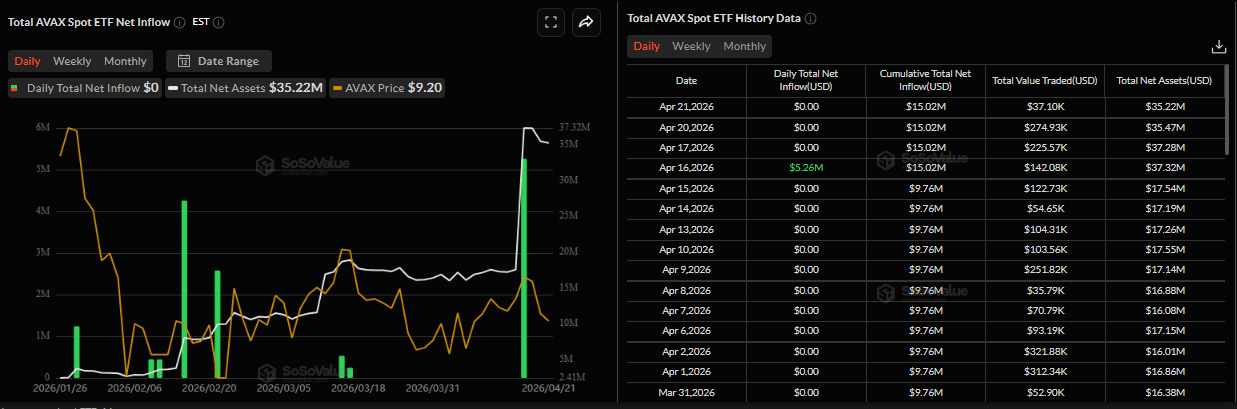
Institutional demand remains muted
Institutional demand for AVAX remained muted so far this week, which has supported its price drop. SoSoValue data shows spot AVAX Exchange Traded Funds (ETFs) have remained silent so far this week, following a $5.26 million inflow last week. This indicates that institutional investors do not want to increase exposure to AVAX amid growing uncertainty in the Middle East.
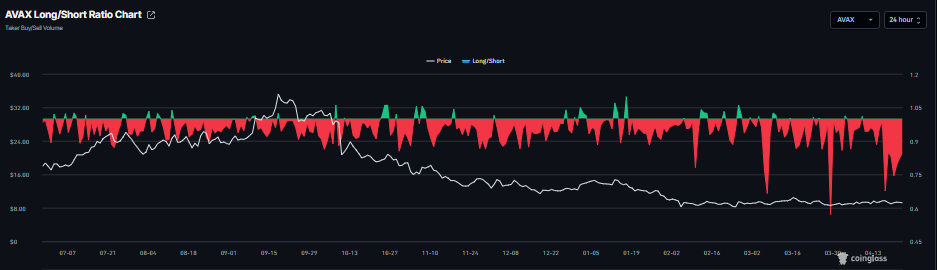
Derivatives data shows a bearish bias
Avalanche’s long-to-short ratio reads 0.84 on Thursday, nearing the lowest level over a month. A ratio below 1 indicates bearish sentiment in the market, as traders are betting the asset’s price will fall.
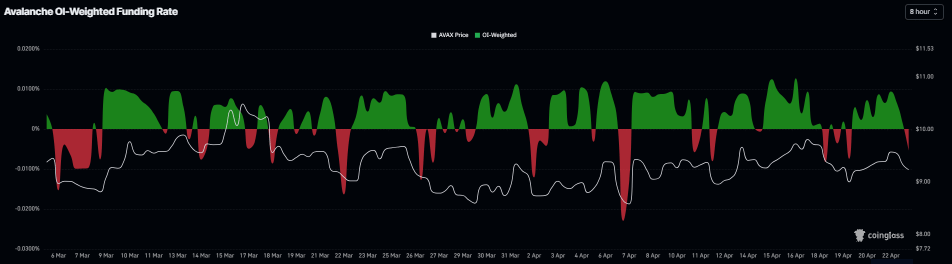
In addition, funding rates data also supports a bearish thesis. CoinGlass’ OI-Weighted Funding Rate data for Avalanche flipped negative on Thursday, reading -0.0054%, indicating that shorts are paying the longs and projecting a bearish outlook.
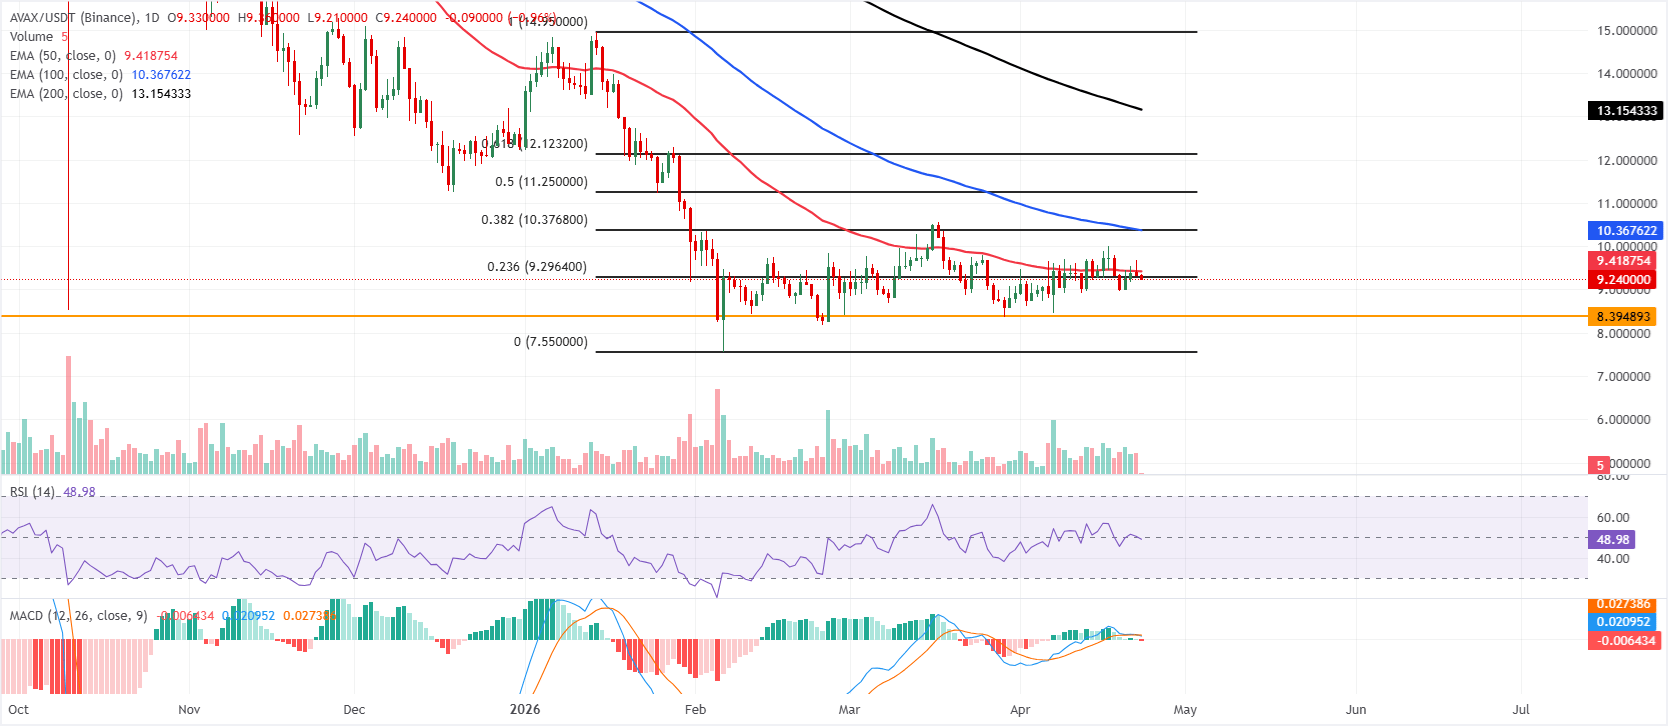
Avalanche Price Forecast: Faces rejection from the key resistance zone
Avalanche price is trading at $9.35 on Thursday, keeping a bearish near-term bias as price holds beneath all the key Exponential Moving Averages (EMAs). The 50-day EMA at $9.41, together with the 100-day EMA at $10.36 and the 200-day EMA at $13.15, line up overhead as dynamic resistance, suggesting rallies are likely to be capped while the pair remains below this stack.
Momentum is mixed but not yet supportive of a bullish turn, with the Relative Strength Index (RSI) on the daily chart hovering just under the neutral 50 mark and the Moving Average Convergence Divergence (MACD) indicator slipping marginally back into negative territory.
On the topside, initial resistance appears at the 23.6% Fibonacci retracement of the latest swing at $9.29, closely followed by the 50-day EMA at $9.41; a sustained break above this area would be needed to ease immediate downside pressure and open the way toward the 100-day EMA near $10.37 and the 38.2% retracement at $10.37.
On the downside, the nearest notable support is the horizontal level at $8.39, where buyers previously emerged; a daily close below that floor would likely expose the prior cycle low region and reinforce the broader bearish structure.
(The technical analysis of this story was written with the help of an AI tool.)

100만 명이 넘는 사용자가 FXStreet를 통해 실시간 시장 데이터, 차트 도구, 전문가 인사이트, 포렉스 뉴스를 이용합니다. 포괄적인 경제 캘린더와 교육 웨비나는 트레이더가 정보를 유지하고 신중한 결정을 내리도록 돕습니다. FXStreet는 바르셀로나 본사와 전 세계 지역에 걸쳐 약 60명의 팀으로 구성되어 있습니다.
더 읽기


