
Bitcoin falls alongside Gold risk-off sentiment tied to Iran war, weighing on markets
작성자 John Isige
게시일: 19 Mar 2026 | 수정일: 19 Mar 2026


인기 기사

Bitcoin (BTC) is extending its decline below $70,000 at the time of writing on Thursday as Iran's war-driven volatility spreads across global markets, leaving a cascade of losses in Gold, Silver and stocks.
- Bitcoin extends its sell-off below $70,000 from its weekly high of $76,000 as risk-off sentiment persists amid Iran’s war.
- Gold plunges by nearly 15% in March, testing support at $4,500 amid deteriorating risk appetite.
- The Middle East war rages on as Iran widens attacks on Gulf countries, hitting Qatar’s LNG facilities.
Bitcoin (BTC) is extending its decline below $70,000 at the time of writing on Thursday as Iran's war-driven volatility spreads across global markets, leaving a cascade of losses in Gold, Silver and stocks.
Iran war weighs on global markets
The Middle East war continues to escalate, with Iran expanding its retaliatory attacks on Gulf countries. A Reuters report states that Iran has blown up 17% of Qatar’s liquefied natural gas (LNG) export capacity. These attacks have caused an estimated $20 billion in annual revenue losses and threatened supplies to Europe and Asia, QatarEnergy CEO Saad al-Kaabi told Reuters on Thursday.
Iran has also put a chokehold on the Strait of Hormuz, cutting off up 20% of global Oil supply. Oil prices remain high, around $96, for the West Texas Intermediate (WTI).
-1773935486829-1773935486831.png)
United States (US) President Donald Trump has called upon NATO allies, including China, to secure the Strait of Hormuz and ease the strain on global oil supplies. Although most countries have remained adamant, Reuters reports that Europe and Japan are considering extending their help to join “appropriate efforts” to stabilize energy markets.
Gold prices tumble as risk-off sentiment persists
Gold is trading 5% lower at around $4,626 amid uncertainty triggered by the Middle East war. The precious metal has fallen by nearly 15% from $5,419 since the beginning of March, reflecting the risk-off sentiment that continues to weigh.
Meanwhile, support at $4,500 appears to hold; however, with the 100-day Exponential Moving Average (EMA) capping rebounds around $4,647, the XAU/USD pair remains at risk of an extension of the sell-off.
The Moving Average Convergence Divergence (MACD) indicator remains below its signal line on the daily chart while green histogram bars expand, prompting traders to reduce their exposure. Similarly, the Relative Strength Index (RSI) at 32 on the same chart nears oversold territory, aligning with the overall downtrend. Closing below the immediate $4,500 support could expose Gold to the 200-day EMA at $4,219.
On the top side, a reversal above the 100-day EMA would strengthen the bullish grip, increasing the odds of a move to the daily high of $4,867.
-1773935373547-1773935373552.png)
Bitcoin under pressure as technicals falter
Bitcoin continues its correction below the $70,000 threshold, after reaching a weekly high of around $76,000 on Tuesday. Technical levels indicate a neutral near-term bias, as price consolidates below the 50-day, 100-day, and 200-day Exponential Moving Averages (EMAs), keeping the broader trend bearish.
The Relative Strength Index (RSI) has eased back toward the high-40s on the daily chart, confirming a bearish shift. Moreover, the Moving Average Convergence Divergence (MACD) indicator is retreating toward its signal line on the same chart, as green histograms contract, prompting traders to reduce their exposure.
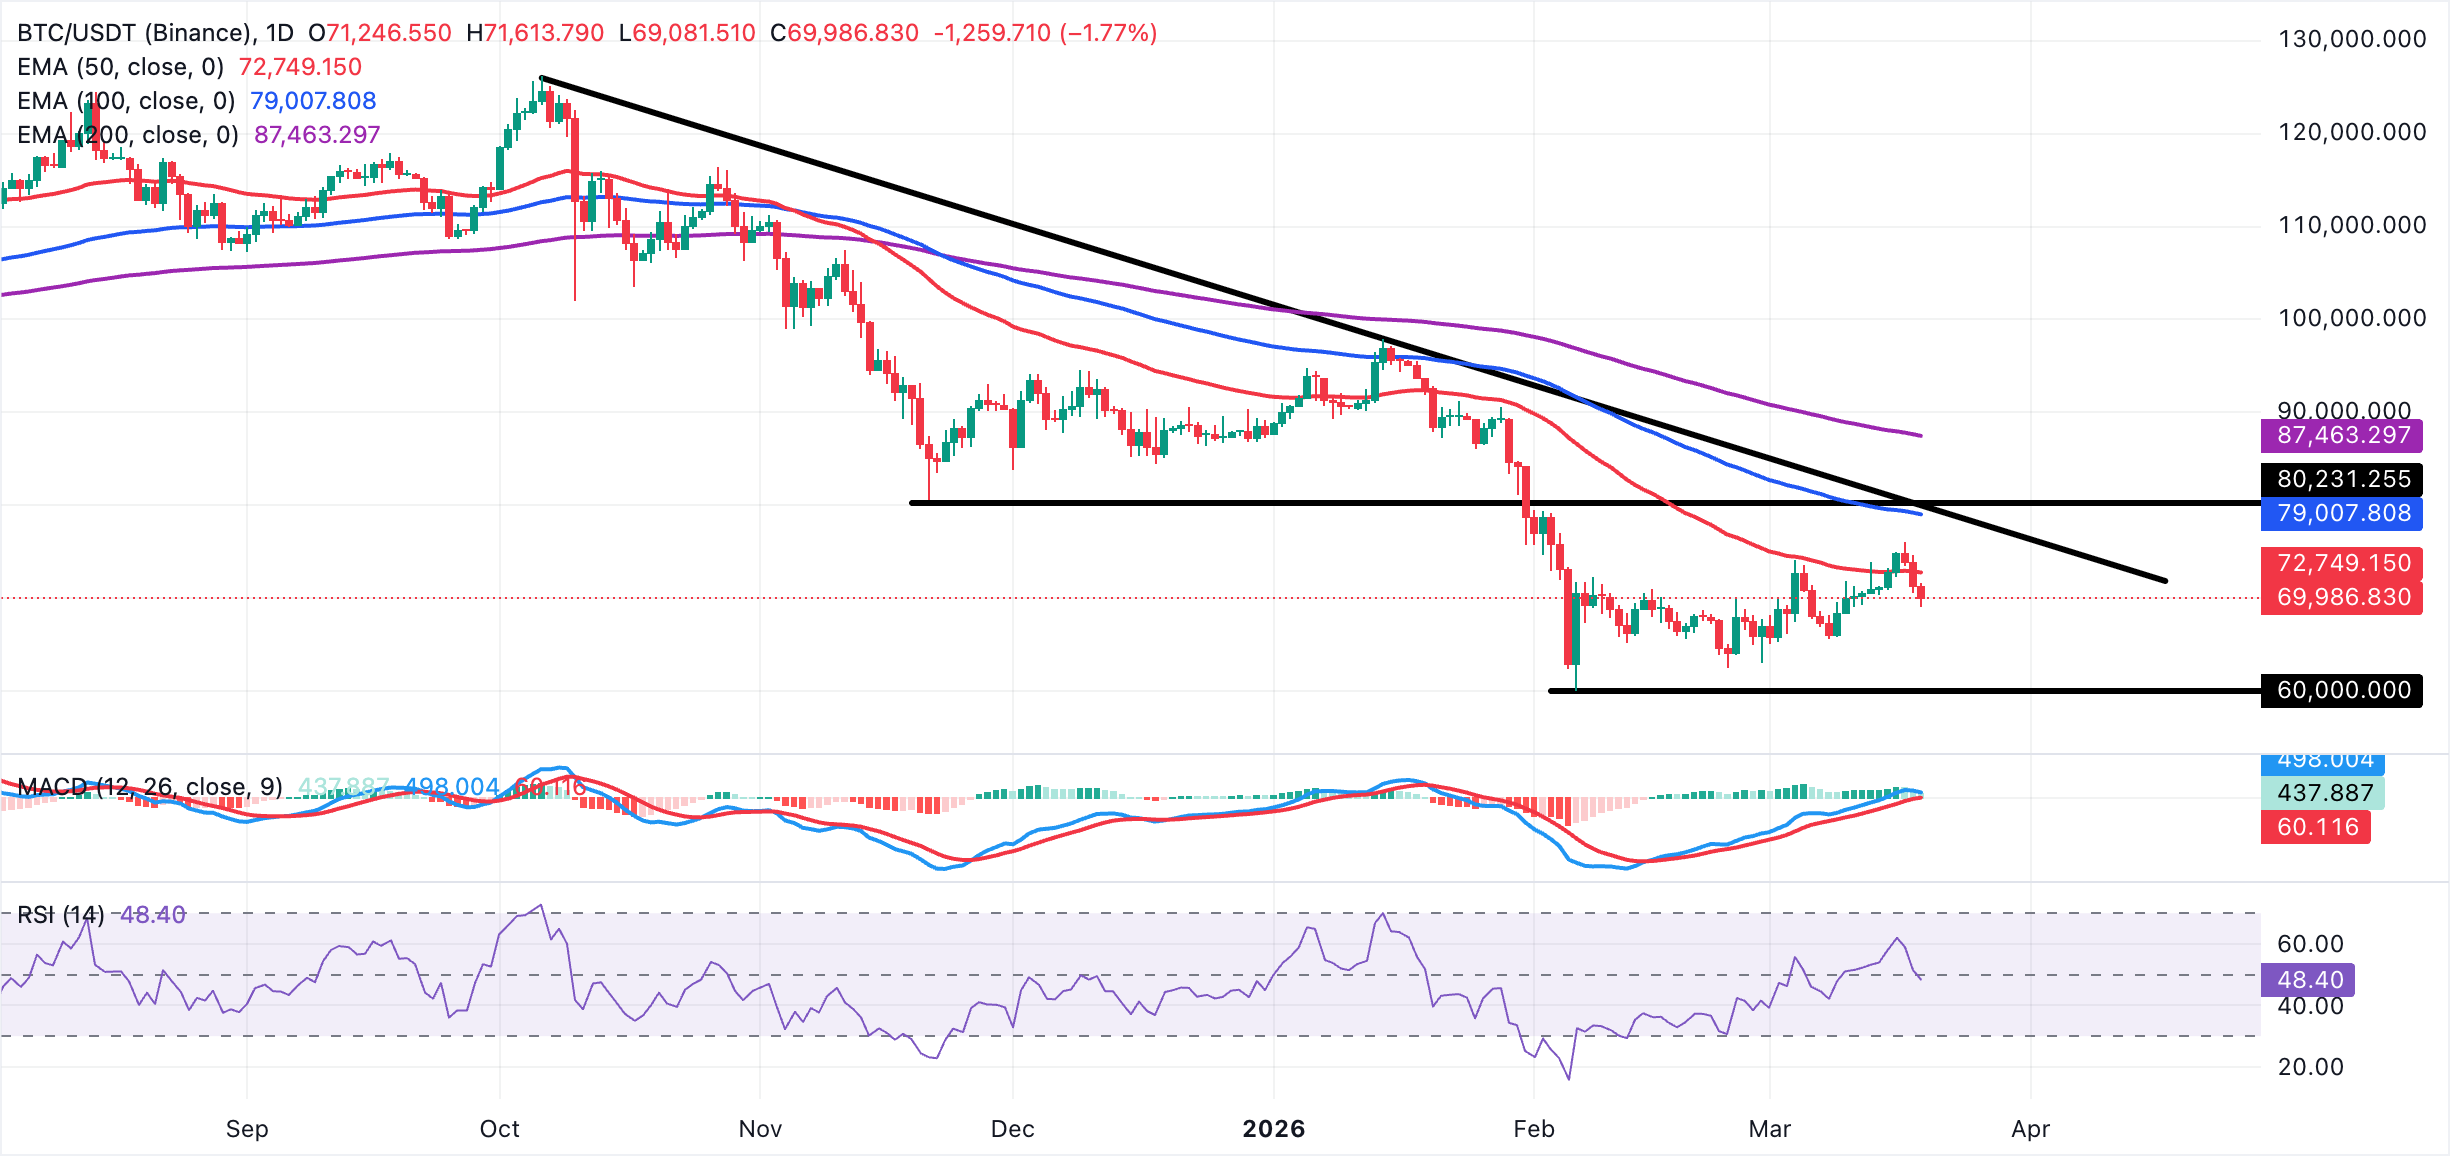
Initial resistance lies at the intraday high around $71,614, followed by the 50-day EMA at $72,749. A break above. On the downside, immediate support is seen around $68,400, with further protection at $67,000, where recent lows cluster and short-term dip-buying appeared.
Gold FAQs
Gold has played a key role in human’s history as it has been widely used as a store of value and medium of exchange. Currently, apart from its shine and usage for jewelry, the precious metal is widely seen as a safe-haven asset, meaning that it is considered a good investment during turbulent times. Gold is also widely seen as a hedge against inflation and against depreciating currencies as it doesn’t rely on any specific issuer or government.
Central banks are the biggest Gold holders. In their aim to support their currencies in turbulent times, central banks tend to diversify their reserves and buy Gold to improve the perceived strength of the economy and the currency. High Gold reserves can be a source of trust for a country’s solvency. Central banks added 1,136 tonnes of Gold worth around $70 billion to their reserves in 2022, according to data from the World Gold Council. This is the highest yearly purchase since records began. Central banks from emerging economies such as China, India and Turkey are quickly increasing their Gold reserves.
Gold has an inverse correlation with the US Dollar and US Treasuries, which are both major reserve and safe-haven assets. When the Dollar depreciates, Gold tends to rise, enabling investors and central banks to diversify their assets in turbulent times. Gold is also inversely correlated with risk assets. A rally in the stock market tends to weaken Gold price, while sell-offs in riskier markets tend to favor the precious metal.
The price can move due to a wide range of factors. Geopolitical instability or fears of a deep recession can quickly make Gold price escalate due to its safe-haven status. As a yield-less asset, Gold tends to rise with lower interest rates, while higher cost of money usually weighs down on the yellow metal. Still, most moves depend on how the US Dollar (USD) behaves as the asset is priced in dollars (XAU/USD). A strong Dollar tends to keep the price of Gold controlled, whereas a weaker Dollar is likely to push Gold prices up.
(The technical analysis of this story was written with the help of an AI tool.)

100만 명이 넘는 사용자가 FXStreet를 통해 실시간 시장 데이터, 차트 도구, 전문가 인사이트, 포렉스 뉴스를 이용합니다. 포괄적인 경제 캘린더와 교육 웨비나는 트레이더가 정보를 유지하고 신중한 결정을 내리도록 돕습니다. FXStreet는 바르셀로나 본사와 전 세계 지역에 걸쳐 약 60명의 팀으로 구성되어 있습니다.
더 읽기


