
Bitcoin Price Forecast: BTC rebounds cautiously after finding support around key technical level
작성자 Manish Chhetri
수정됨: 30 Mar 2026


인기 기사

Bitcoin (BTC) recovers slightly, trading above $67,500 as of writing on Monday, after finding support near a key technical level following two straight weeks of correction.
- Bitcoin price rebounds slightly, retesting a key support level on Monday, after two straight weeks of correction.
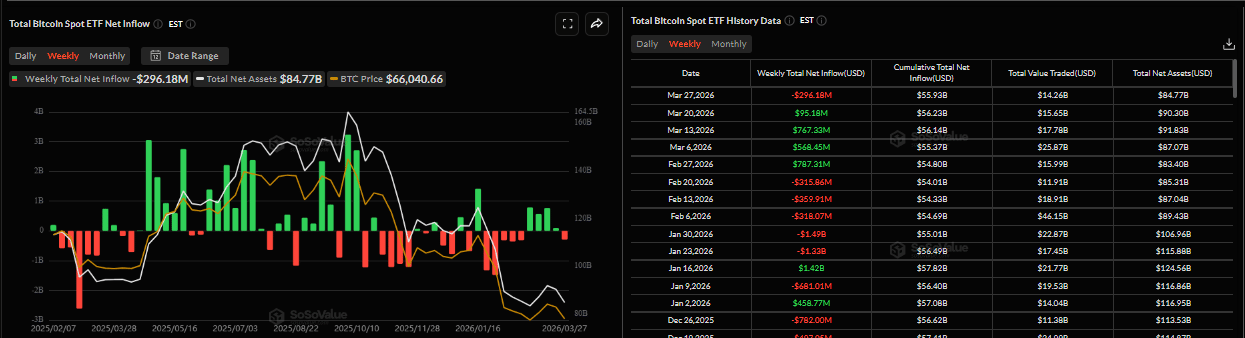
- US-listed spot Bitcoin ETFs recorded an outflow of over $296 million last week, breaking a four-week streak of inflows.
- Traders should be cautious as crypto market sentiment remains at extreme fear levels due to the Middle East war.
Bitcoin (BTC) recovers slightly, trading above $67,500 as of writing on Monday, after finding support near a key technical level following two straight weeks of correction. Despite this mild recovery, market sentiment remains weak as institutional demand waned last week and the escalating Middle East war continues to pressure risk assets, keeping Crypto King traders on edge.
Institutional demand shows early signs of weakness
Institutional demand for Bitcoin shows early signs of weakness. The SoSoValue data below shows that Bitcoin spot Exchange Traded Funds (ETFs) recorded an outflow of $296.18 million last week, breaking a four-week streak of inflows since the end of February. If these outflows continue and strengthen this week, the Bitcoin price could see further correction.
Risk appetite continues to wane as Middle East War escalates
The Middle East war, which began on February 28, enters its 31st day. This prolonged war, now over a month old, continues to escalate with no signs of ending.
The latest reports show that the US is considering a ground invasion of Iran. With this persistent geopolitical uncertainty, market participants now seem convinced that major central banks will adopt a more hawkish stance as the war-driven surge in energy prices continues to fuel inflationary fears.
Such a backdrop generally puts pressure on risk assets, such as Bitcoin, as tighter monetary conditions and risk aversion dampen investor appetite, as this report explains.
Despite this, Bitcoin has shown relative resilience compared to Gold and US equities, which have fallen sharply since the onset of this war, while BTC has been consolidating within a broad range ($65,000-$75,000).
One of the major reasons BTC has not fallen sharply is that the Crypto King, which has been in a downtrend since early October, has corrected nearly 50% from its all-time high of $126,199 to a year-to-date low of $60,000 on February 6, likely absorbing a substantial portion of selling pressure.
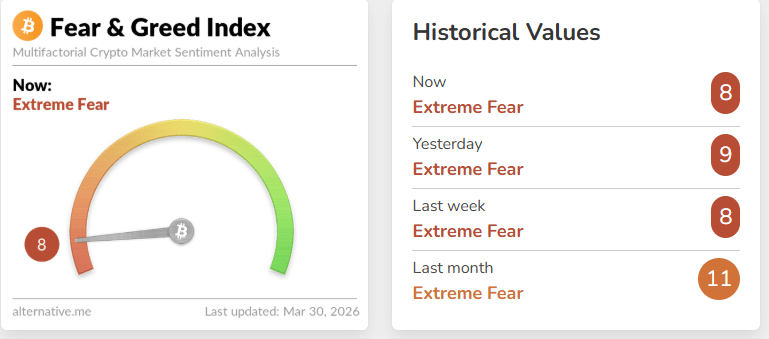
However, overall risk sentiment remains fragile, with the Fear & Greed Index across the crypto market falling back to the extreme fear zone, to 8 on Monday, highlighting a sharp deterioration in market sentiment and rising investor caution.
Volatile week ahead
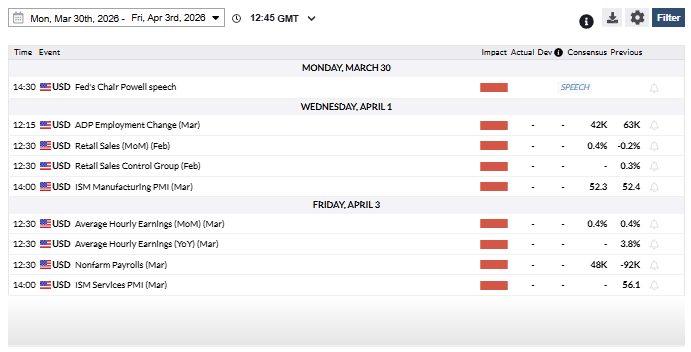
Apart from cautious trading, market participants should keep an eye on the macroeconomic data releases scheduled for this week, as shown in the economic calendar below.
The week starts with remarks from Federal Reserve (Fed) Chair Jerome Powell on Monday, which could provide fresh cues on the central bank’s policy outlook. In addition, key US data include Automatic Data Processing (ADP) employment figures, the Institute for Supply Management (ISM) manufacturing and services Purchasing Managers' Indexes (PMI) and March Nonfarm Payrolls (NFP) report. Traders will assess the path of interest rates and the broader economic health amid growing war uncertainty.
Bitcoin Price Forecast: BTC rebound testing the lower consolidating boundary
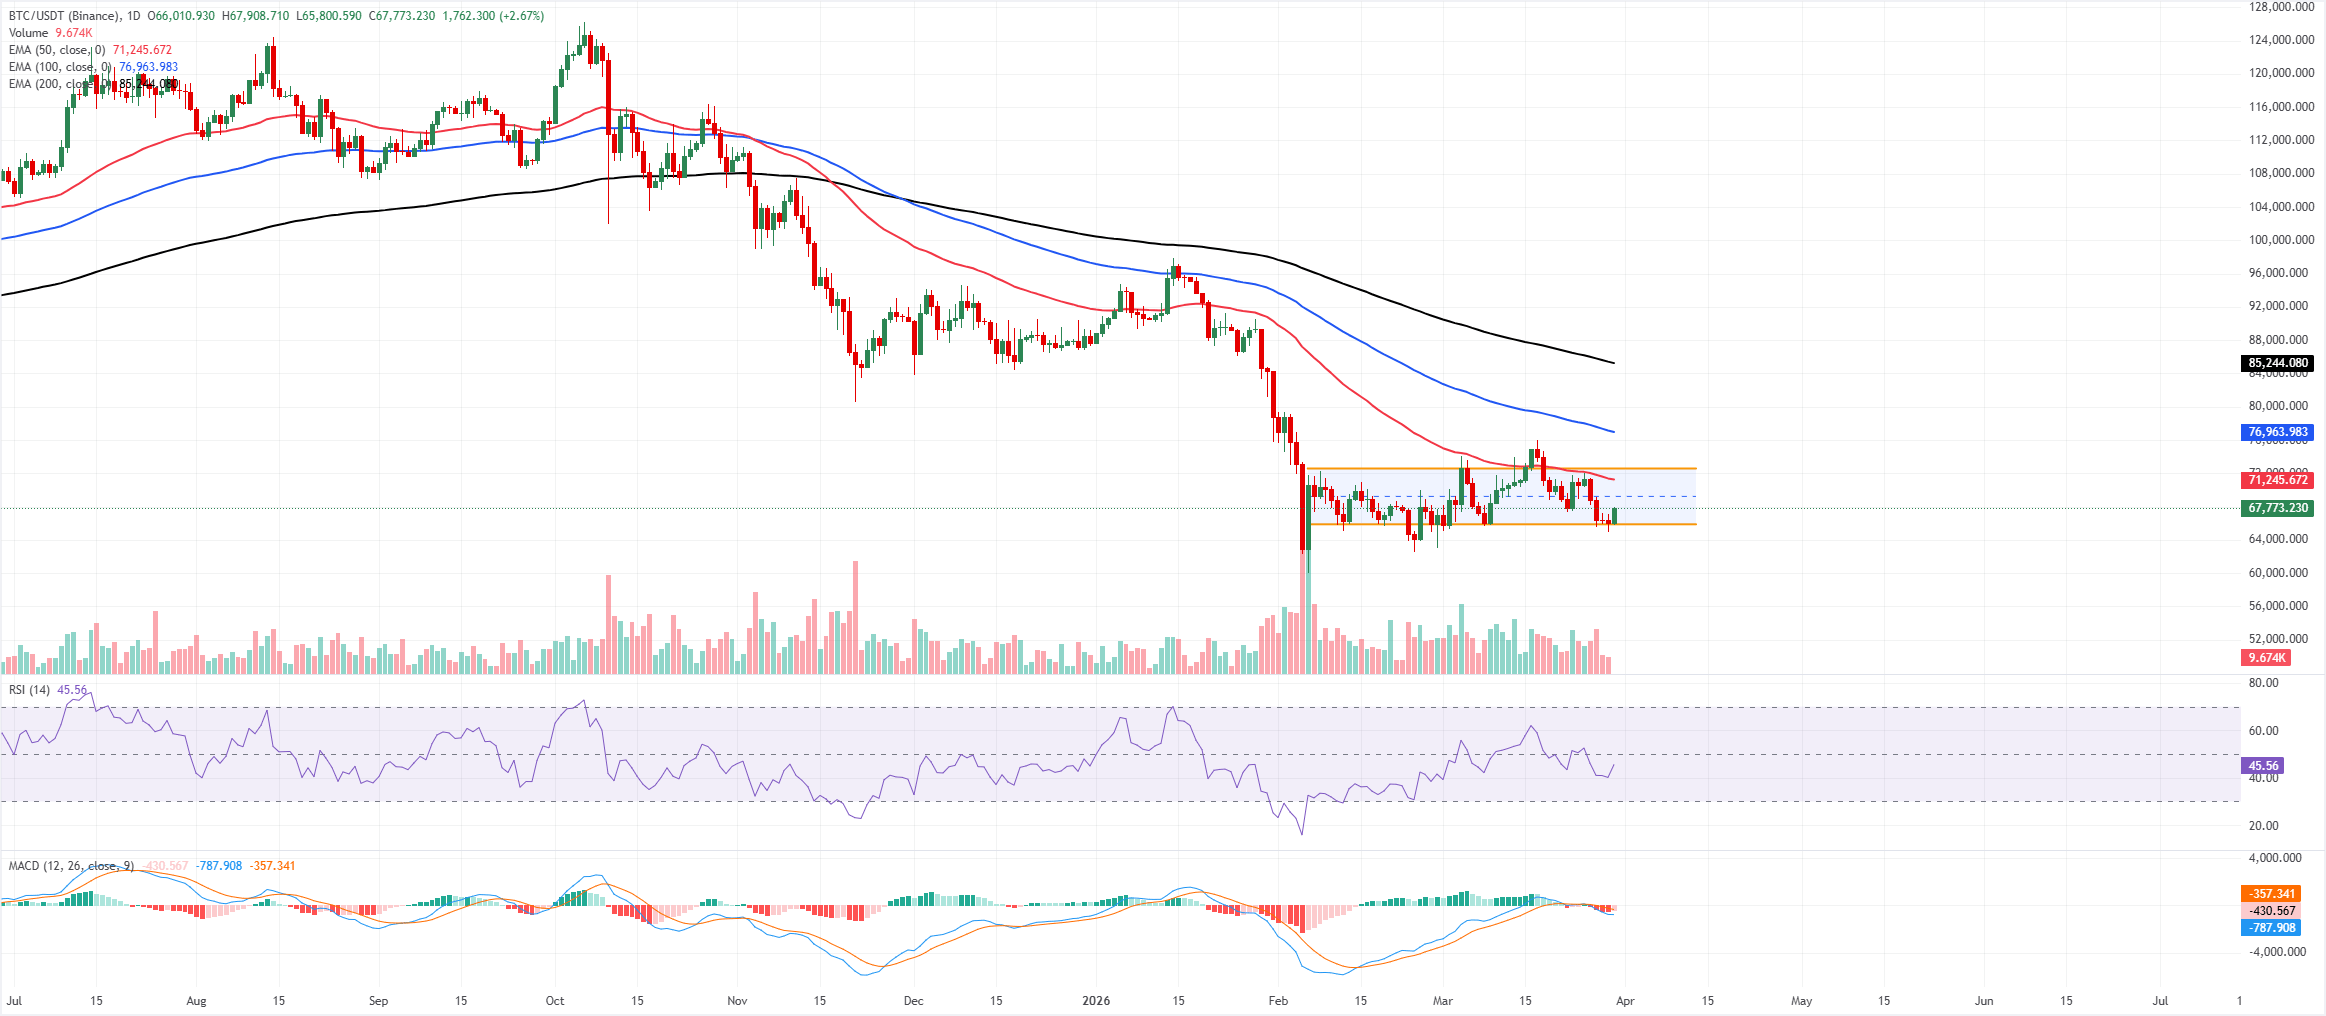
Bitcoin price is trading at $67,500 on Monday, recovering slightly after retesting the lower boundary of a horizontal channel near $65,900. The near-term bias is mildly bearish as the 50-day, 100-day and 200-day Exponential Moving Averages all remain well above the current trading price, underscoring a corrective phase within a broader downbeat structure.
The Relative Strength Index (RSI) on the daily chart at 45 stays below the 50 line, signaling persistent downside pressure, while the Moving Average Convergence Divergence (MACD) indicator slips further below the zero line with a negative histogram, reinforcing weakening momentum.
Initial resistance emerges near the mid-point of the channel near $69,200, followed by the channel top around $72,600, where a daily close above would be needed to challenge the bearish channel and open room toward the $76,000, the March 17 high.
On the downside, immediate support lies near the channel base at $65,900, with a breakdown exposing the $66,000 psychological level. The clustered EMAs above price define a broad resistance zone, so any recovery into the $71,000–$73,000 band would face selling interest unless momentum improves materially.
(The technical analysis of this story was written with the help of an AI tool.)
Bitcoin, altcoins, stablecoins FAQs
Bitcoin is the largest cryptocurrency by market capitalization, a virtual currency designed to serve as money. This form of payment cannot be controlled by any one person, group, or entity, which eliminates the need for third-party participation during financial transactions.
Altcoins are any cryptocurrency apart from Bitcoin, but some also regard Ethereum as a non-altcoin because it is from these two cryptocurrencies that forking happens. If this is true, then Litecoin is the first altcoin, forked from the Bitcoin protocol and, therefore, an “improved” version of it.
Stablecoins are cryptocurrencies designed to have a stable price, with their value backed by a reserve of the asset it represents. To achieve this, the value of any one stablecoin is pegged to a commodity or financial instrument, such as the US Dollar (USD), with its supply regulated by an algorithm or demand. The main goal of stablecoins is to provide an on/off-ramp for investors willing to trade and invest in cryptocurrencies. Stablecoins also allow investors to store value since cryptocurrencies, in general, are subject to volatility.
Bitcoin dominance is the ratio of Bitcoin's market capitalization to the total market capitalization of all cryptocurrencies combined. It provides a clear picture of Bitcoin’s interest among investors. A high BTC dominance typically happens before and during a bull run, in which investors resort to investing in relatively stable and high market capitalization cryptocurrency like Bitcoin. A drop in BTC dominance usually means that investors are moving their capital and/or profits to altcoins in a quest for higher returns, which usually triggers an explosion of altcoin rallies.

100만 명이 넘는 사용자가 FXStreet를 통해 실시간 시장 데이터, 차트 도구, 전문가 인사이트, 포렉스 뉴스를 이용합니다. 포괄적인 경제 캘린더와 교육 웨비나는 트레이더가 정보를 유지하고 신중한 결정을 내리도록 돕습니다. FXStreet는 바르셀로나 본사와 전 세계 지역에 걸쳐 약 60명의 팀으로 구성되어 있습니다.
더 읽기


