
Bitcoin Price Forecast: BTC retreats from key technical level as institutional demand stays muted
작성자 Manish Chhetri
수정됨: 26 Mar 2026


인기 기사

Bitcoin (BTC) falls back below $70,000 at the time of writing on Thursday after being rejected around a key technical level the previous day. The bearish market sentiment strengthens amid uncertainty over the US-Iran ceasefire plan, which seems to be sidelining institutional demand as well.
- Bitcoin trades in the red on Thursday after failing to overcome the 50-day EMA at $72,200.
- Institutional demand remains subdued amid the uncertainty over the US-Iran ceasefire plan.
- Reports suggest that Strategy remains the sole BTC buyer amid big corporates at current market conditions as others have failed to sustain demand.
Bitcoin (BTC) falls back below $70,000 at the time of writing on Thursday after being rejected around a key technical level the previous day. The bearish market sentiment strengthens amid uncertainty over the US-Iran ceasefire plan, which seems to be sidelining institutional demand as well.
Iran-US peace deal still uncertain
The ongoing talks about a potential ceasefire deal between the US and Iran remain highly uncertain. The latest developments came in on Thursday as US President Donald Trump reiterated that Iran is negotiating to end the war.
“They are negotiating, by the way, and they want to make a deal so badly. But they’re afraid to say it, because they figure they’ll be killed by their own people,” Trump said.
Meanwhile, Iranian Foreign Minister Abbas Araghchi said on state TV that his government had not engaged in talks to end the war, citing that “we do not plan on any negotiations.”
Traders should be cautious as negotiations around the ceasefire deal remain highly uncertain, with the latest news suggesting a slight negative outcome. If this scenario plays out, Monday’s BTC recovery could be erased in the coming days.
Institutional investors remain muted
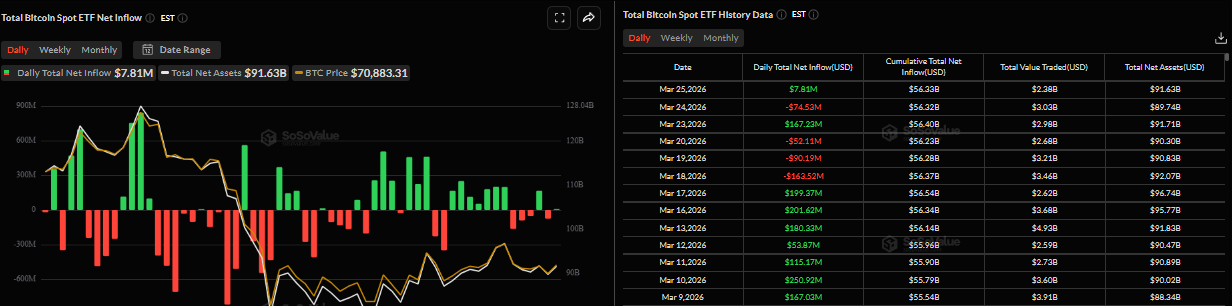
Institutional flows reflect the mixed sentiment that is prevalent in markets. SoSoValue data show that Bitcoin spot Exchange Traded Funds (ETFs) have seen alternating inflows and outflows this week, beginning with positive flows of $167.23 million on Monday, followed by an outflow of $74.53 million on Tuesday, and then a mild inflow of $7.81 million on Wednesday. This highlights indecisiveness among institutional investors amid prevailing market uncertainty.
Is Strategy the only one buying BTC?
CryptoQuant’s weekly report on Wednesday highlighted that Strategy (MSTR) is the sole driver of Bitcoin treasury demand.
The report explained that MSTR has accumulated more than 45,000 BTC in the last 30 days, the highest 30-day purchase since April 2025. On the contrary, BTC purchases from all other treasury companies have collapsed, totaling 1,000 BTC in the last 30 days, a 99% decline from the high of 69,000 BTC in August 2025. Moreover, the share of purchases from these other treasury companies has declined to 2%, from 95% in October last year.
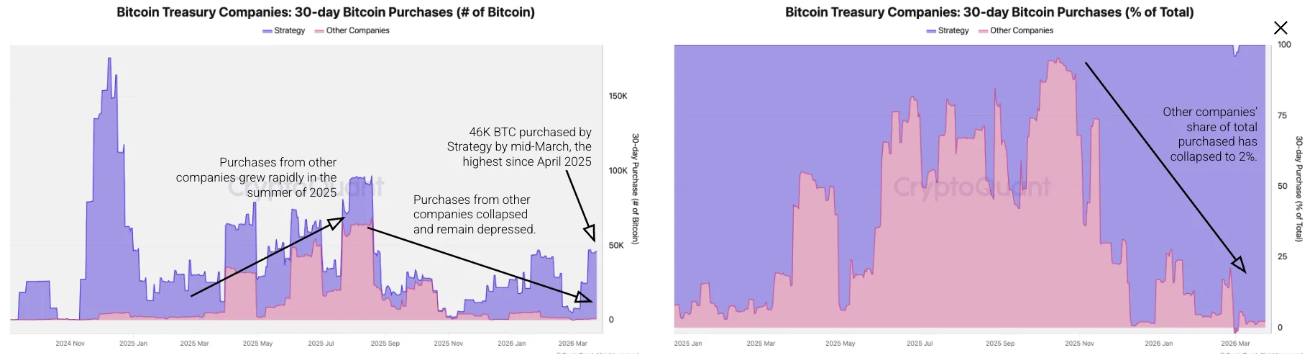
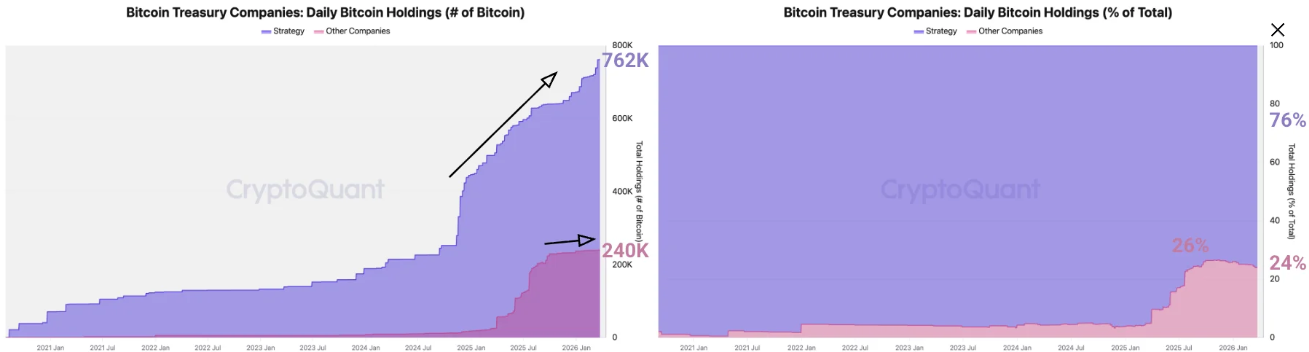
“As a result of the above dynamics, Strategy’s holdings reached new record-highs, while the holdings of the other companies have stalled,” said CryptoQuant analyst.
The share of total holdings from these companies has declined from a high of 26% in November 2025 to 24% today.
In an exclusive interview, Analyst at Bitget Wallet Lacie Zhang told FXStreet, “We believe Strategy's current aggressive accumulation provides significant support to BTC's price. Its weekly purchases of several hundred million dollars are directly removing liquidity from the market, becoming a key price anchor, especially as other institutional reserves continue to decline.”
Zhang continued, “In the short term (within 2026), based on the current pace (approximately $500-600 million per week), this accumulation can support BTC maintaining relative stability around current price levels and even provide a buffer during pullbacks. Combined with large-scale financings such as the 21/21 plan, the supportive effect could extend through the advancement of its year-end targets.”
When asked about how long this process can be sustained? Bitget analyst replied, “This process is likely to continue for a considerable period, as Strategy not only relies on equity and perpetual preferred stock issuances (such as STRC), but can also generate cash flow by selling or converting its existing convertible bonds and other equity- or bond-class assets to purchase more BTC. As long as mNAV > 1 (currently around 1.21x), such issuances remain accretive, creating a positive flywheel that allows it to sustain its "never sell" Bitcoin treasury strategy long-term without relying on core software cash flows, until market conditions or valuation shifts prompt adjustments.”
Bitcoin Price Forecast: BTC faces rejection from the key resistance zone
Bitcoin price is trading below $70,000 as of writing on Thursday. The near-term bias stays mildly bearish as price holds within a parallel channel, with the latest close lodged beneath the upper boundary near $72,600, signaling that rallies remain capped.
In addition, BTC trades well below the 50-day and 100-day Exponential Moving Averages clustered around $72,100 and $77,800, respectively, with price action validating the 50-day EMA retest on Wednesday and dropping the next day.
The Relative Strength Index (RSI) on the daily chart at 48 leans slightly bearish after recovering from lower readings, while the Moving Average Convergence Divergence (MACD) hovers close to the signal line with contracting histogram bars, suggesting momentum is still fragile and lacks sustained upside conviction.
Immediate resistance sits at the channel top around $72,600, followed by the 50-day EMA near $72,100, and then the 100-day EMA near $77,800, where a daily close above this level would be needed to neutralize the current downside bias.
On the downside, initial support lies near $69,000, the midpoint of the horizontal channel, followed by a deeper level around $65,900, which aligns with the lower part of the consolidation range. A break below this area would trigger deeper losses toward $60,000, a key psychological level.
-1774523157777-1774523157778.png)
(The technical analysis of this story was written with the help of an AI tool.)
Bitcoin, altcoins, stablecoins FAQs
Bitcoin is the largest cryptocurrency by market capitalization, a virtual currency designed to serve as money. This form of payment cannot be controlled by any one person, group, or entity, which eliminates the need for third-party participation during financial transactions.
Altcoins are any cryptocurrency apart from Bitcoin, but some also regard Ethereum as a non-altcoin because it is from these two cryptocurrencies that forking happens. If this is true, then Litecoin is the first altcoin, forked from the Bitcoin protocol and, therefore, an “improved” version of it.
Stablecoins are cryptocurrencies designed to have a stable price, with their value backed by a reserve of the asset it represents. To achieve this, the value of any one stablecoin is pegged to a commodity or financial instrument, such as the US Dollar (USD), with its supply regulated by an algorithm or demand. The main goal of stablecoins is to provide an on/off-ramp for investors willing to trade and invest in cryptocurrencies. Stablecoins also allow investors to store value since cryptocurrencies, in general, are subject to volatility.
Bitcoin dominance is the ratio of Bitcoin's market capitalization to the total market capitalization of all cryptocurrencies combined. It provides a clear picture of Bitcoin’s interest among investors. A high BTC dominance typically happens before and during a bull run, in which investors resort to investing in relatively stable and high market capitalization cryptocurrency like Bitcoin. A drop in BTC dominance usually means that investors are moving their capital and/or profits to altcoins in a quest for higher returns, which usually triggers an explosion of altcoin rallies.

100만 명이 넘는 사용자가 FXStreet를 통해 실시간 시장 데이터, 차트 도구, 전문가 인사이트, 포렉스 뉴스를 이용합니다. 포괄적인 경제 캘린더와 교육 웨비나는 트레이더가 정보를 유지하고 신중한 결정을 내리도록 돕습니다. FXStreet는 바르셀로나 본사와 전 세계 지역에 걸쳐 약 60명의 팀으로 구성되어 있습니다.
더 읽기


