
Bitcoin Price Forecast: BTC slips below $69,000 as crypto market shows cautious stabilization
작성자 Manish Chhetri
게시일: 10 Feb 2026 | 수정일: 10 Feb 2026


인기 기사

Bitcoin (BTC) price is nearing the lower consolidation boundary, trading below $69,000 at the time of writing on Tuesday. A breakdown below this key level would suggest a correction toward $60,000. However, institutional and corporate demand support a short-term stabilization in BTC.
- Bitcoin nears the lower consolidation boundary at $67,300, a breakdown could revisit the $60,000 low.
- US-listed spot ETFs recorded a mild inflow of $145 million and Strategy added 1,142 BTC to its reserve on Monday.
- Easing sell pressure and tentative buyer engagement reflect churn after downside repricing, reports show.
Bitcoin (BTC) price is nearing the lower consolidation boundary, trading below $69,000 at the time of writing on Tuesday. A breakdown below this key level would suggest a correction toward $60,000. However, institutional and corporate demand support a short-term stabilization in BTC. Furthermore, on-chain data for the Crypto King indicates easing sell pressure and tentative buyer engagement, suggesting cautious stabilization.
Mild inflow in institutional demand
Institutional demand shows mild signs of recovery. According to SoSoValue data, spot Bitcoin Exchange Traded Funds (ETFs) recorded a mild inflow of $145 million on Monday, marking the second consecutive day of inflows following $371.15 million on Friday. If this inflow continues and intensifies, BTC could see some recovery.
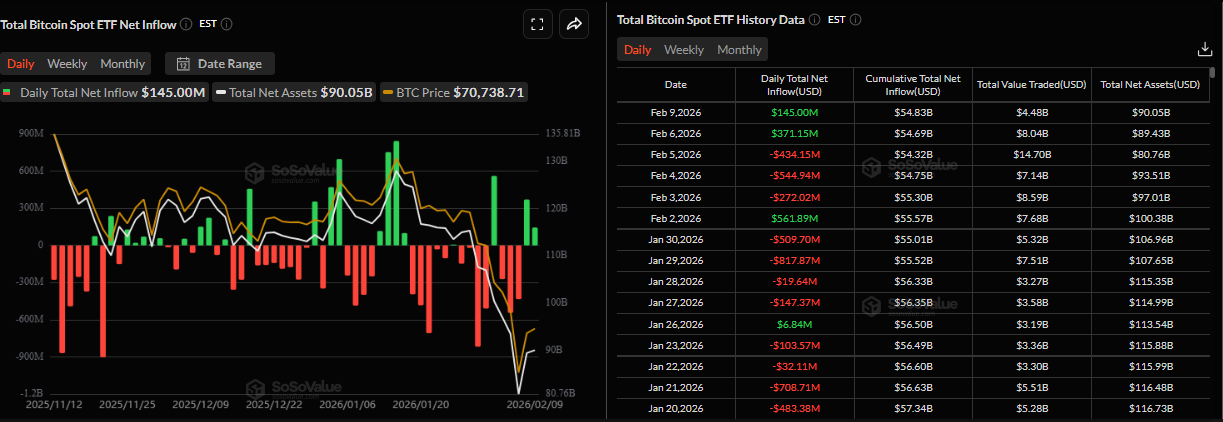
On the corporate front, Strategy (MSTR) announced on Monday that it purchased 1,142 BTC, bringing its total holdings to 714,644 BTC. This purchase highlights the firm’s continued aggressive accumulation strategy and long-term conviction in Bitcoin, despite ongoing market weakness, as its average purchase price is $76,056.
On-chain data suggests cautious stabilization
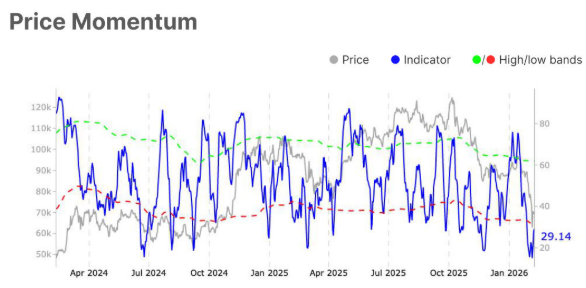
Glassnode's weekly report on Monday highlighted that momentum has improved from deeply oversold levels, with the 14-day, Relative Strength Index (RSI) rebounding toward its lower statistical band, signalling easing sell pressure and tentative buyer engagement, as shown in the chart.
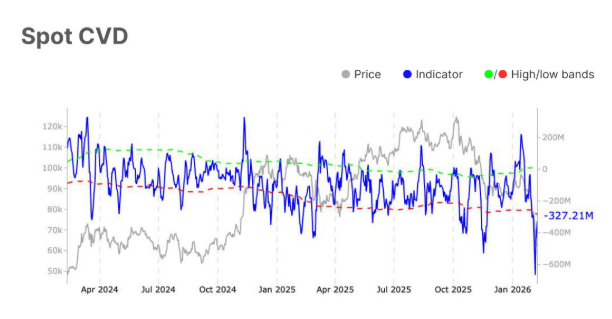
However, the Spot volumes chart below shows that volumes have expanded materially, yet activity remains reactive rather than constructive, reflecting churn following downside repricing rather than decisive accumulation.
“Overall, conditions remain defensive across spot, derivatives, ETFs, and on-chain indicators,” reports Glassnode analyst.
The analyst continued, "Profitability is compressed, capital flows are negative, and hedging demand remains elevated following the downside repricing. While some signals suggest selling pressure may be moderating, a durable recovery likely depends on renewed spot demand capable of stabilising prices above recent lows.”
Bitcoin Price Forecast: BTC bears aiming to revisit $60,000
The Bitcoin price on the 4-hour chart shows that the Crypto King has been trading sideways between $67,300 and $71,751 after recovering from a low of $60,000 on Friday. As of Tuesday, BTC is nearing the lower boundary of this consolidation.
If BTC breaks and closes below the lower consolidation boundary at $67,300, it could extend the correction to revisit Friday’s low at $60,000.
The Relative Strength Index (RSI) on the 4-hour chart slipped below the neutral level of 50, indicating bearish momentum gaining traction. The Moving Average Convergence Divergence (MACD) lines on the same chart are converging, increasing the likelihood of a bearish crossover. If the MACD confirms a bearish crossover, it would indicate bearish momentum and further support the negative outlook.
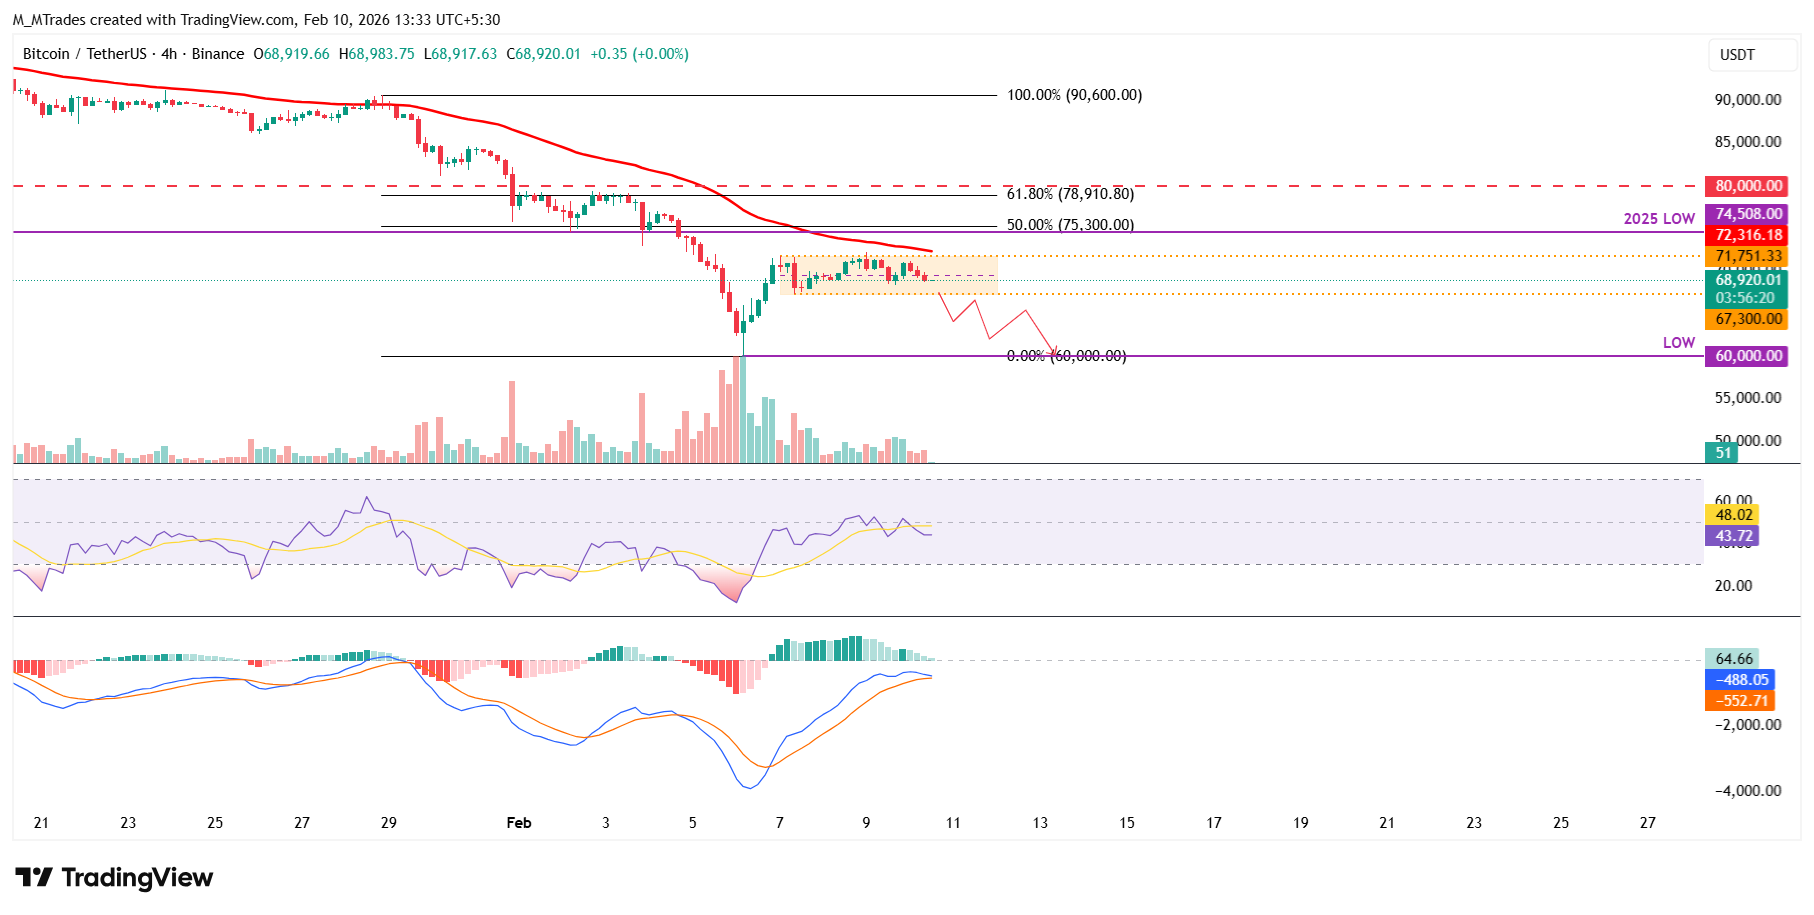
The daily chart also shows signs of weakness after Bitcoin declined nearly 9% last week, reaching a low of $60,000 on Friday, before rebounding. BTC retested the daily resistance at $73,072 on Sunday and has been declining slightly by Tuesday.
If BTC continues its downward trend, it could extend the decline toward the 78.6% Fibonacci retracement (drawn from the August 2024 low of $49,000 to the October 2025 all-time high of $126,199) at $65,520.
The RSI on the daily chart is at 32, pointing downward towards the oversold territory, suggesting bearish momentum is gaining traction. In addition, the MACD in the same period shows a bearish crossover, suggesting a continuation of the downward trend.
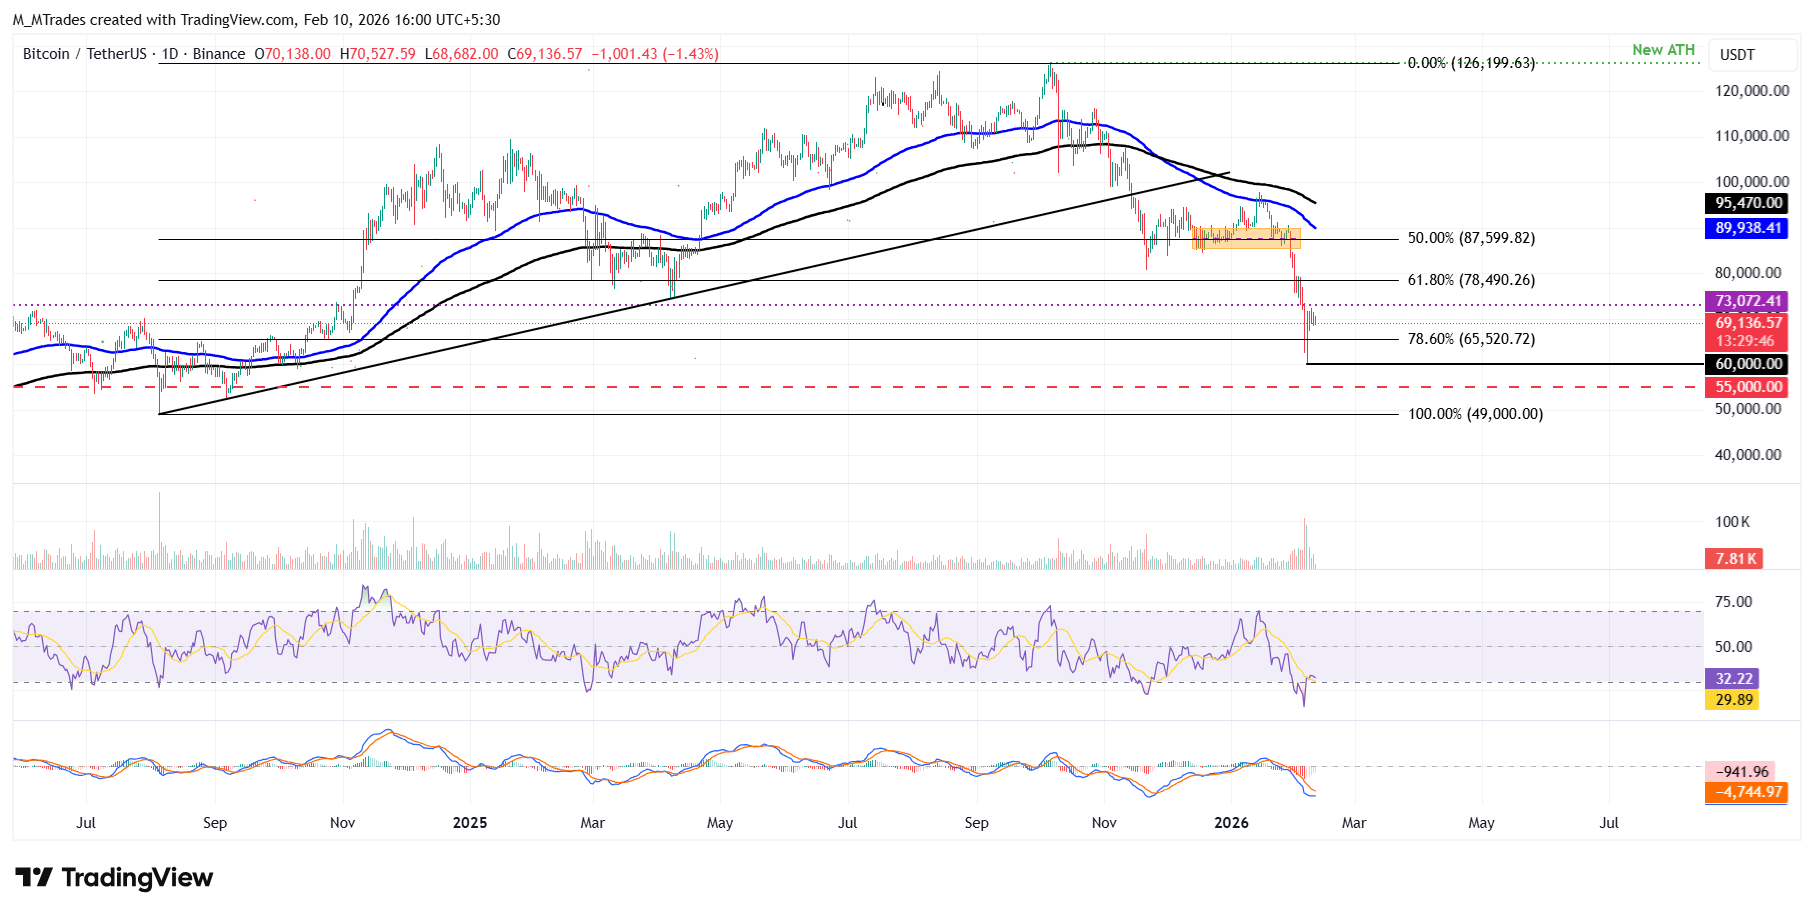
On the contrary, if BTC continues its recovery, it could extend the advance toward the daily resistance at $73,072.
Bitcoin, altcoins, stablecoins FAQs
Bitcoin is the largest cryptocurrency by market capitalization, a virtual currency designed to serve as money. This form of payment cannot be controlled by any one person, group, or entity, which eliminates the need for third-party participation during financial transactions.
Altcoins are any cryptocurrency apart from Bitcoin, but some also regard Ethereum as a non-altcoin because it is from these two cryptocurrencies that forking happens. If this is true, then Litecoin is the first altcoin, forked from the Bitcoin protocol and, therefore, an “improved” version of it.
Stablecoins are cryptocurrencies designed to have a stable price, with their value backed by a reserve of the asset it represents. To achieve this, the value of any one stablecoin is pegged to a commodity or financial instrument, such as the US Dollar (USD), with its supply regulated by an algorithm or demand. The main goal of stablecoins is to provide an on/off-ramp for investors willing to trade and invest in cryptocurrencies. Stablecoins also allow investors to store value since cryptocurrencies, in general, are subject to volatility.
Bitcoin dominance is the ratio of Bitcoin's market capitalization to the total market capitalization of all cryptocurrencies combined. It provides a clear picture of Bitcoin’s interest among investors. A high BTC dominance typically happens before and during a bull run, in which investors resort to investing in relatively stable and high market capitalization cryptocurrency like Bitcoin. A drop in BTC dominance usually means that investors are moving their capital and/or profits to altcoins in a quest for higher returns, which usually triggers an explosion of altcoin rallies.

100만 명이 넘는 사용자가 FXStreet를 통해 실시간 시장 데이터, 차트 도구, 전문가 인사이트, 포렉스 뉴스를 이용합니다. 포괄적인 경제 캘린더와 교육 웨비나는 트레이더가 정보를 유지하고 신중한 결정을 내리도록 돕습니다. FXStreet는 바르셀로나 본사와 전 세계 지역에 걸쳐 약 60명의 팀으로 구성되어 있습니다.
더 읽기


