

Bitcoin Price Forecast: BTC steadies amid mixed sentiment surrounding potential US-Iran peace deal
- Bitcoin steadies at $77,000 on Monday after two weeks of correction amid increasing hopes of a peace deal between Iran and the US.
- Sentiment remains mixed as uncertainty persists over key issues, decreasing the chances of an imminent deal.
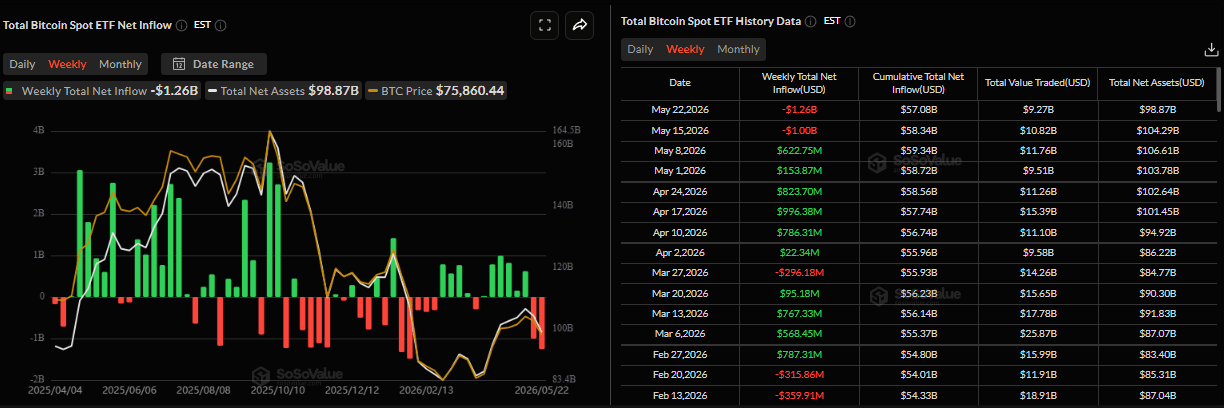
- US-listed spot ETF recorded an outflow of $1.26 billion last week, marking the second week of steady withdrawals.
Bitcoin (BTC) consolidates around $77,000 at the time of writing on Monday after declining more than 6% over the past two weeks. Market sentiment remains mixed as uncertainty over key issues in a potential US-Iran peace deal persists, reducing the chances of an imminent deal. Meanwhile, fading institutional demand continues to weigh on Crypto King’s outlook, with spot Exchange Traded Funds (ETFs) recording a second consecutive week of outflows totaling over $1 billion.

US-Iran peace deal uncertainty persists
Mixed sentiment continues to surround the potential US-Iran peace deal, as Iran stated on Monday that progress has been made on several issues in a possible US memorandum, but no agreement is close.
Iranian Foreign Ministry spokesperson Esmaeil Baghaei noted that “Tehran is focused on ending the war, not nuclear negotiations, and warned that shifting US positions continue to complicate any deal”.
These developments are keeping BTC sentiment cautious, limiting appetite for risk and capping its upside, with BTC steadying around $77,000 as of writing on Monday.
Billions in outflows
Institutional demand supported its ongoing price correction. SoSoValue data showed that spot BTC ETFs recorded an outflow of $1.26 billion last week, marking the second consecutive week of withdrawals. Moreover, the previous week’s outflows marked the highest outflows since early February. If this trend continues and intensifies this week, BTC could see further corrections.
Bitcoin Price Forecast: Steadies around key supports
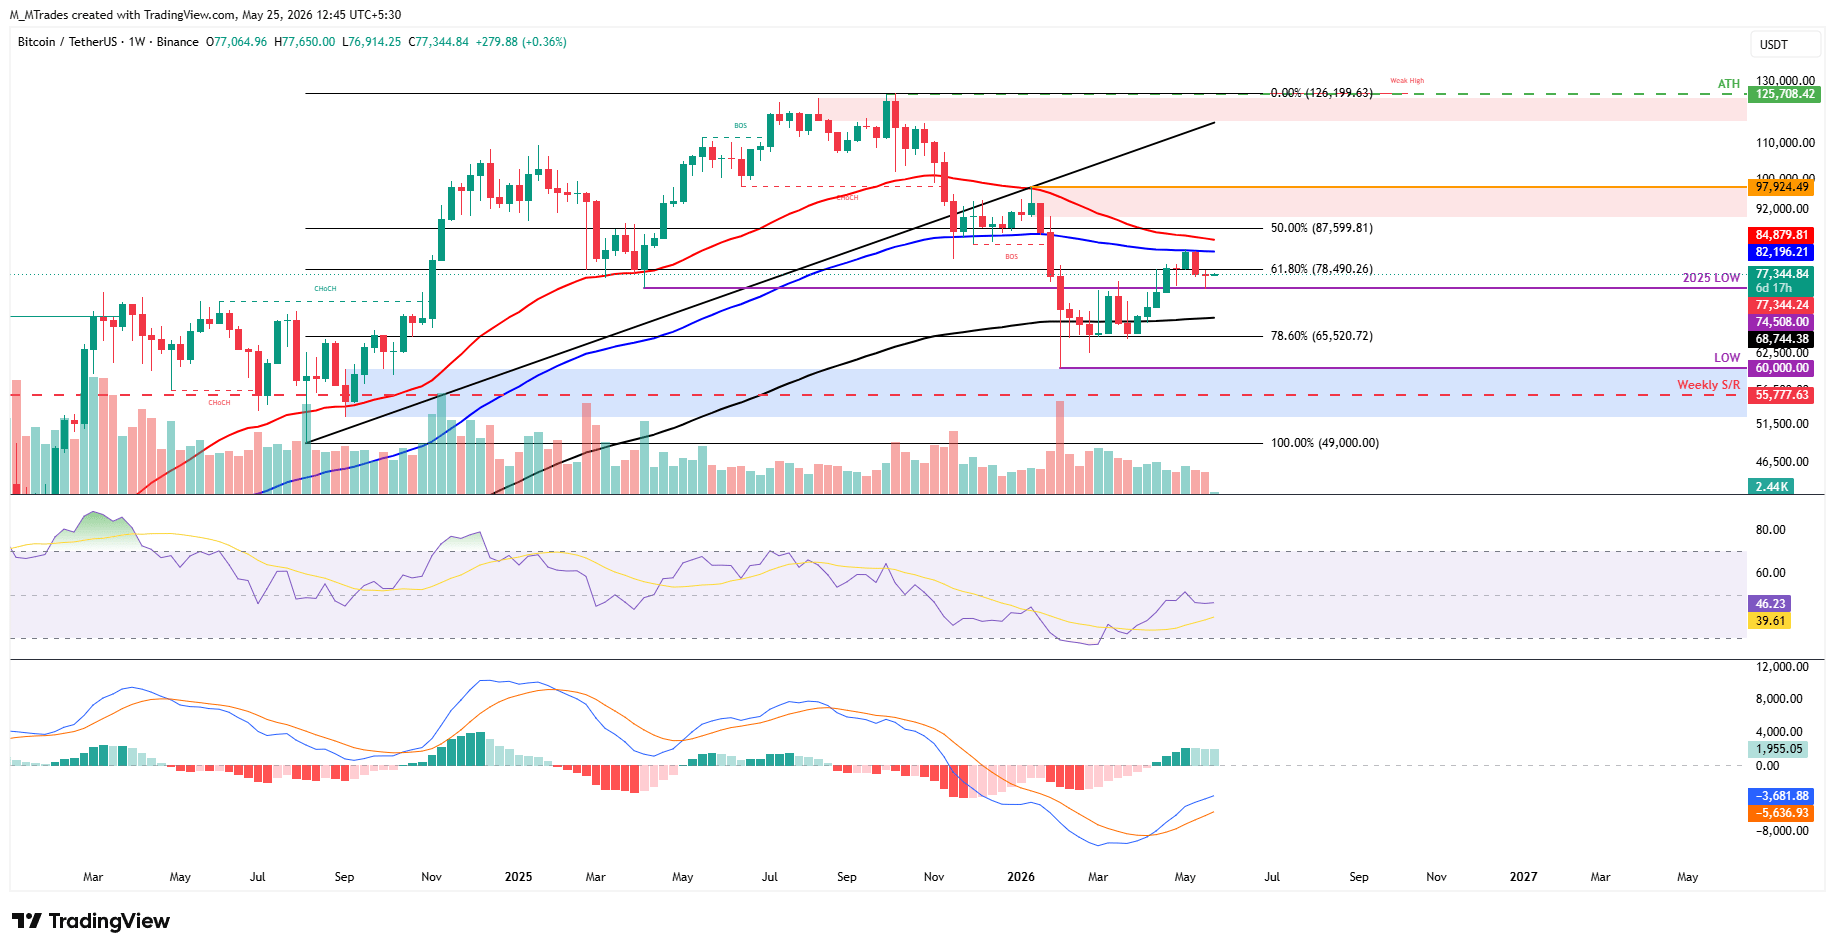
Bitcoin extended its correction last week, retesting its 2025 yearly low at $74,508. However, BTC recovered from this level; the rebound lacked strong follow-through, and the Crypto King closed the week down 0.5%. At the start of this week on Monday, BTC steadied around $77,000.
If BTC continues its correction and closes below the 2025 yearly low at $74,508 on a weekly basis, it could extend the decline toward the 200-week Exponential Moving Average (EMA) at $68,744.
Momentum is mixed, with signs of concern: the Relative Strength Index (RSI) slips below the neutral 50 level, reading 46 on Monday, while the Moving Average Convergence Divergence (MACD) histogram remains firmly positive, suggesting bullish pressure is attempting to reassert itself despite the recent correction.
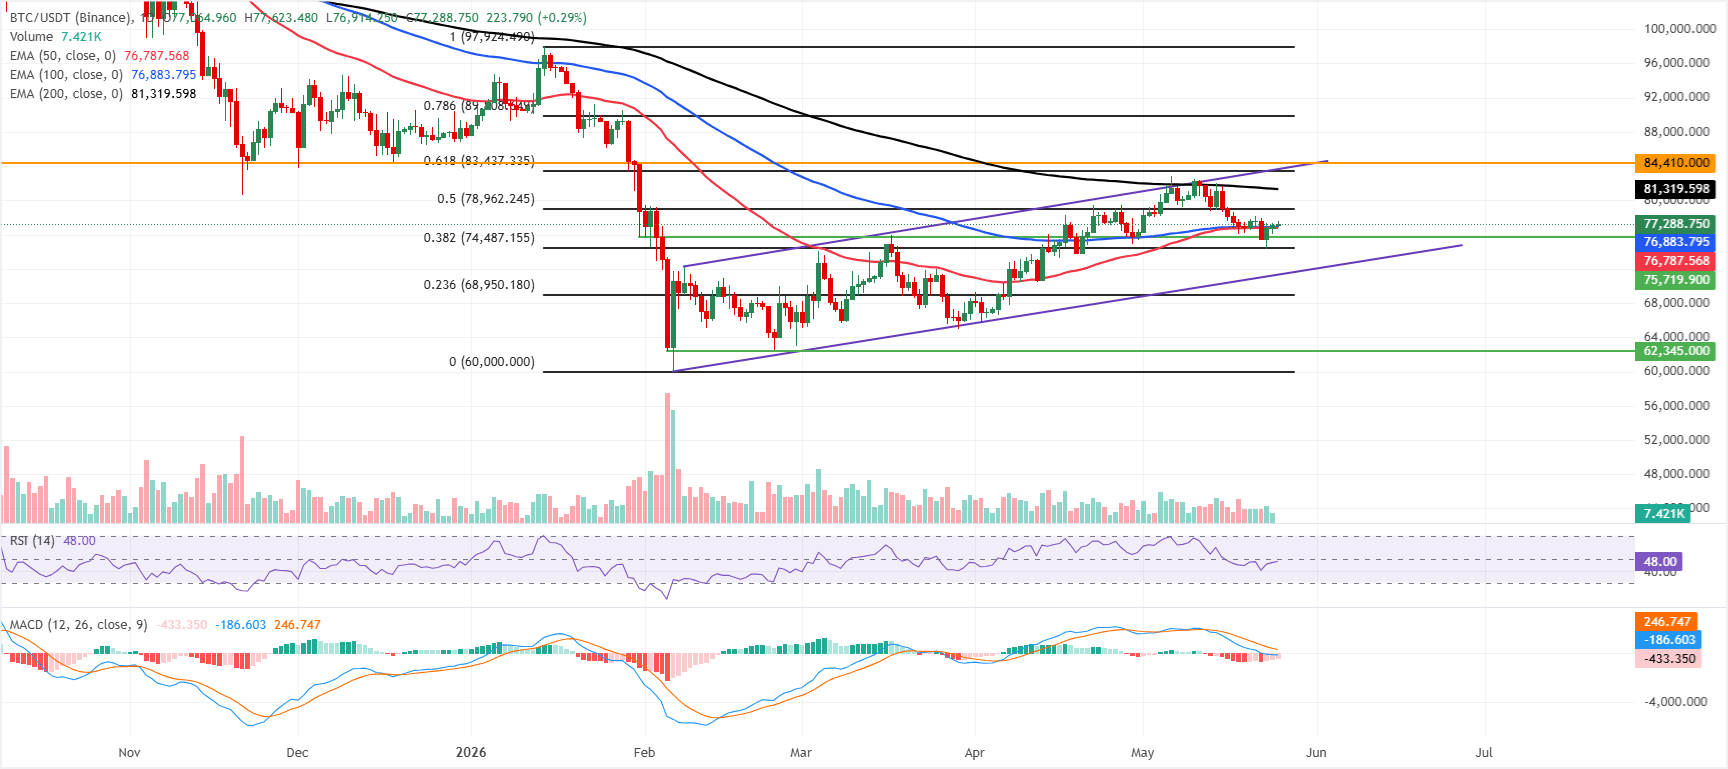
On the daily chart, BTC is holding just above the 50-day and 100-day EMAs, clustered around the mid-$76,000s, which lends nearby support but leaves the broader tone neutral, while the 200-day EMA caps higher near $81,319.
The Crypto King is consolidating after failing to sustain recent highs, with the RSI on the daily chart around 48, pointing to lackluster momentum, and the MACD on the same chart still negative, suggesting rallies may struggle. At the same time, the pair remains lodged between these EMAs and nearby Fibonacci levels.
On the topside, immediate resistance emerges at the 50% retracement (drawn from the January high to the February low) around $78,962, followed by the 200-day EMA near $81,319, with the 61.8% retracement at about $83,437 and the horizontal barrier around $84,410 forming a broader supply band.
On the downside, initial support sits at the 100-day EMA near $76,884, reinforced by the 50-day EMA near $76,788, ahead of the 38.2% Fibonacci level near $74,487; a deeper pullback would expose the former trend-line break area near $71,330 and the 23.6% Fibonacci retracement near $68,950 as the next key demand zones.
(The technical analysis of this story was written with the help of an AI tool.)
Bitcoin, altcoins, stablecoins FAQs
Bitcoin is the largest cryptocurrency by market capitalization, a virtual currency designed to serve as money. This form of payment cannot be controlled by any one person, group, or entity, which eliminates the need for third-party participation during financial transactions.
Altcoins are any cryptocurrency apart from Bitcoin, but some also regard Ethereum as a non-altcoin because it is from these two cryptocurrencies that forking happens. If this is true, then Litecoin is the first altcoin, forked from the Bitcoin protocol and, therefore, an “improved” version of it.
Stablecoins are cryptocurrencies designed to have a stable price, with their value backed by a reserve of the asset it represents. To achieve this, the value of any one stablecoin is pegged to a commodity or financial instrument, such as the US Dollar (USD), with its supply regulated by an algorithm or demand. The main goal of stablecoins is to provide an on/off-ramp for investors willing to trade and invest in cryptocurrencies. Stablecoins also allow investors to store value since cryptocurrencies, in general, are subject to volatility.
Bitcoin dominance is the ratio of Bitcoin's market capitalization to the total market capitalization of all cryptocurrencies combined. It provides a clear picture of Bitcoin’s interest among investors. A high BTC dominance typically happens before and during a bull run, in which investors resort to investing in relatively stable and high market capitalization cryptocurrency like Bitcoin. A drop in BTC dominance usually means that investors are moving their capital and/or profits to altcoins in a quest for higher returns, which usually triggers an explosion of altcoin rallies.














