
Bitcoin Weekly Forecast: After the bloodbath, everyone looks at $60,000
작성자 John Isige
수정됨: 5 Jun 2026


인기 기사

Bitcoin (BTC) hovers above $62,000 at the time of writing on Friday, weighed down by growing risk-off sentiment due to persistent geopolitical tensions in the Middle East and sticky macroeconomic uncertainty.
- Bitcoin consolidates around $62,000 after a flush sell-off from early June highs above $70,000.
- Bitcoin ETF outflows persist, reaching $1.40 billion through Thursday this week amid broadening risk-off sentiment.
- Bitcoin’s technical structure remains with the spot price below major moving averages and the MACD on the cusp of confirming a sell signal.
Bitcoin (BTC) hovers above $62,000 at the time of writing on Friday, weighed down by growing risk-off sentiment due to persistent geopolitical tensions in the Middle East and sticky macroeconomic uncertainty. The institutional sell-off continued to wreak havoc on capital flows, with spot Bitcoin Exchange-Traded Funds (ETFs) recording billions in outflows. Furthermore, a weakening derivatives market and supply headwinds continue to cap Bitcoin’s recovery potential.
Institutional and retail sell-off persists
Institutional appetite continues to take a back seat this week, with SoSoValue weekly data showing that spot Bitcoin ETFs recorded outflows of $1.40 billion through Thursday.
Unless we see a substantial reversal in ETF flows on Friday, Bitcoin is poised to record its fourth straight week of over $1 billion in outflows, a clear indication of fading institutional appetite that could put further downside pressure on price.
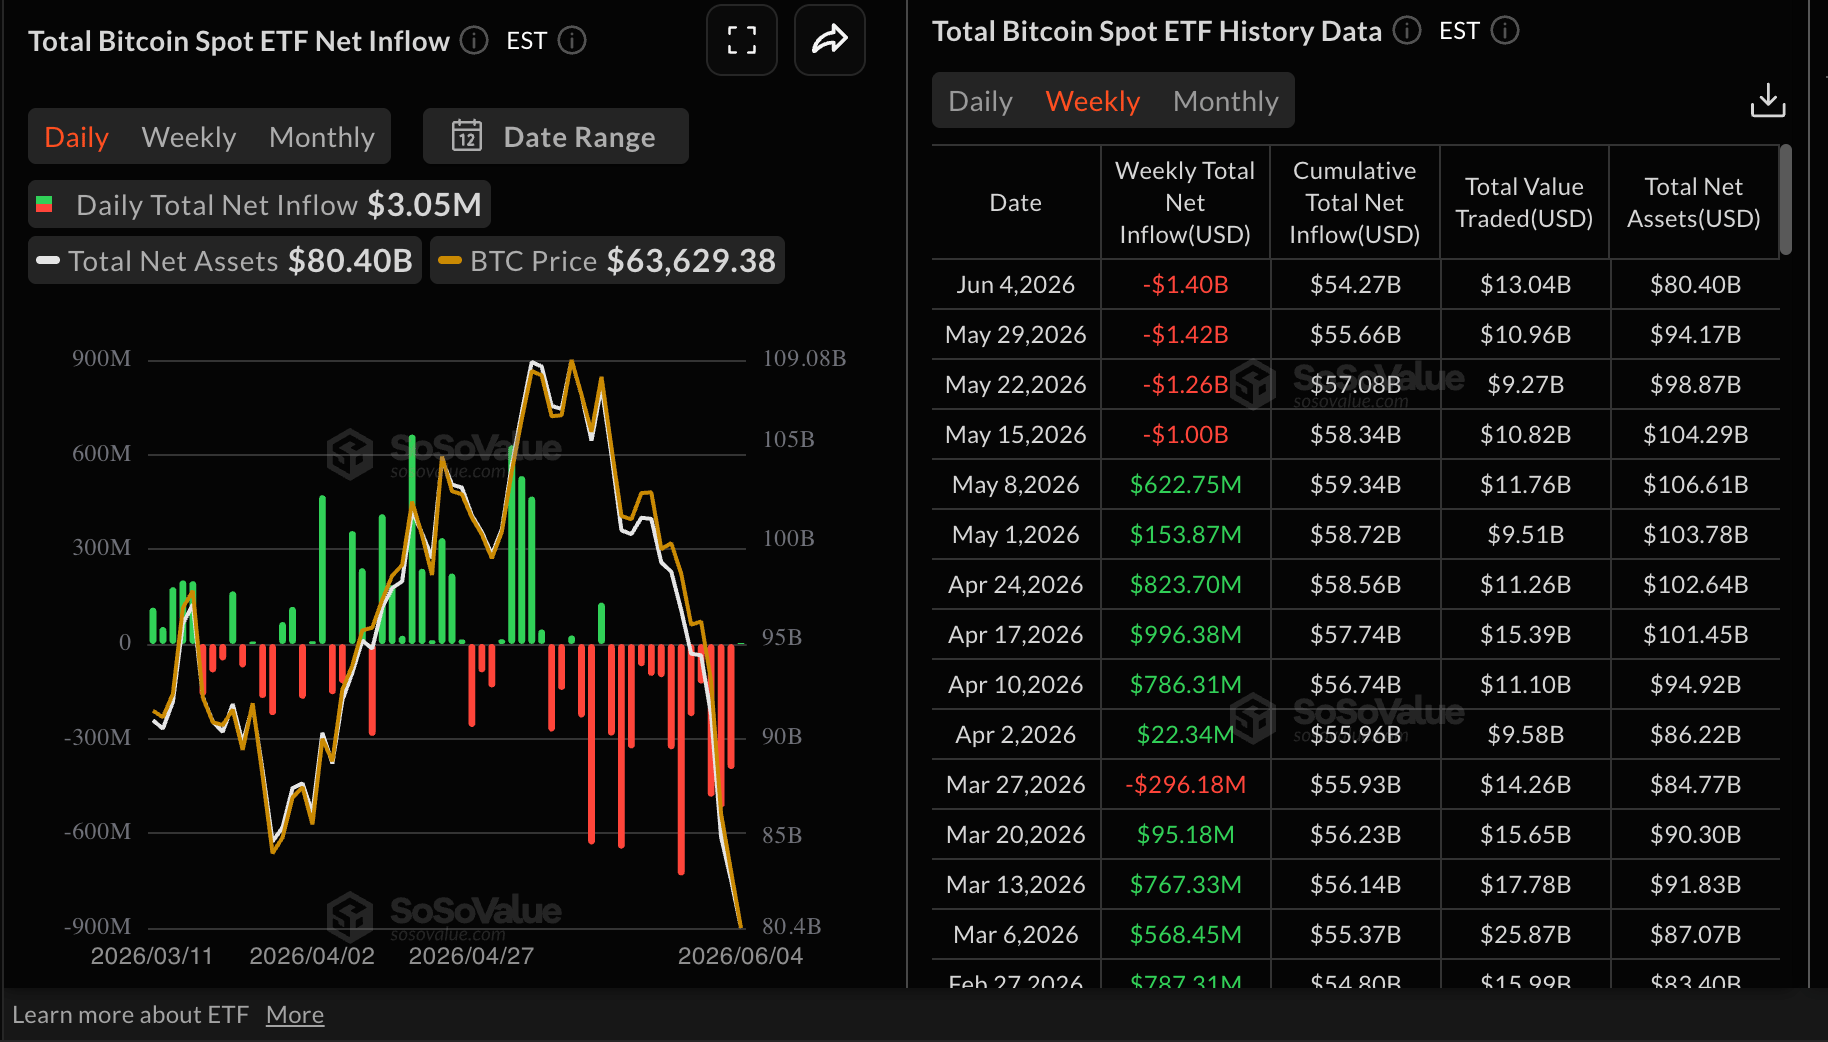
Despite persistent outflows, cumulative inflows total $54.27 billion, while net assets under management average $80.40 billion. To sustain a rebound, inflows into spot ETFs should remain steady, absorbing the supply headwinds that continue to dominate the crypto market.
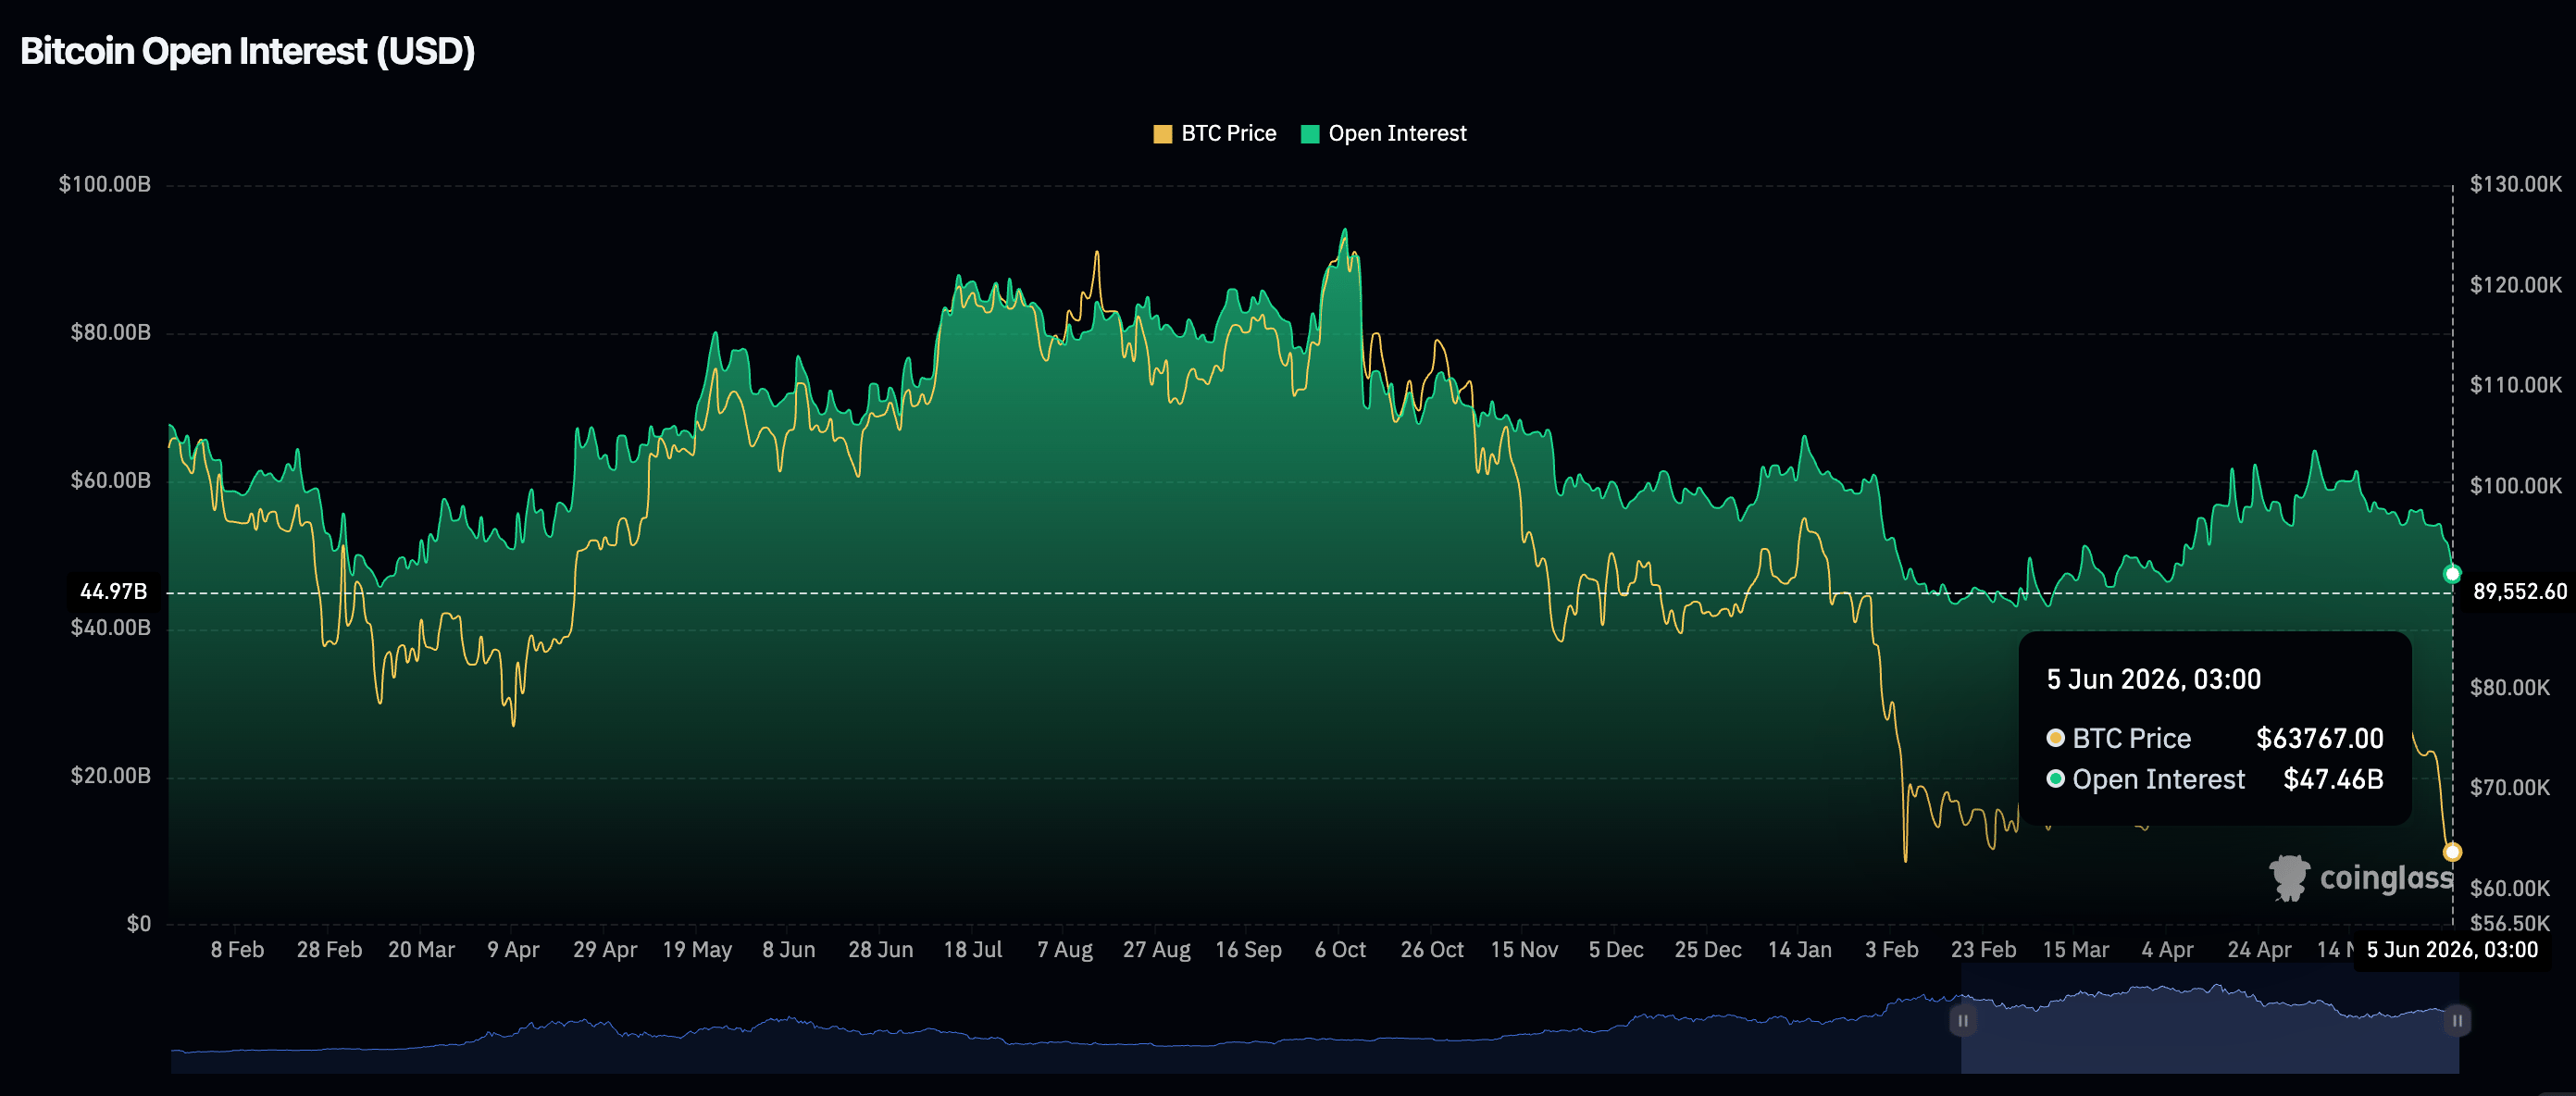
Retail interest in Bitcoin derivatives remains weak, as evidenced by the perpetual futures Open Interest (OI), which narrowed to $47.46 billion on Friday, down from $51.37 billion the day before and $53.98 billion on Monday. A sustained decline in the OI suggests that traders generally lack confidence in BTC’s ability to sustain an uptrend and thus refrain from opening new positions.
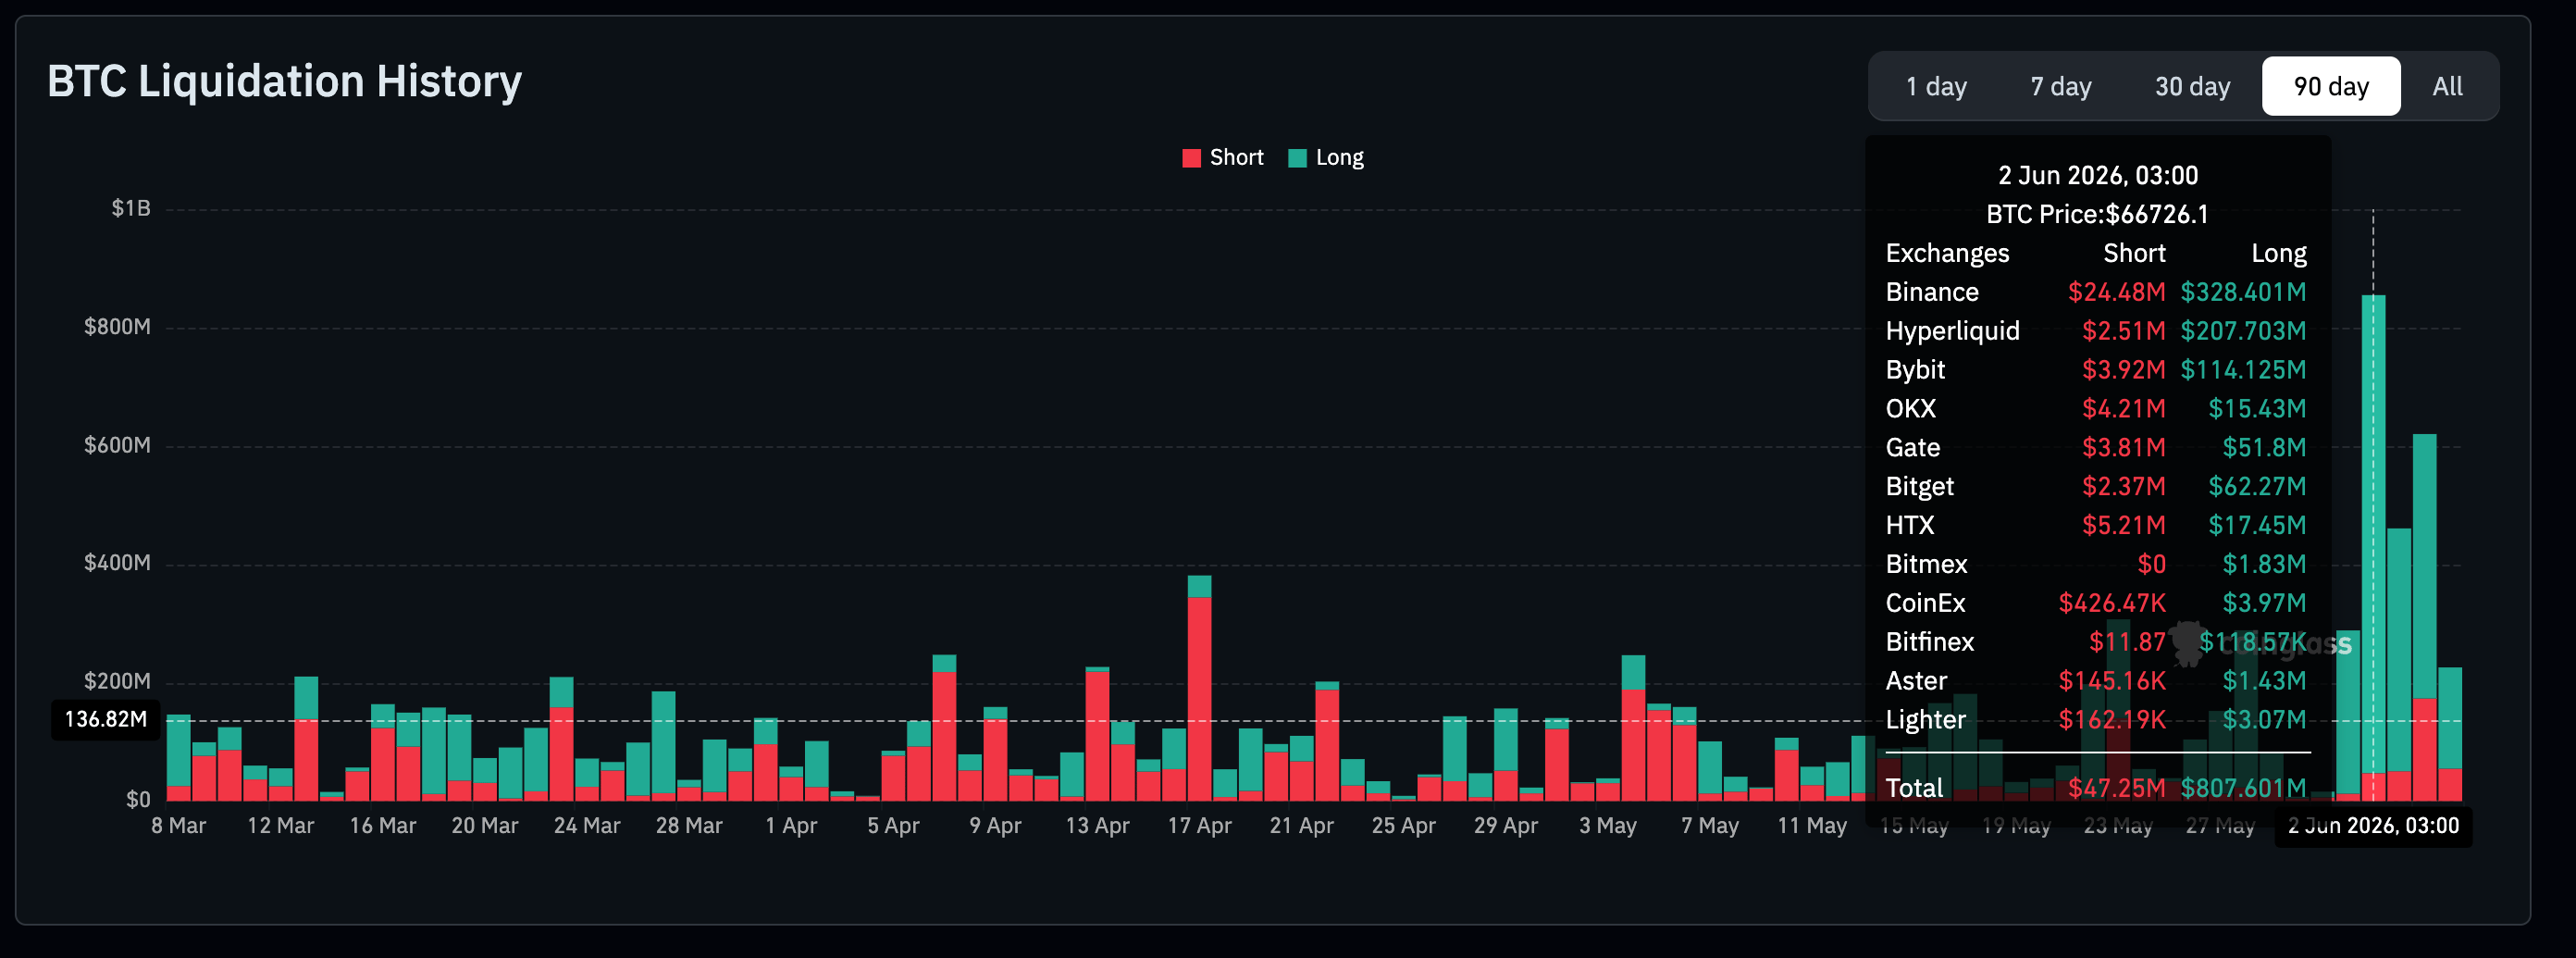
Liquidations also spiked this week, nearing $2.45 billion as of Friday. On Tuesday alone, over $807 million in long positions was wiped out in addition to roughly $47 million in short positions. Liquidations on Friday amount to $171 million in longs and nearly $55 million in shorts so far. A deeper correction below the pivotal $60,000 level would leave more leveraged traders counting losses as headwinds weigh on the price.
Bitcoin struggles to sustain recovery
Bitcoin remains vulnerable, consolidating around $62,000 while $60,000 support holds. Attempts for knee-jerk reversals appear subdued, possibly due to a surge in spot selling on exchanges.
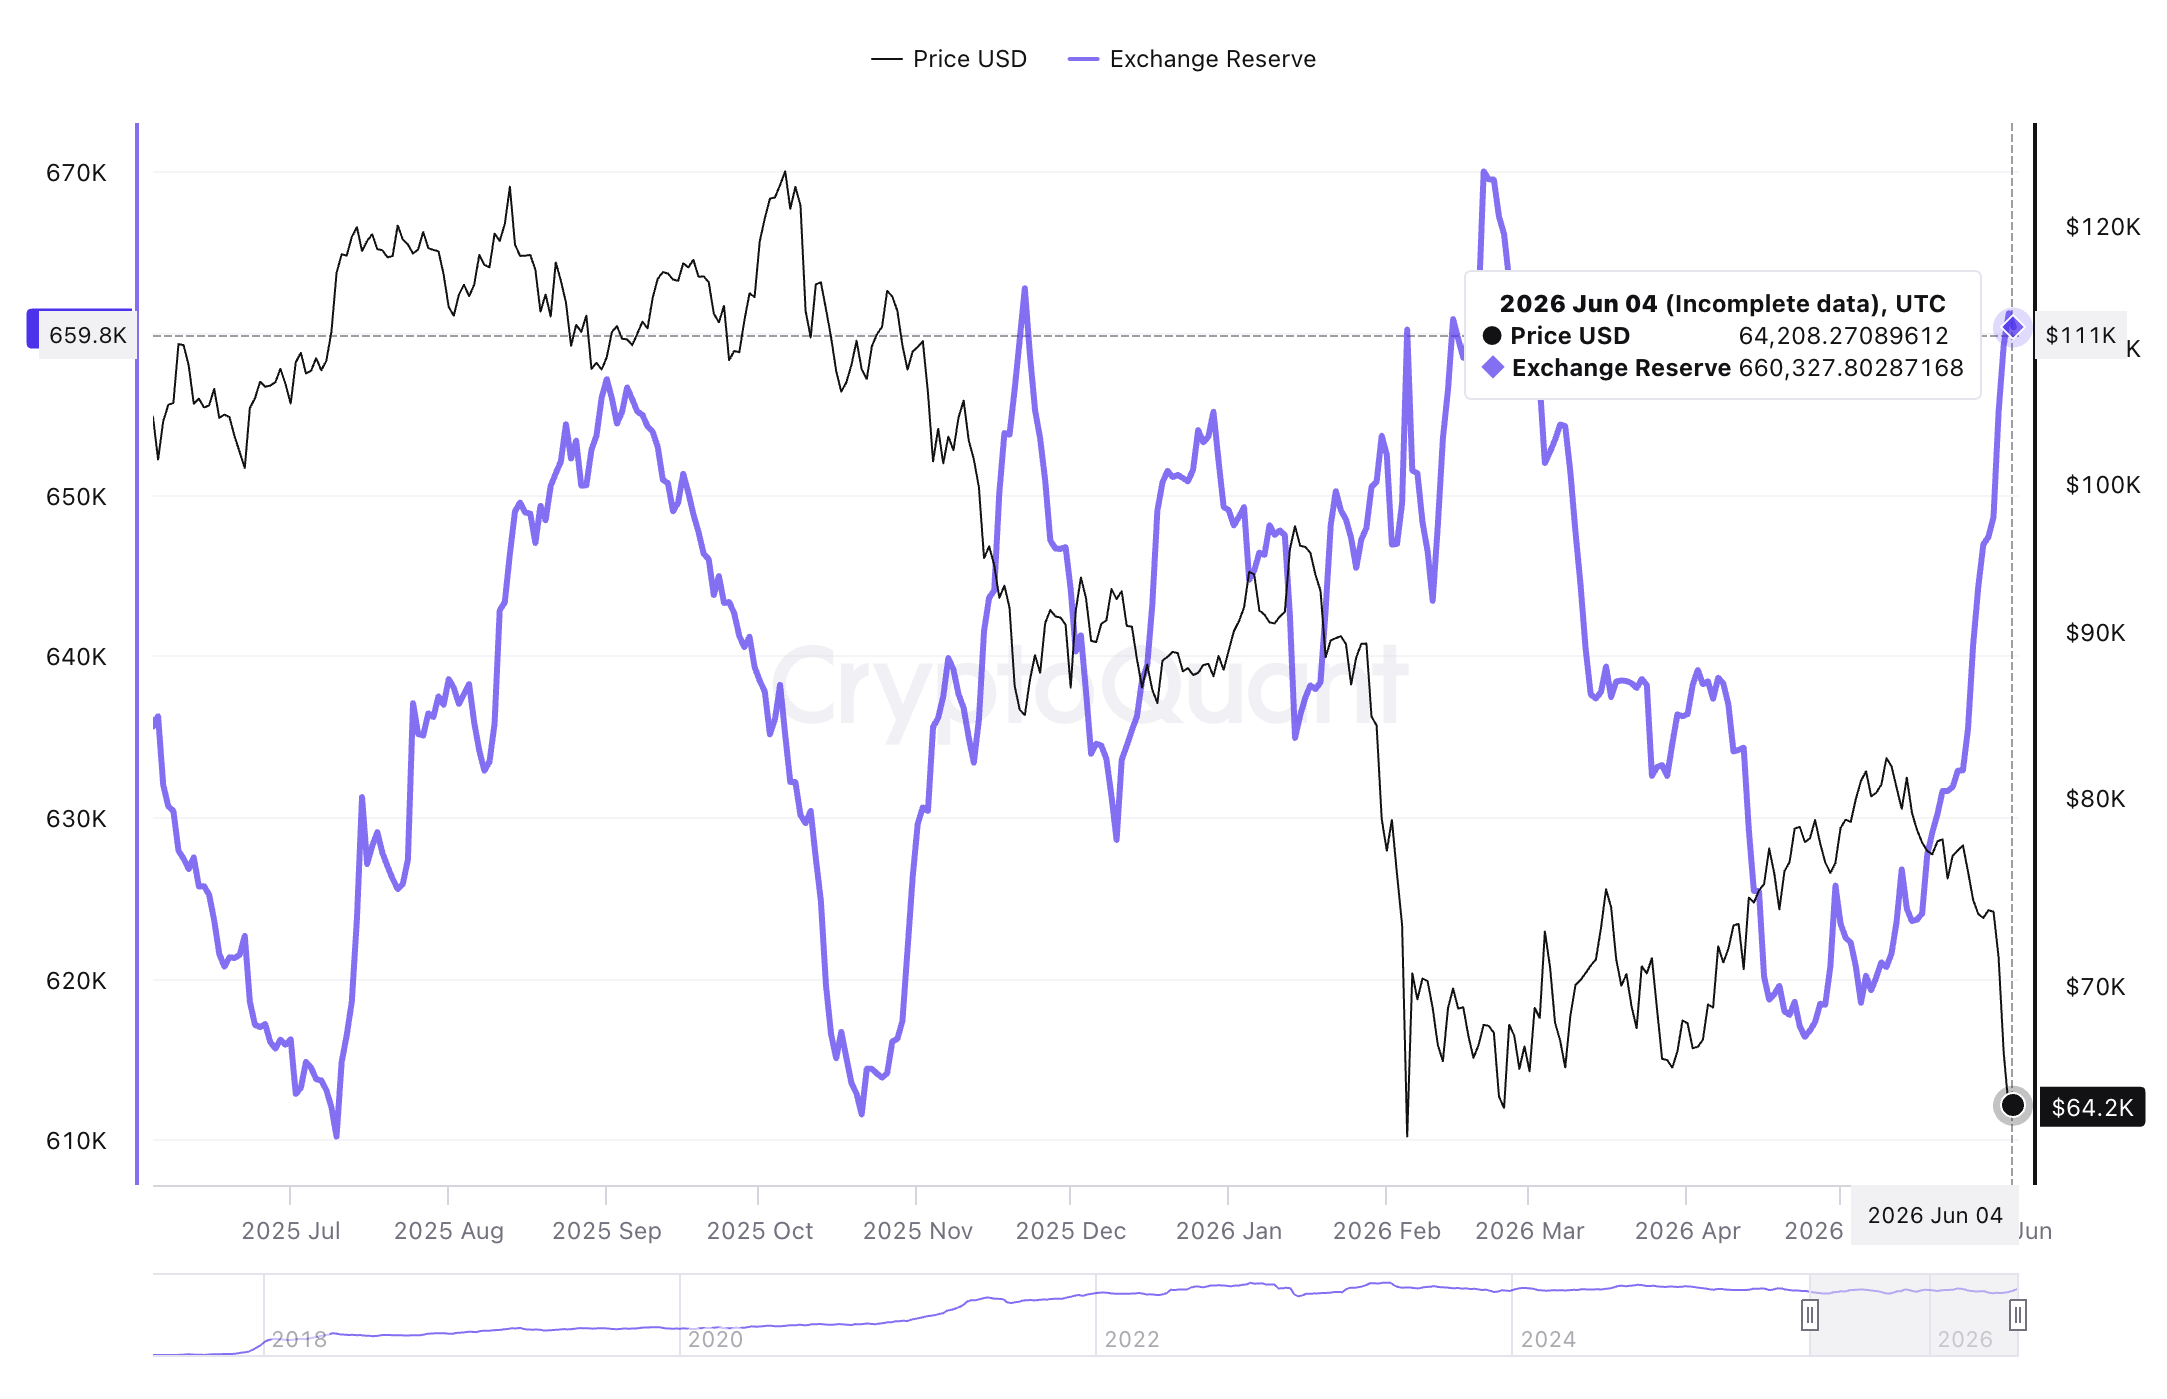
According to CryptoQuant data, Bitcoin Exchange Reserves on Binance hold slightly above 660,000 BTC, up from roughly 616,000 BTC. This increase shows that investors are transferring assets to exchange platforms, ready to sell as confidence in Bitcoin’s ability to sustain recovery falters.
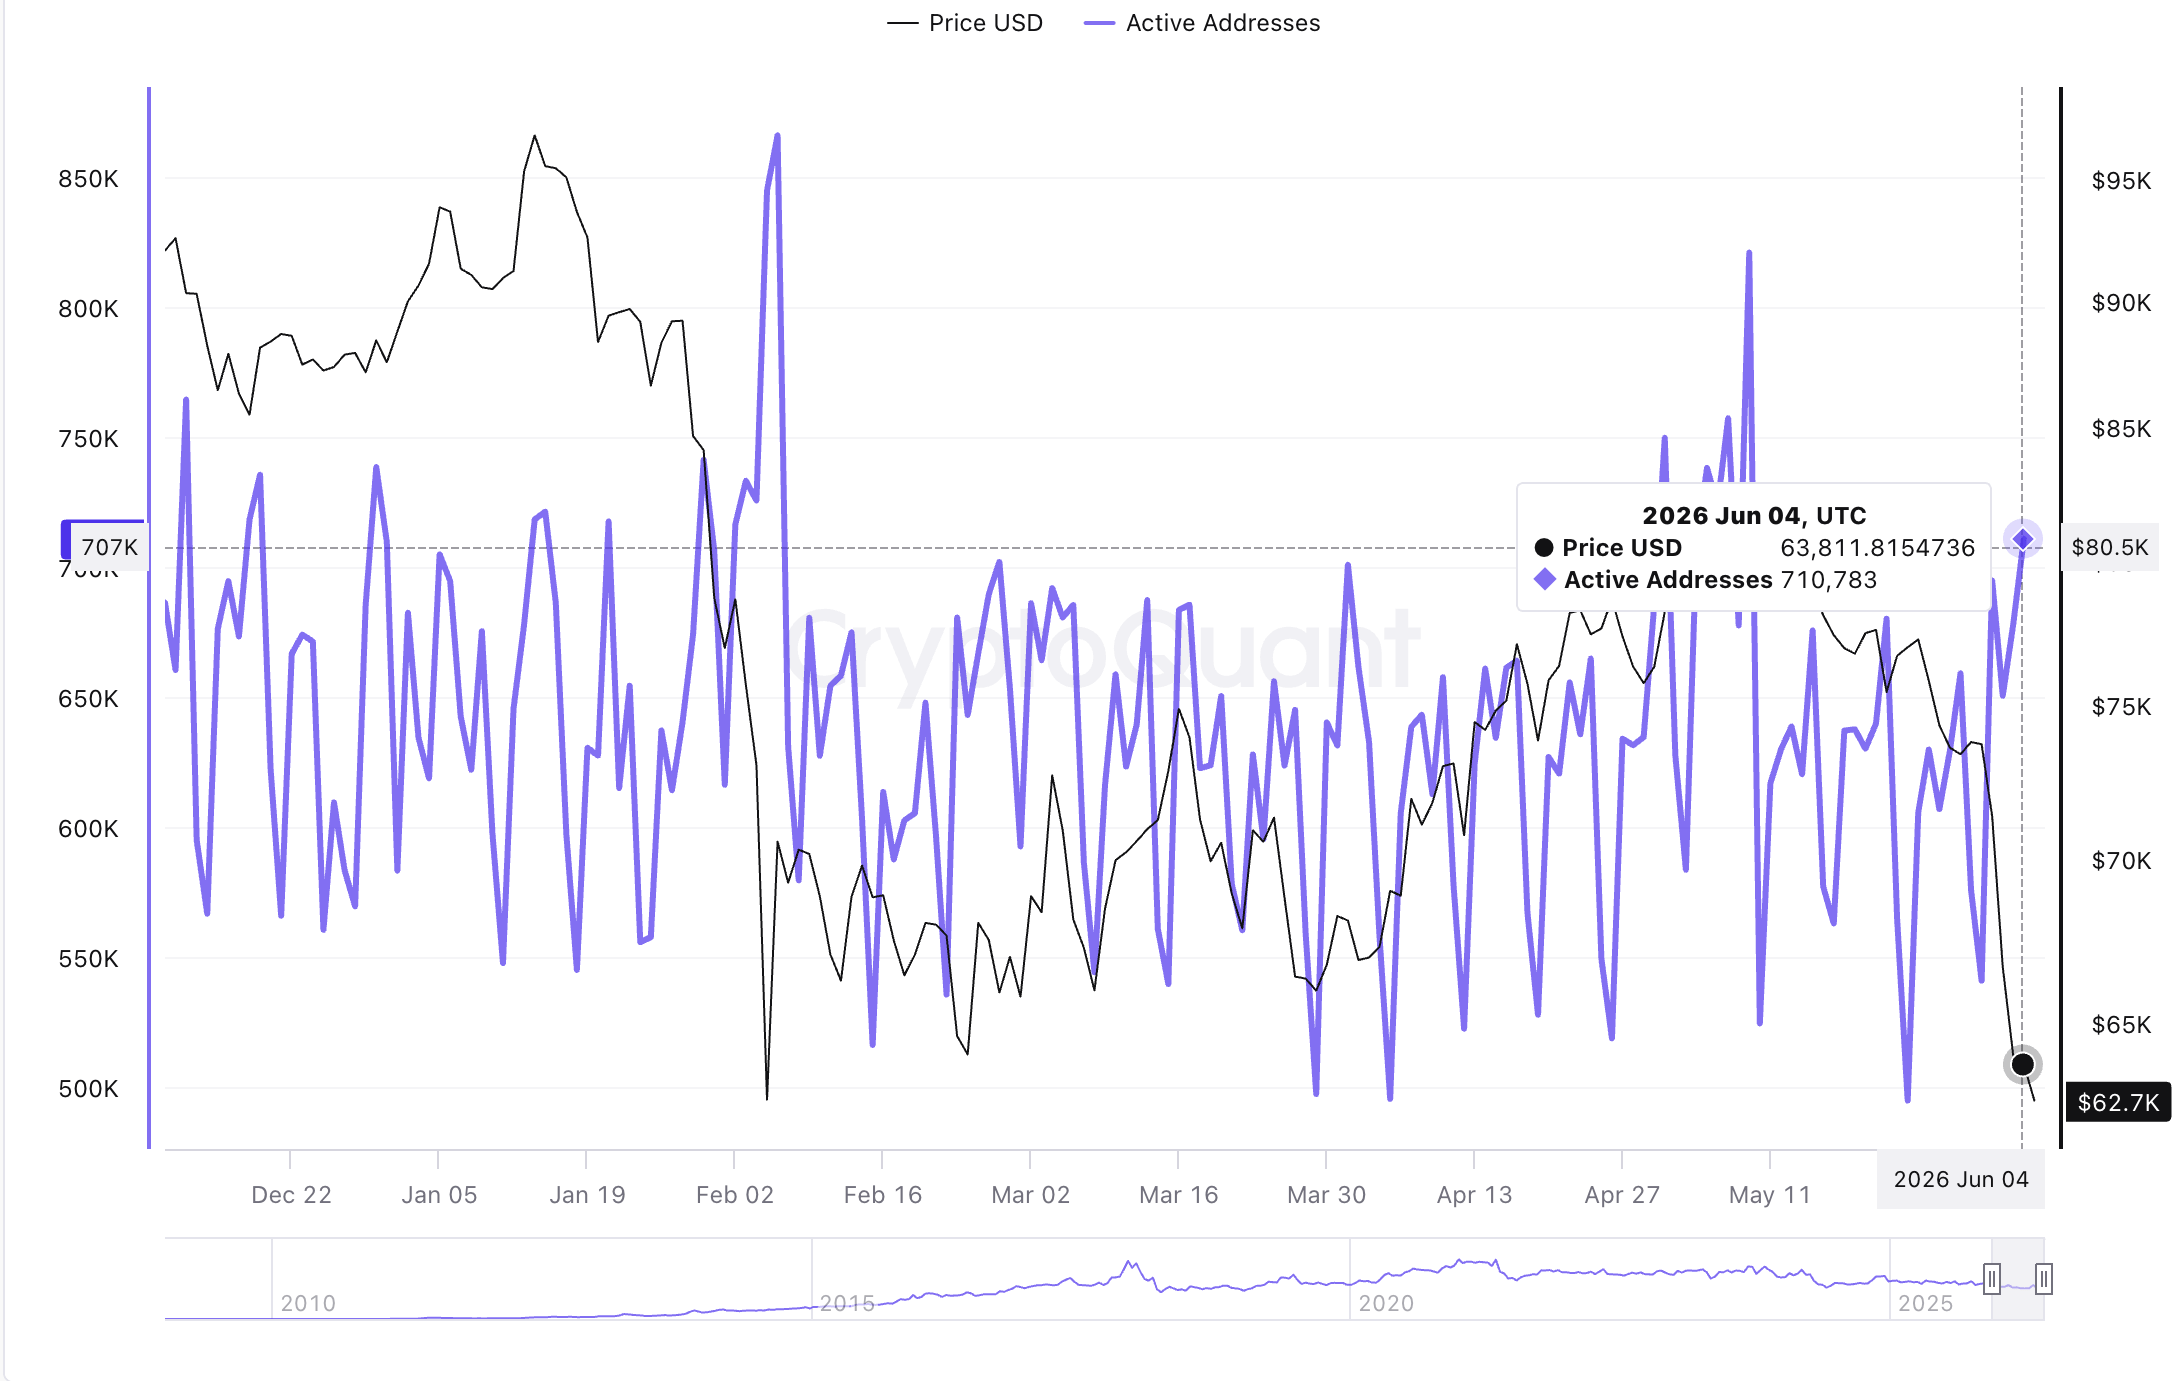
On-chain activity remains elevated, possibly due to portfolio adjustments among investors. The Active Addresses metric shows that roughly 711,000 addresses interacted with the network by sending or receiving assets on Thursday, highlighting a notable increase from 650,000 on Tuesday and 541,000 on Sunday.
Middle East tensions weigh on sentiment
Optimism for an imminent peace agreement between the United States (US) and Iran has cooled further, despite assurances from US President Donald Trump that talks were ongoing and that a deal was nigh. Earlier this week, the US military launched strikes on Iran near the Strait of Hormuz in “self-defense” while Iranian forces attacked Kuwait and Bahrain in retaliation, threatening the fragile ceasefire.
Continued tensions between the two countries could suppress Bitcoin’s recovery further and threaten the $60,000 level, as geopolitical tensions rarely favor risk assets.
“The $60,000 level still matters because the market has already seen buyers step in there before. In the current environment, however, calling it a definitive floor would be premature,” Shawn Young, Chief Analyst, MEXC Research, said in a written statement. “For that level to hold, buyers need to defend it over several sessions while ETF flows stabilize. Otherwise, a break below $60,000 would put $58,000 and the mid-$50,000s back on the table,” he added.
Price analysis: Bitcoin bulls bank on $60,000 holding
Bitcoin trades above $62,000, extending a broader corrective phase below all key Exponential Moving Averages (EMAs). The 50-week, 100-week and 200-week EMAs, clustered between roughly $68,600 and $83,900, now sit overhead as a layered resistance band, reinforcing a bearish near-term bias despite a marginally positive Moving Average Convergence Divergence (MACD) histogram on the weekly chart.
The Relative Strength Index (RSI) hovers around 34 on the same chart, indicating persistent downside pressure but not yet extreme oversold conditions.
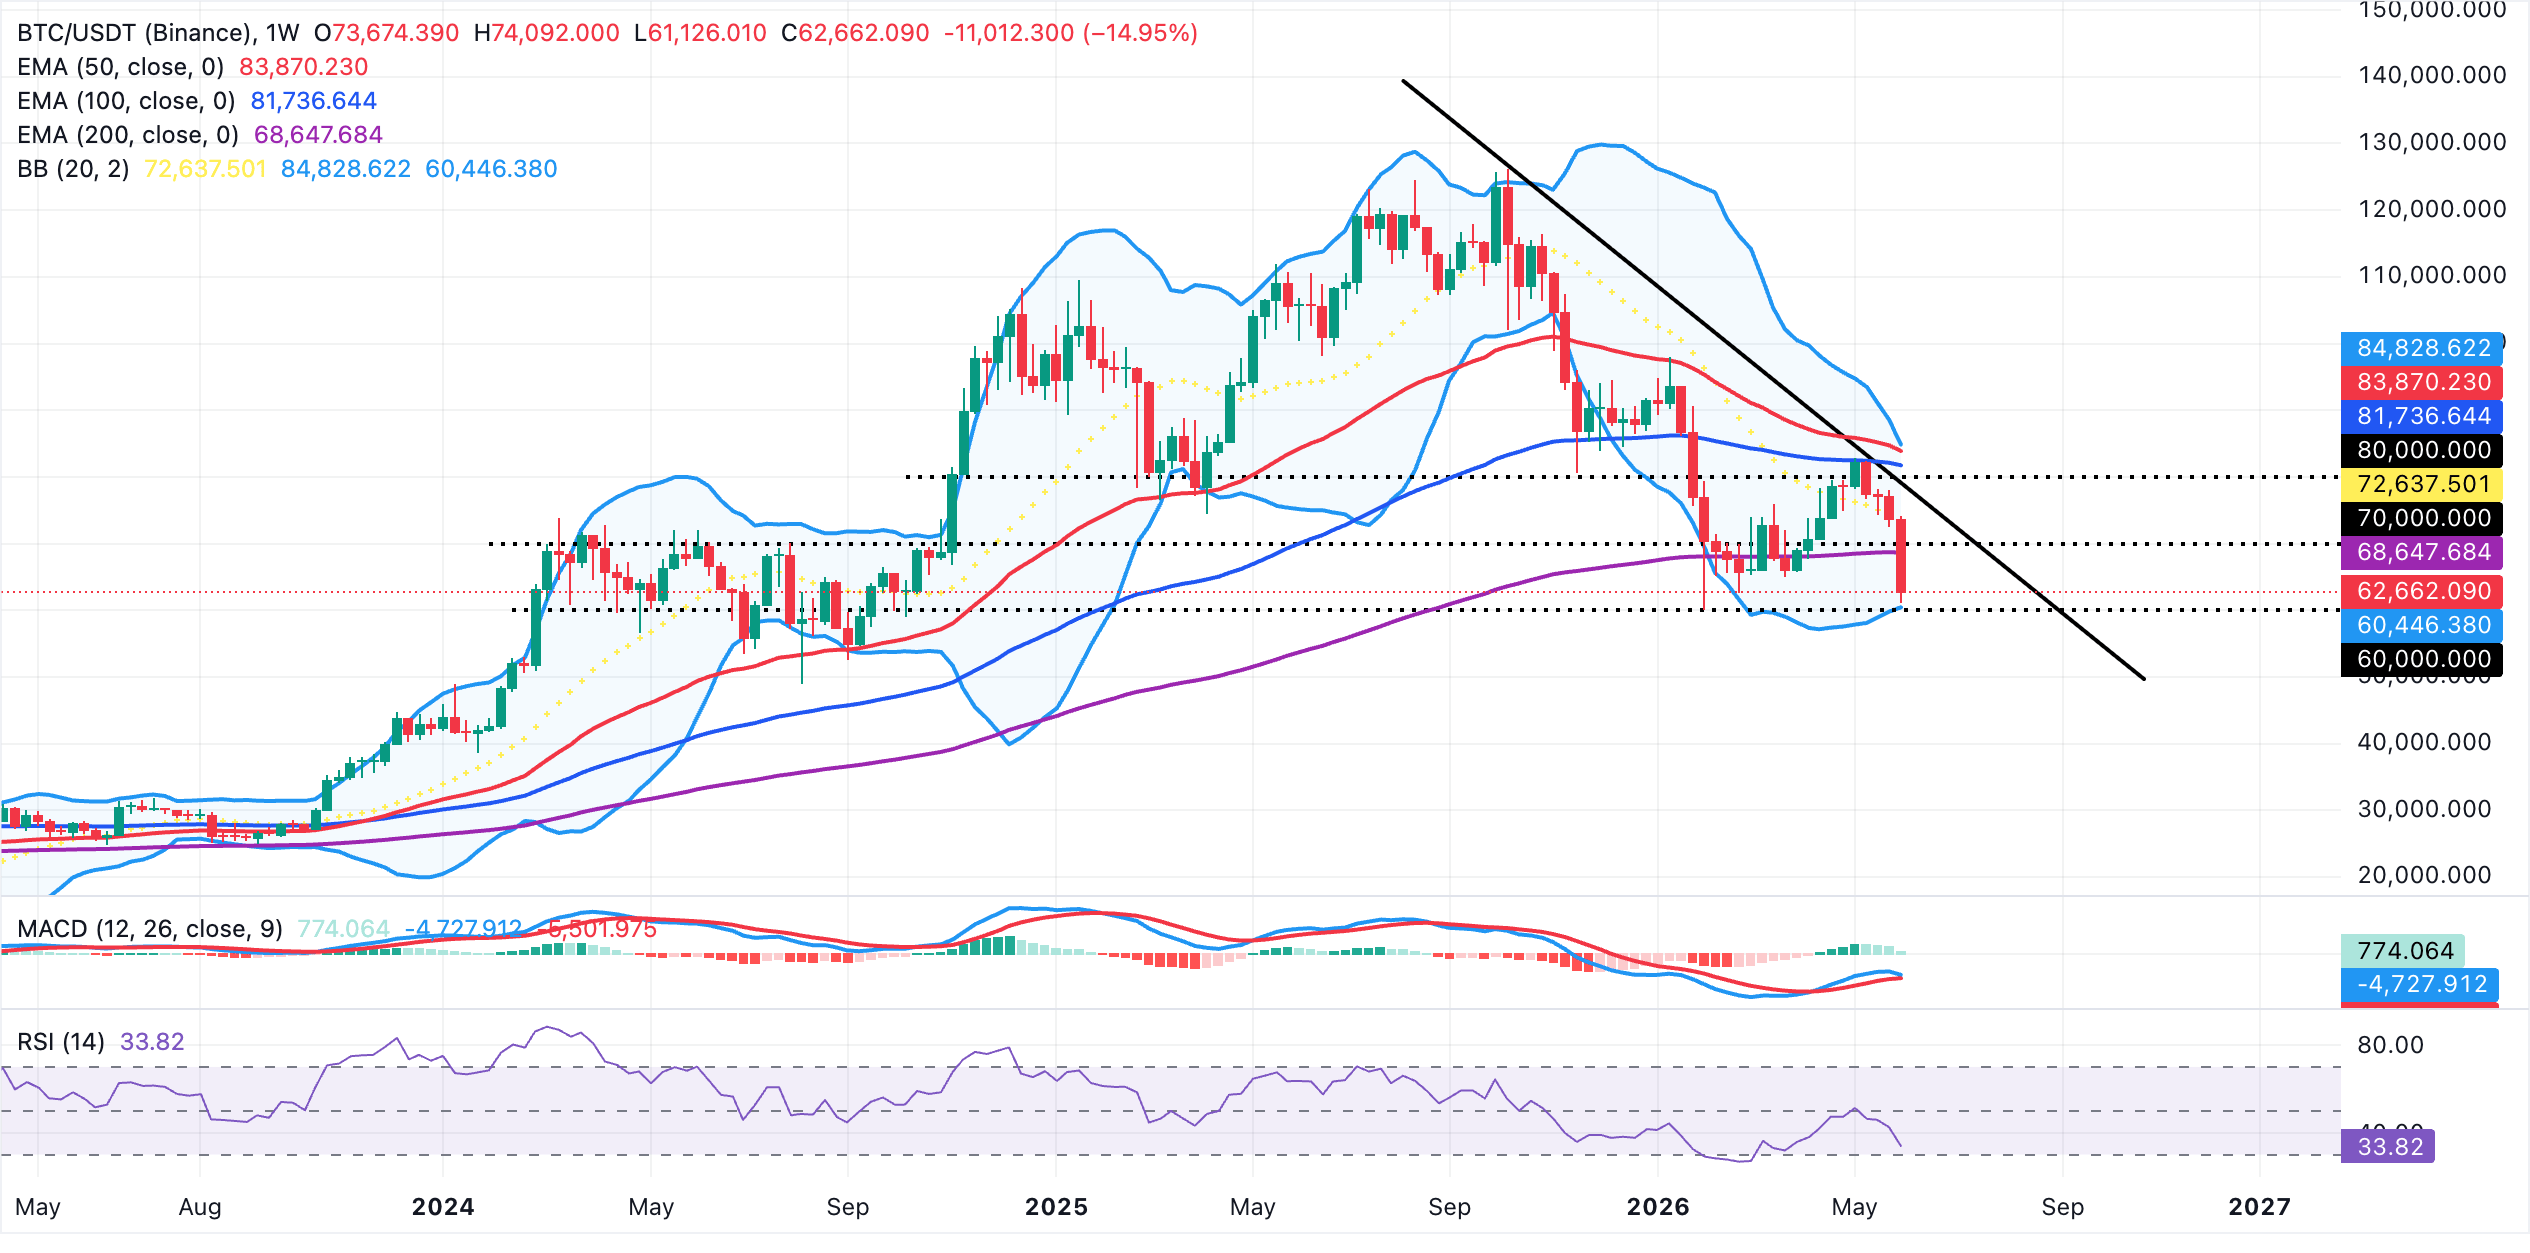
On the topside, initial resistance is aligned with the 200-week EMA near $68,647, followed by the Bollinger Bands’ middle line around $72,637. Further up, the 100-week and 50-week EMAs at approximately $81,737 and $83,870, together with the upper Bollinger Band near $84,829, define a dense supply zone that would need to be cleared to ease the broader bearish tone.
On the downside, immediate support is offered by the lower Bollinger Band at about $60,446, followed by $60,000, a demand area tested in early February. A sustained break beneath this floor would expose deeper losses and signal an acceleration of the prevailing downtrend into the $50,000's.
(The technical analysis of this story was written with the help of an AI tool.)
Bitcoin, altcoins, stablecoins FAQs
Bitcoin is the largest cryptocurrency by market capitalization, a virtual currency designed to serve as money. This form of payment cannot be controlled by any one person, group, or entity, which eliminates the need for third-party participation during financial transactions.
Altcoins are any cryptocurrency apart from Bitcoin, but some also regard Ethereum as a non-altcoin because it is from these two cryptocurrencies that forking happens. If this is true, then Litecoin is the first altcoin, forked from the Bitcoin protocol and, therefore, an “improved” version of it.
Stablecoins are cryptocurrencies designed to have a stable price, with their value backed by a reserve of the asset it represents. To achieve this, the value of any one stablecoin is pegged to a commodity or financial instrument, such as the US Dollar (USD), with its supply regulated by an algorithm or demand. The main goal of stablecoins is to provide an on/off-ramp for investors willing to trade and invest in cryptocurrencies. Stablecoins also allow investors to store value since cryptocurrencies, in general, are subject to volatility.
Bitcoin dominance is the ratio of Bitcoin's market capitalization to the total market capitalization of all cryptocurrencies combined. It provides a clear picture of Bitcoin’s interest among investors. A high BTC dominance typically happens before and during a bull run, in which investors resort to investing in relatively stable and high market capitalization cryptocurrency like Bitcoin. A drop in BTC dominance usually means that investors are moving their capital and/or profits to altcoins in a quest for higher returns, which usually triggers an explosion of altcoin rallies.

100만 명이 넘는 사용자가 FXStreet를 통해 실시간 시장 데이터, 차트 도구, 전문가 인사이트, 포렉스 뉴스를 이용합니다. 포괄적인 경제 캘린더와 교육 웨비나는 트레이더가 정보를 유지하고 신중한 결정을 내리도록 돕습니다. FXStreet는 바르셀로나 본사와 전 세계 지역에 걸쳐 약 60명의 팀으로 구성되어 있습니다.
더 읽기


