
Bittensor and Grass rally as AI crypto tokens broadly recover
작성자 John Isige
수정됨: 9 Mar 2026


인기 기사

The cryptocurrency market is regaining momentum amid the war in the Middle East, with Bittensor (TAO) and Grass (GRASS) posting notable gains at the time of writing on Monday, driven by rising investor interest and improving technical indicators.
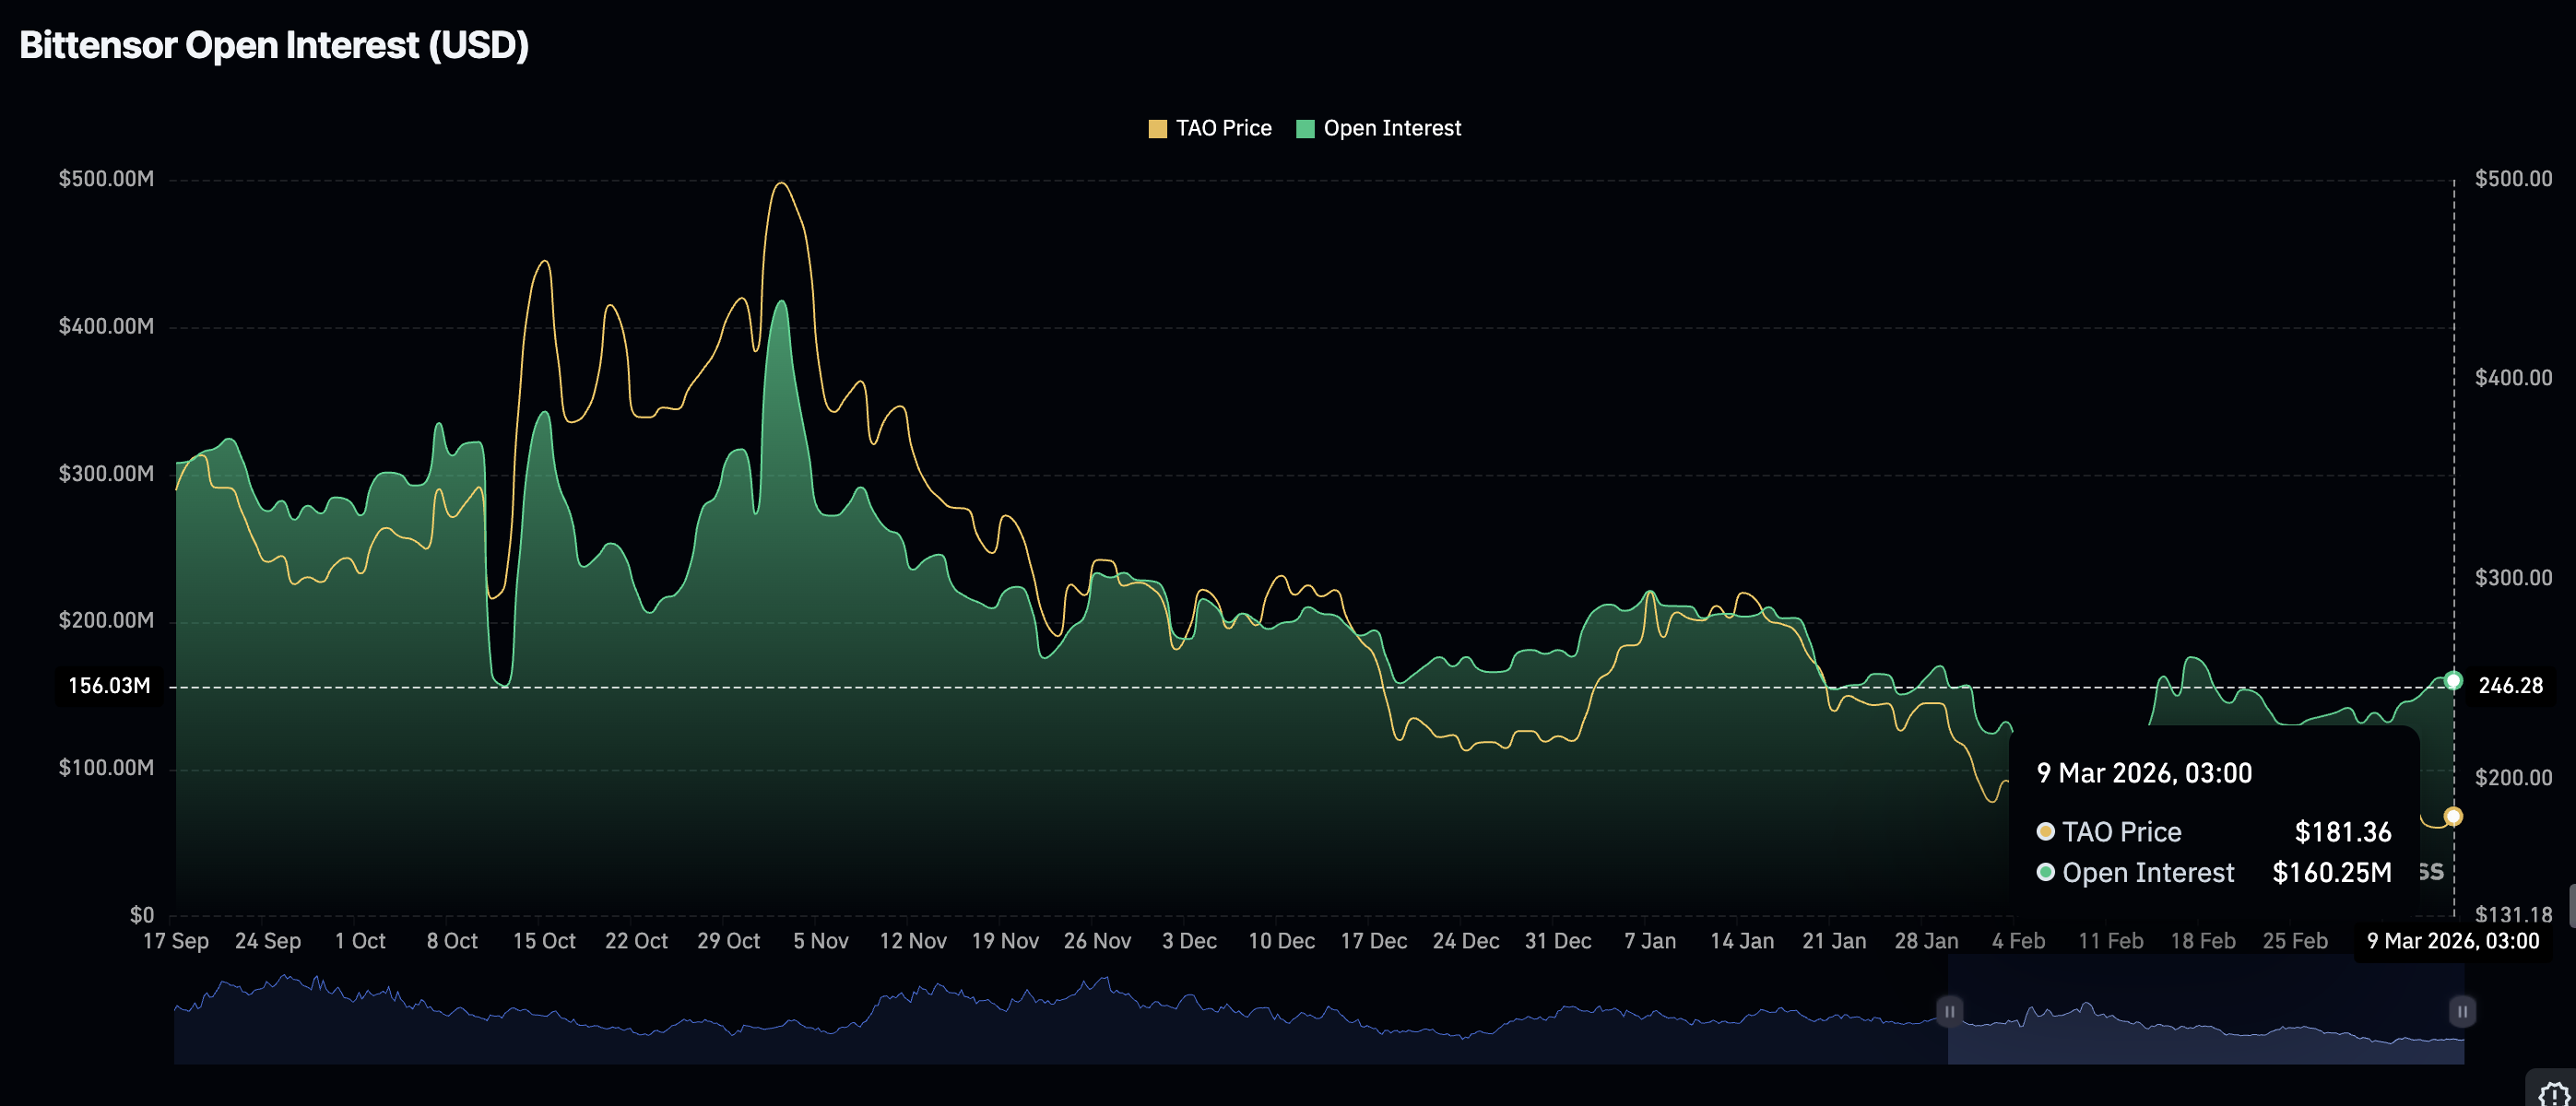
- Bittensor ticks up by over 8% as retail interest expands, with futures Open Interest averaging $160 million.
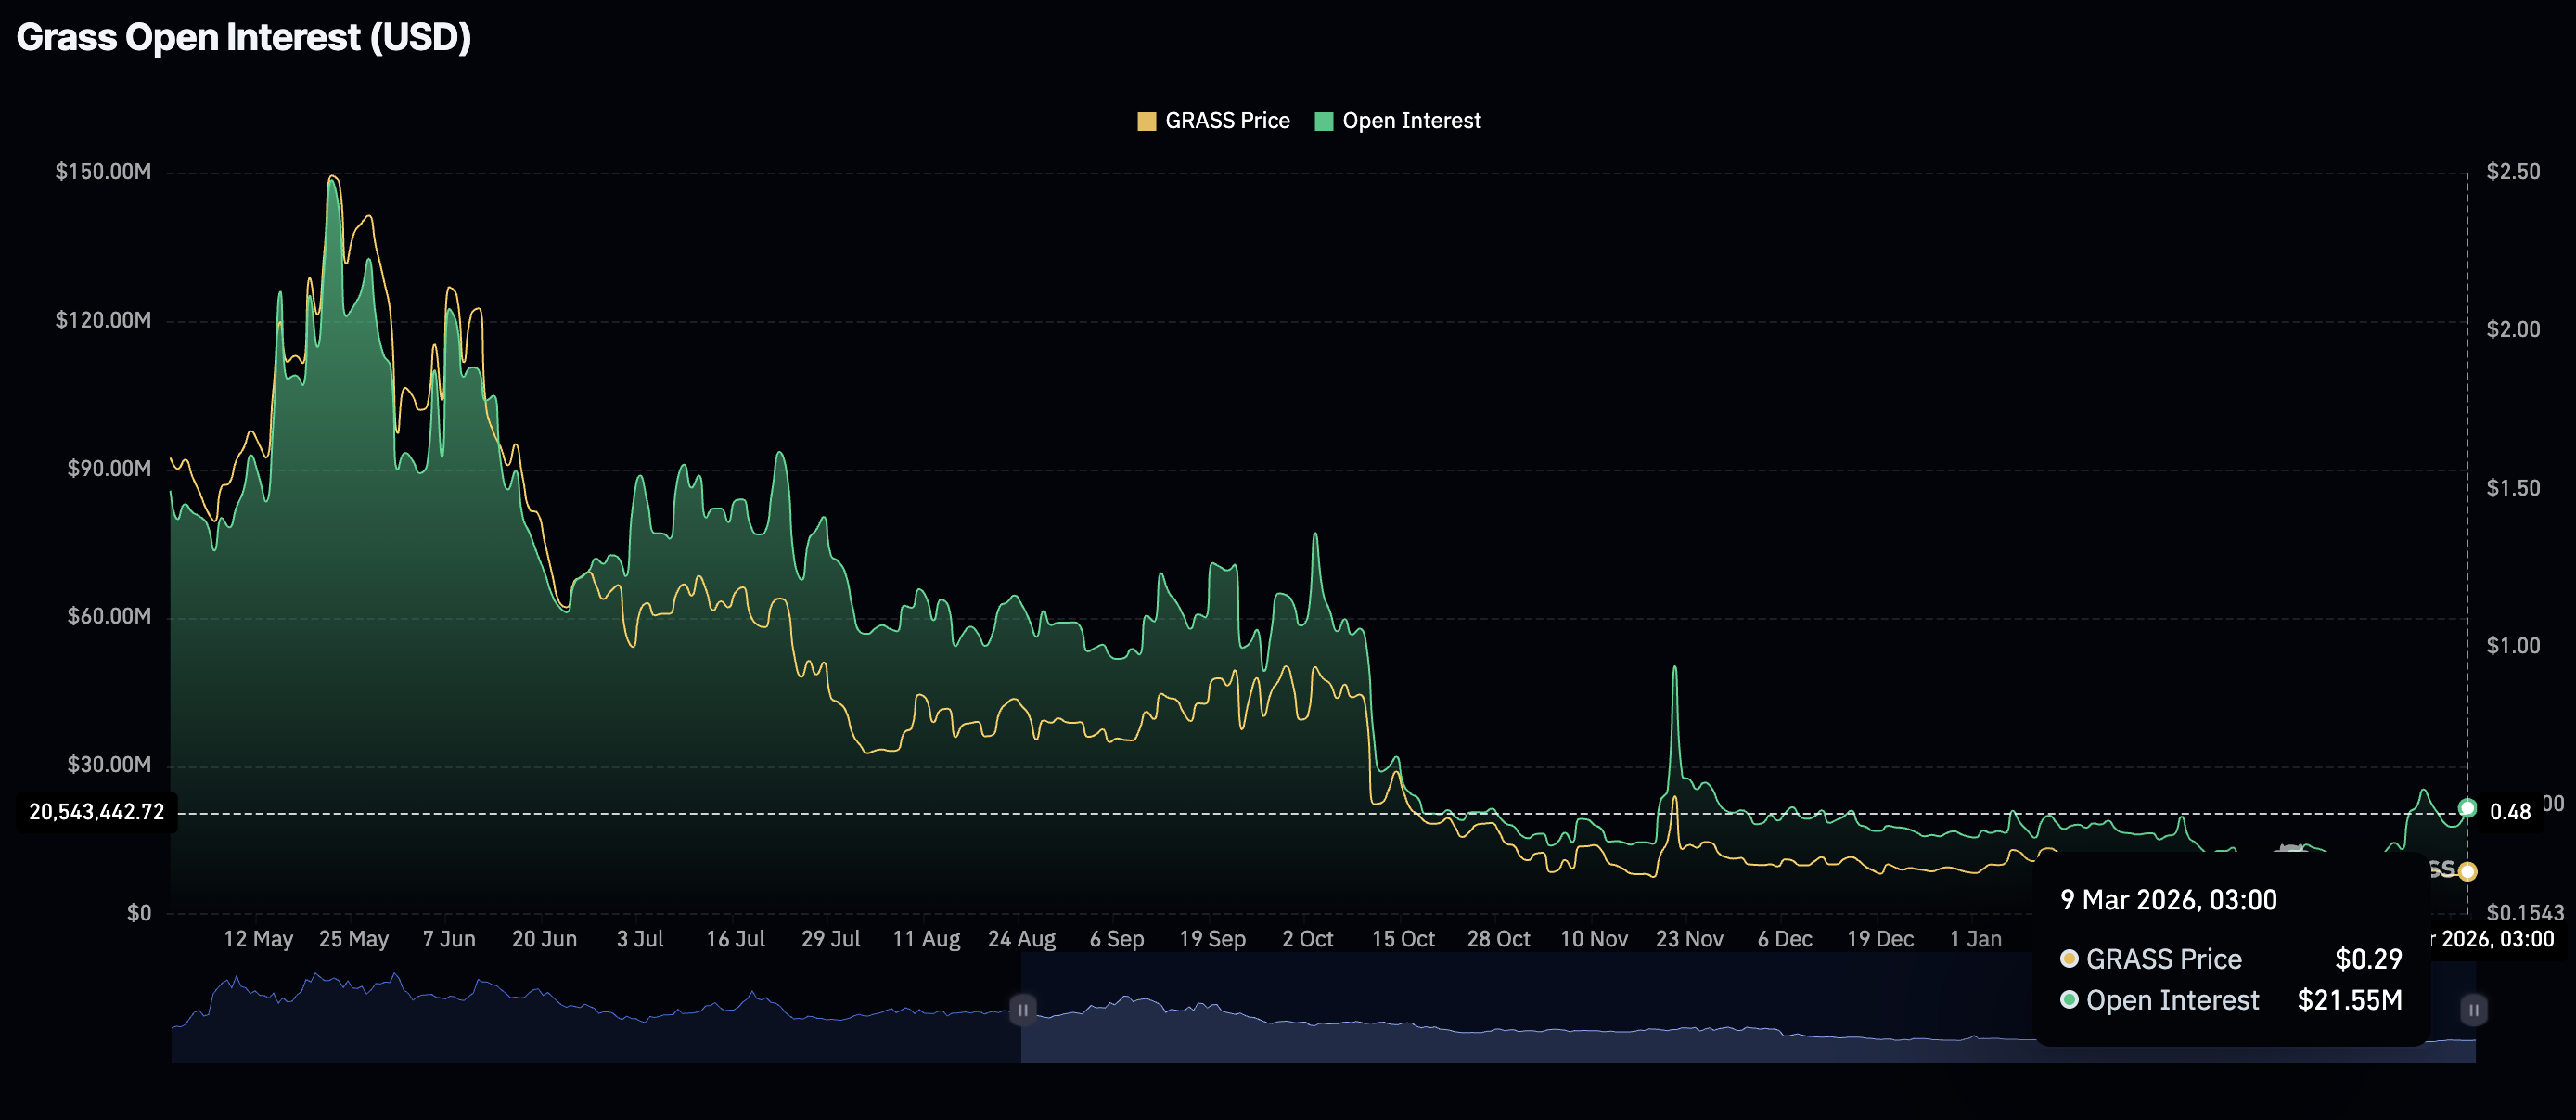
- Grass surges in double digits, supported by momentum indicators.
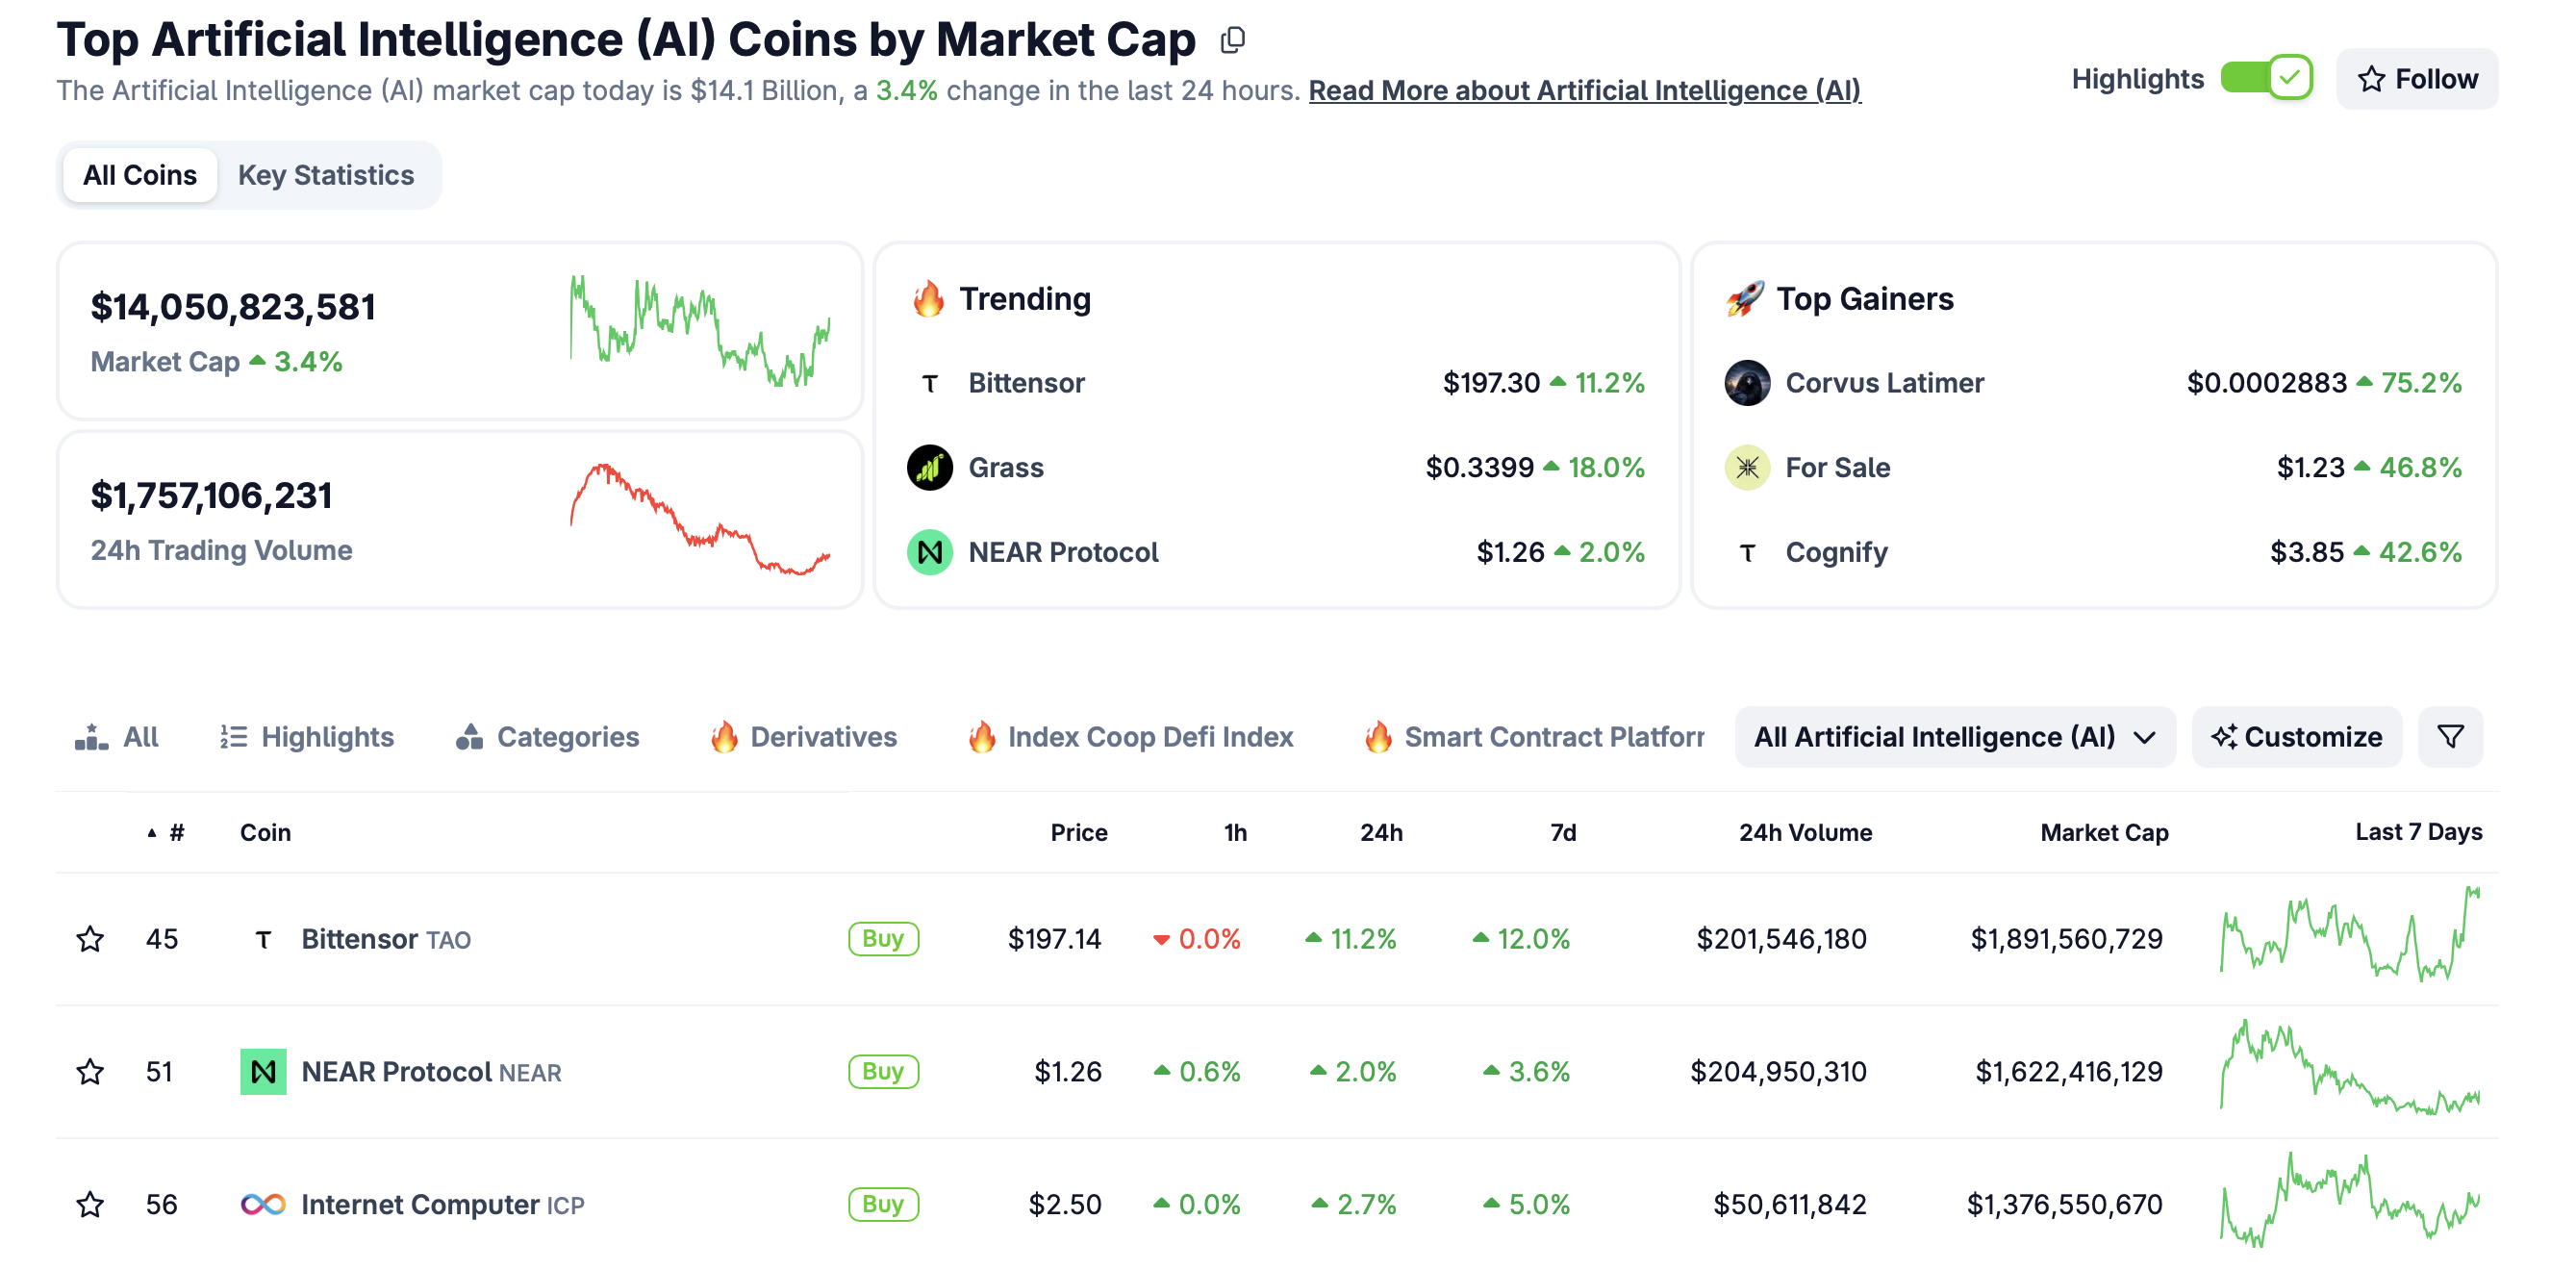
- The AI crypto sector is rising, with its total market cap climbing to $14 billion.
The cryptocurrency market is regaining momentum amid the war in the Middle East, with Bittensor (TAO) and Grass (GRASS) posting notable gains at the time of writing on Monday, driven by rising investor interest and improving technical indicators.
Meanwhile, the AI-driven token sector is showing renewed strength, with total market capitalization increasing to $14 billion, highlighting a broad-based recovery across AI crypto assets.
Retail demand returns as Bittensor and Grass soar
Interest in AI crypto tokens is rising after extended drawdowns, synonymous with bearish market trends. CoinGlass data reflects the improving sentiment, with futures Open Interest (OI) averaging $160 million on Monday, up from $141 million on March 1. A steady increase in the OI suggests that traders are regaining confidence in the leading AI token and are willing to increase their exposure.
Grass is also experiencing a surge in retail interest, as reflected by futures OI rising to $21.55 million on Monday from $18.55 million the previous day. A further increase in the OI would continue to support Grass’s bullish outlook.
Technical outlook: Bittensor and Grass bulls regain control
Bittensor is trading around $195, with the near-term bias turning cautiously bullish after reclaiming ground above the recent cluster of closes around $185, while momentum improves. The Moving Average Convergence Divergence (MACD) indicator holds above its signal line, while the expanding green histogram bars suggest strengthening upside pressure.
At the same time, the Relative Strength Index (RSI) at 56 shows bullish momentum rebuilding from mid-range levels, consistent with a recovery phase rather than a stretched rally. However, the Bittensor price remains well below the descending 50-day, the100-day and the 200-day Exponential Moving Averages (EMAs), keeping the broader trend bearish even as the short-term tone improves.
-1773071964120-1773071964125.png)
Initial support lies near $185, aligning with last week’s reaction lows and the latest breakout area, with further downside protection emerging at $176 and then $170 if the advance stalls. A sustained hold above these levels would keep the immediate recovery intact. On the upside, the first resistance sits near $200, where recent highs align with the broader descending resistance line from above $300. A daily close above this barrier would expose the next bullish target at $210, followed by a more significant hurdle around $235.
As for Grass, buyers are largely in control, holding above the 100-day EMA at $0.30 and the 50-day EMA at $0.25. The MACD indicator’s position above the signal line, as green histogram bars expand, reinforces the bullish grip while prompting traders to lean into risk.
Meanwhile, the RSI at 70 suggests that bullish momentum is building. However, a further increase in the RSI could result in a sudden pullback amid market overbought conditions.
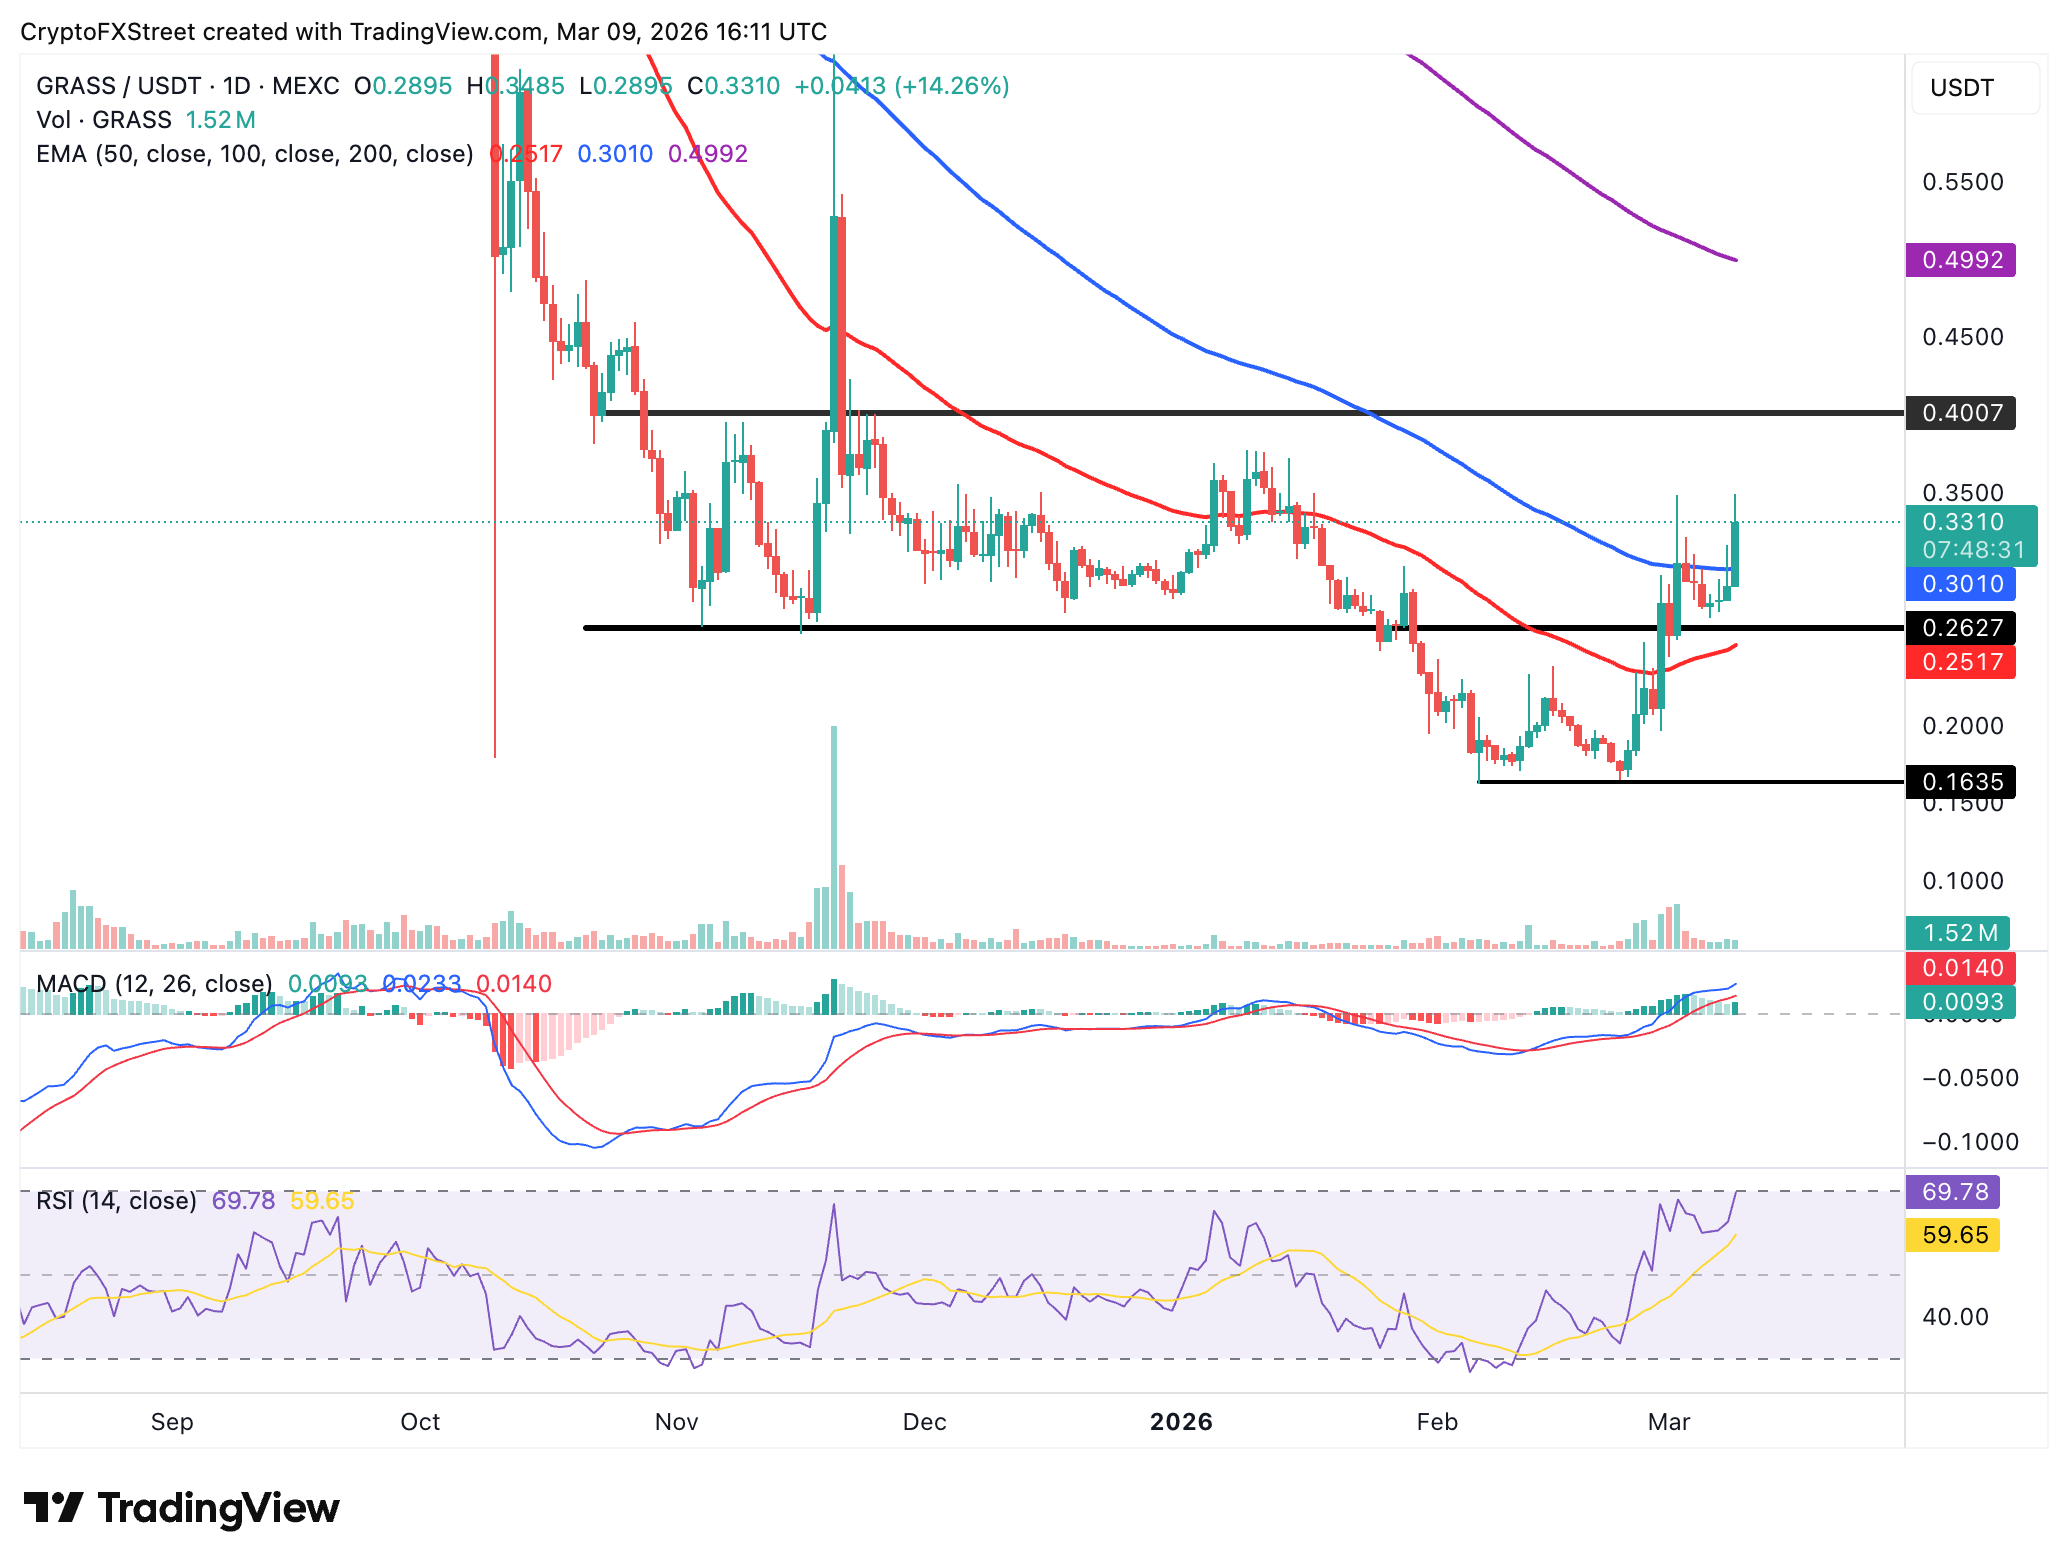
Initial resistance lies around $0.35, aligning with the daily high. A decisive break above that supply zone may open the door for an extended swing toward the range resistance at $0.40. On the downside, the 100-day EMA provides support at $0.30, followed by the demand area at $0.26 and the 50-day EMA at $0.25.
Cryptocurrency metrics FAQs
The developer or creator of each cryptocurrency decides on the total number of tokens that can be minted or issued. Only a certain number of these assets can be minted by mining, staking or other mechanisms. This is defined by the algorithm of the underlying blockchain technology. On the other hand, circulating supply can also be decreased via actions such as burning tokens, or mistakenly sending assets to addresses of other incompatible blockchains.
Market capitalization is the result of multiplying the circulating supply of a certain asset by the asset’s current market value.
Trading volume refers to the total number of tokens for a specific asset that has been transacted or exchanged between buyers and sellers within set trading hours, for example, 24 hours. It is used to gauge market sentiment, this metric combines all volumes on centralized exchanges and decentralized exchanges. Increasing trading volume often denotes the demand for a certain asset as more people are buying and selling the cryptocurrency.
Funding rates are a concept designed to encourage traders to take positions and ensure perpetual contract prices match spot markets. It defines a mechanism by exchanges to ensure that future prices and index prices periodic payments regularly converge. When the funding rate is positive, the price of the perpetual contract is higher than the mark price. This means traders who are bullish and have opened long positions pay traders who are in short positions. On the other hand, a negative funding rate means perpetual prices are below the mark price, and hence traders with short positions pay traders who have opened long positions.
(The technical analysis of this story was written with the help of an AI tool.)

100만 명이 넘는 사용자가 FXStreet를 통해 실시간 시장 데이터, 차트 도구, 전문가 인사이트, 포렉스 뉴스를 이용합니다. 포괄적인 경제 캘린더와 교육 웨비나는 트레이더가 정보를 유지하고 신중한 결정을 내리도록 돕습니다. FXStreet는 바르셀로나 본사와 전 세계 지역에 걸쳐 약 60명의 팀으로 구성되어 있습니다.
더 읽기


