
Bittensor Price Forecast: TAO accelerates sell-off despite broader crypto market recovery
작성자 John Isige
수정됨: 14 Apr 2026


인기 기사

Bittensor (TAO) is in an active downward trend, down nearly 3% to trade around $252 at the time of writing on Tuesday. Sentiment surrounding the crypto Artificial Intelligence (AI) market has remained significantly depressed since last week, following the exit of subnet developer Covenant AI.
- Bittensor trades nearly 28% below its April peak, testing support around $250 on Tuesday.
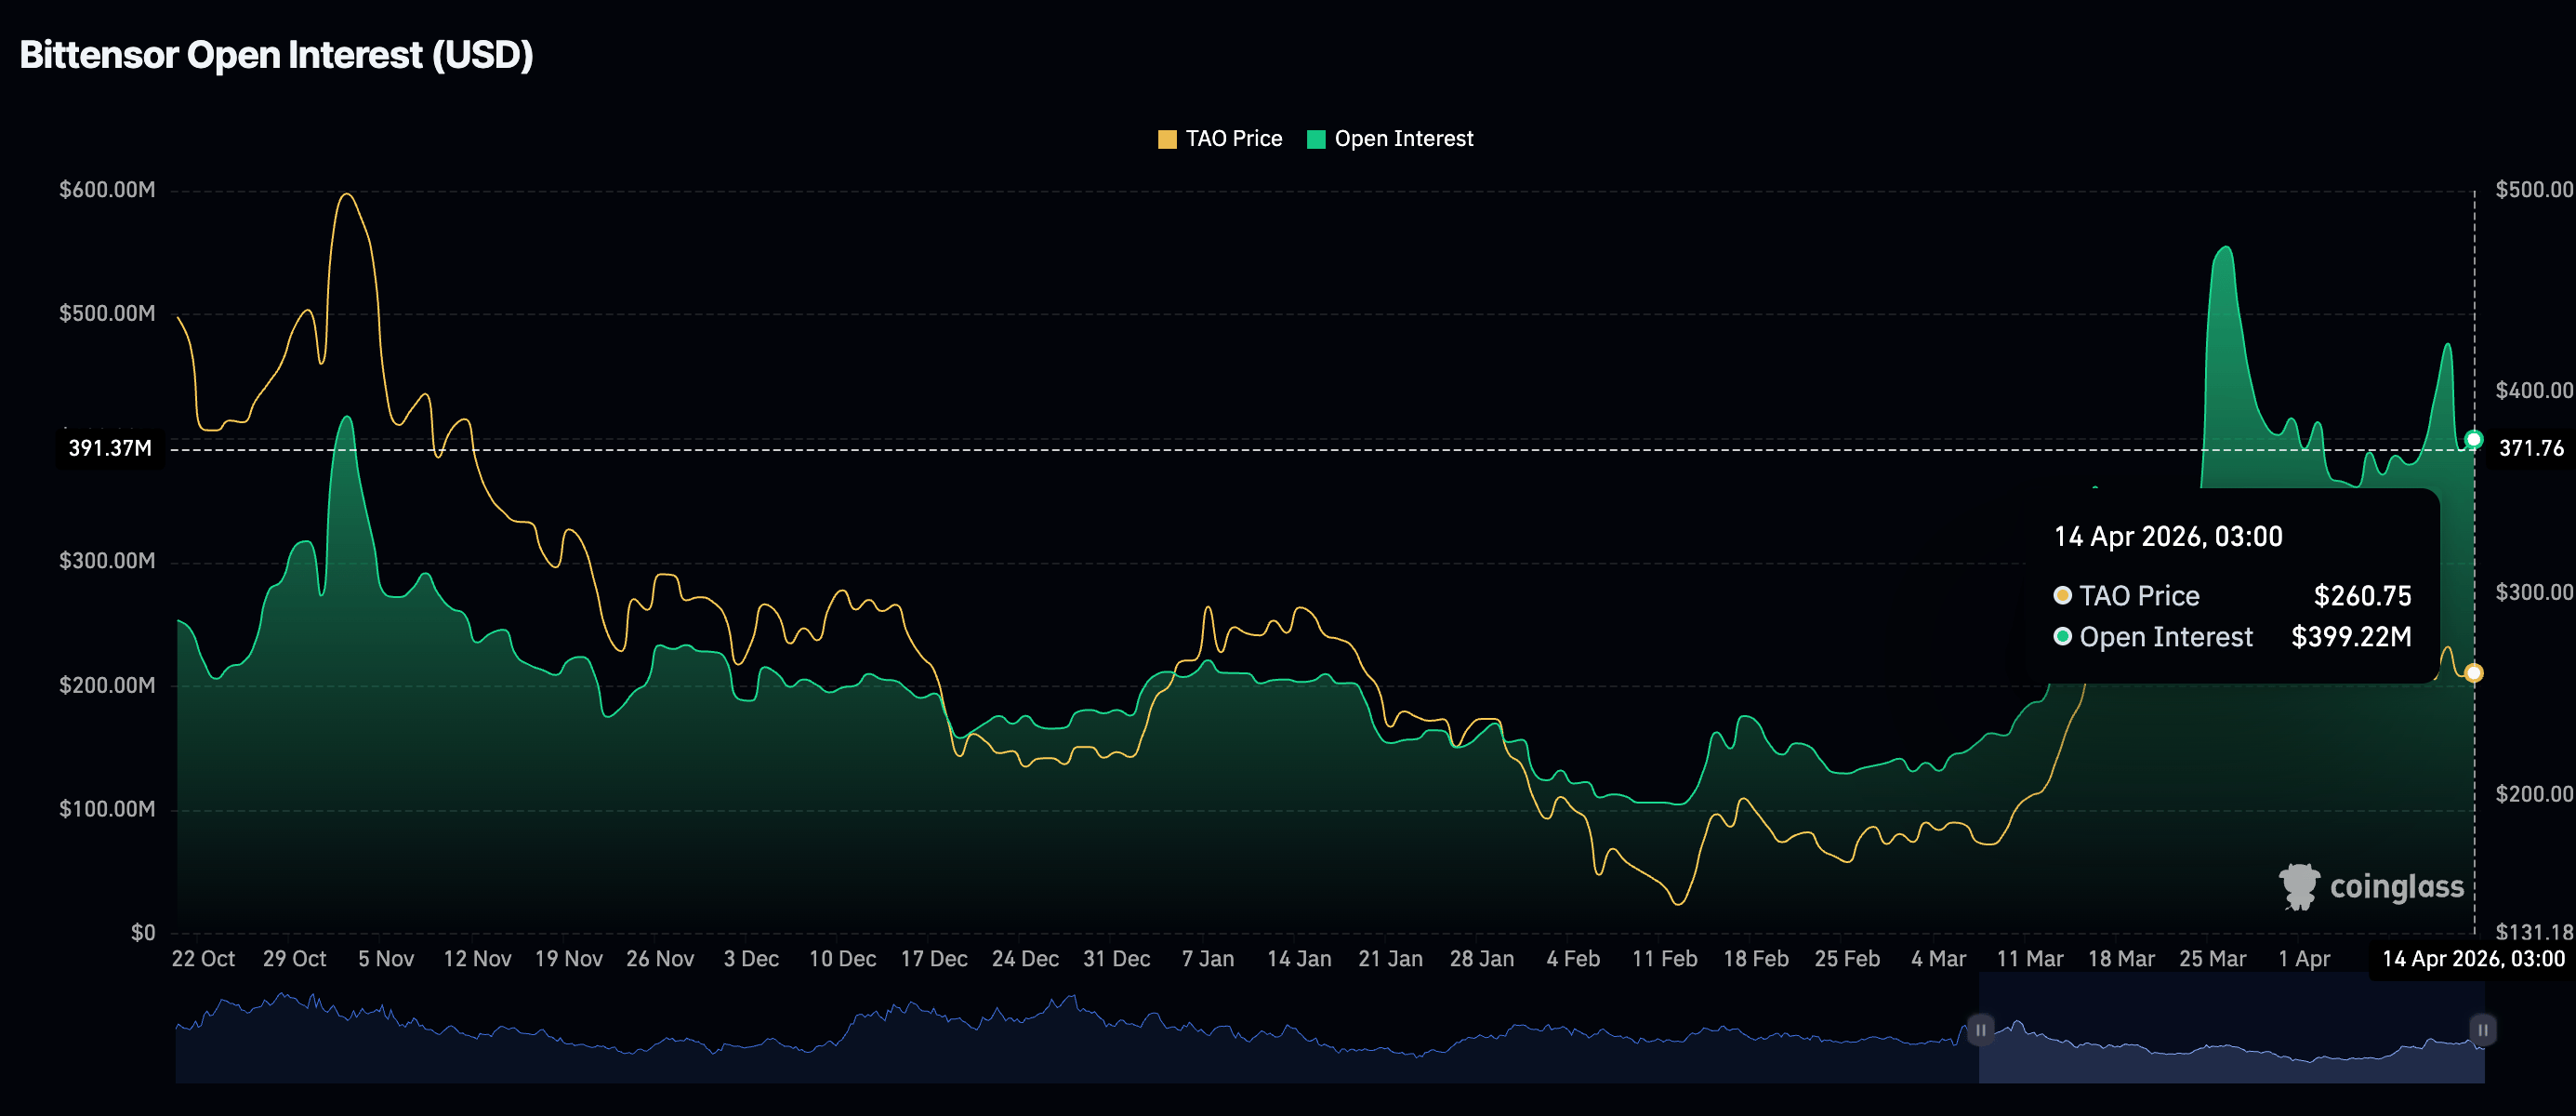
- TAO retail demand shows signs of recovery with futures Open Interest nearing $400 million.
- Bittensor remains pressured by deteriorating technicals, with the MACD upholding a sell signal while RSI falls toward oversold territory.
Bittensor (TAO) is in an active downward trend, down nearly 3% to trade around $252 at the time of writing on Tuesday. Sentiment surrounding the crypto Artificial Intelligence (AI) market has remained significantly depressed since last week, following the exit of subnet developer Covenant AI.
Sam Dare, the founder of Covenant AI, cited concerns about decentralization and alleged punitive actions by Bittensor’s co-founder, Jacob Steeves. TAO suffered a major drawdown following Covenant AI’s exit, which continues to weigh on the price.
Renewed retail interest could lift Bittensor’s outlook
Retail investors are expanding their risk appetite after Bittensor’s derivatives cooled last week. The TAO futures OI holds near $400 million on Tuesday, up from roughly $390 million the previous day.
A steadily growing derivatives market serves as a foundation for sustained price recovery, underpinning investor confidence and supporting long-term growth in risk assets such as Bittensor.
Technical outlook: Bittensor slides testing critical support
Bitcoin trades at $252, keeping a bearish near-term bias as price holds below the 50-day, 100-day, and the 200-day Exponential Moving Averages (EMAs) clustered between roughly $259 and $276. The alignment of overhead moving averages suggests recovery attempts are likely to be capped for now, especially given the Relative Strength Index at 40, which shows modestly weak momentum.
At the same time, the Moving Average Convergence Divergence (MACD) remains in negative territory, suggesting downside pressure persists despite selling gradually cooling.
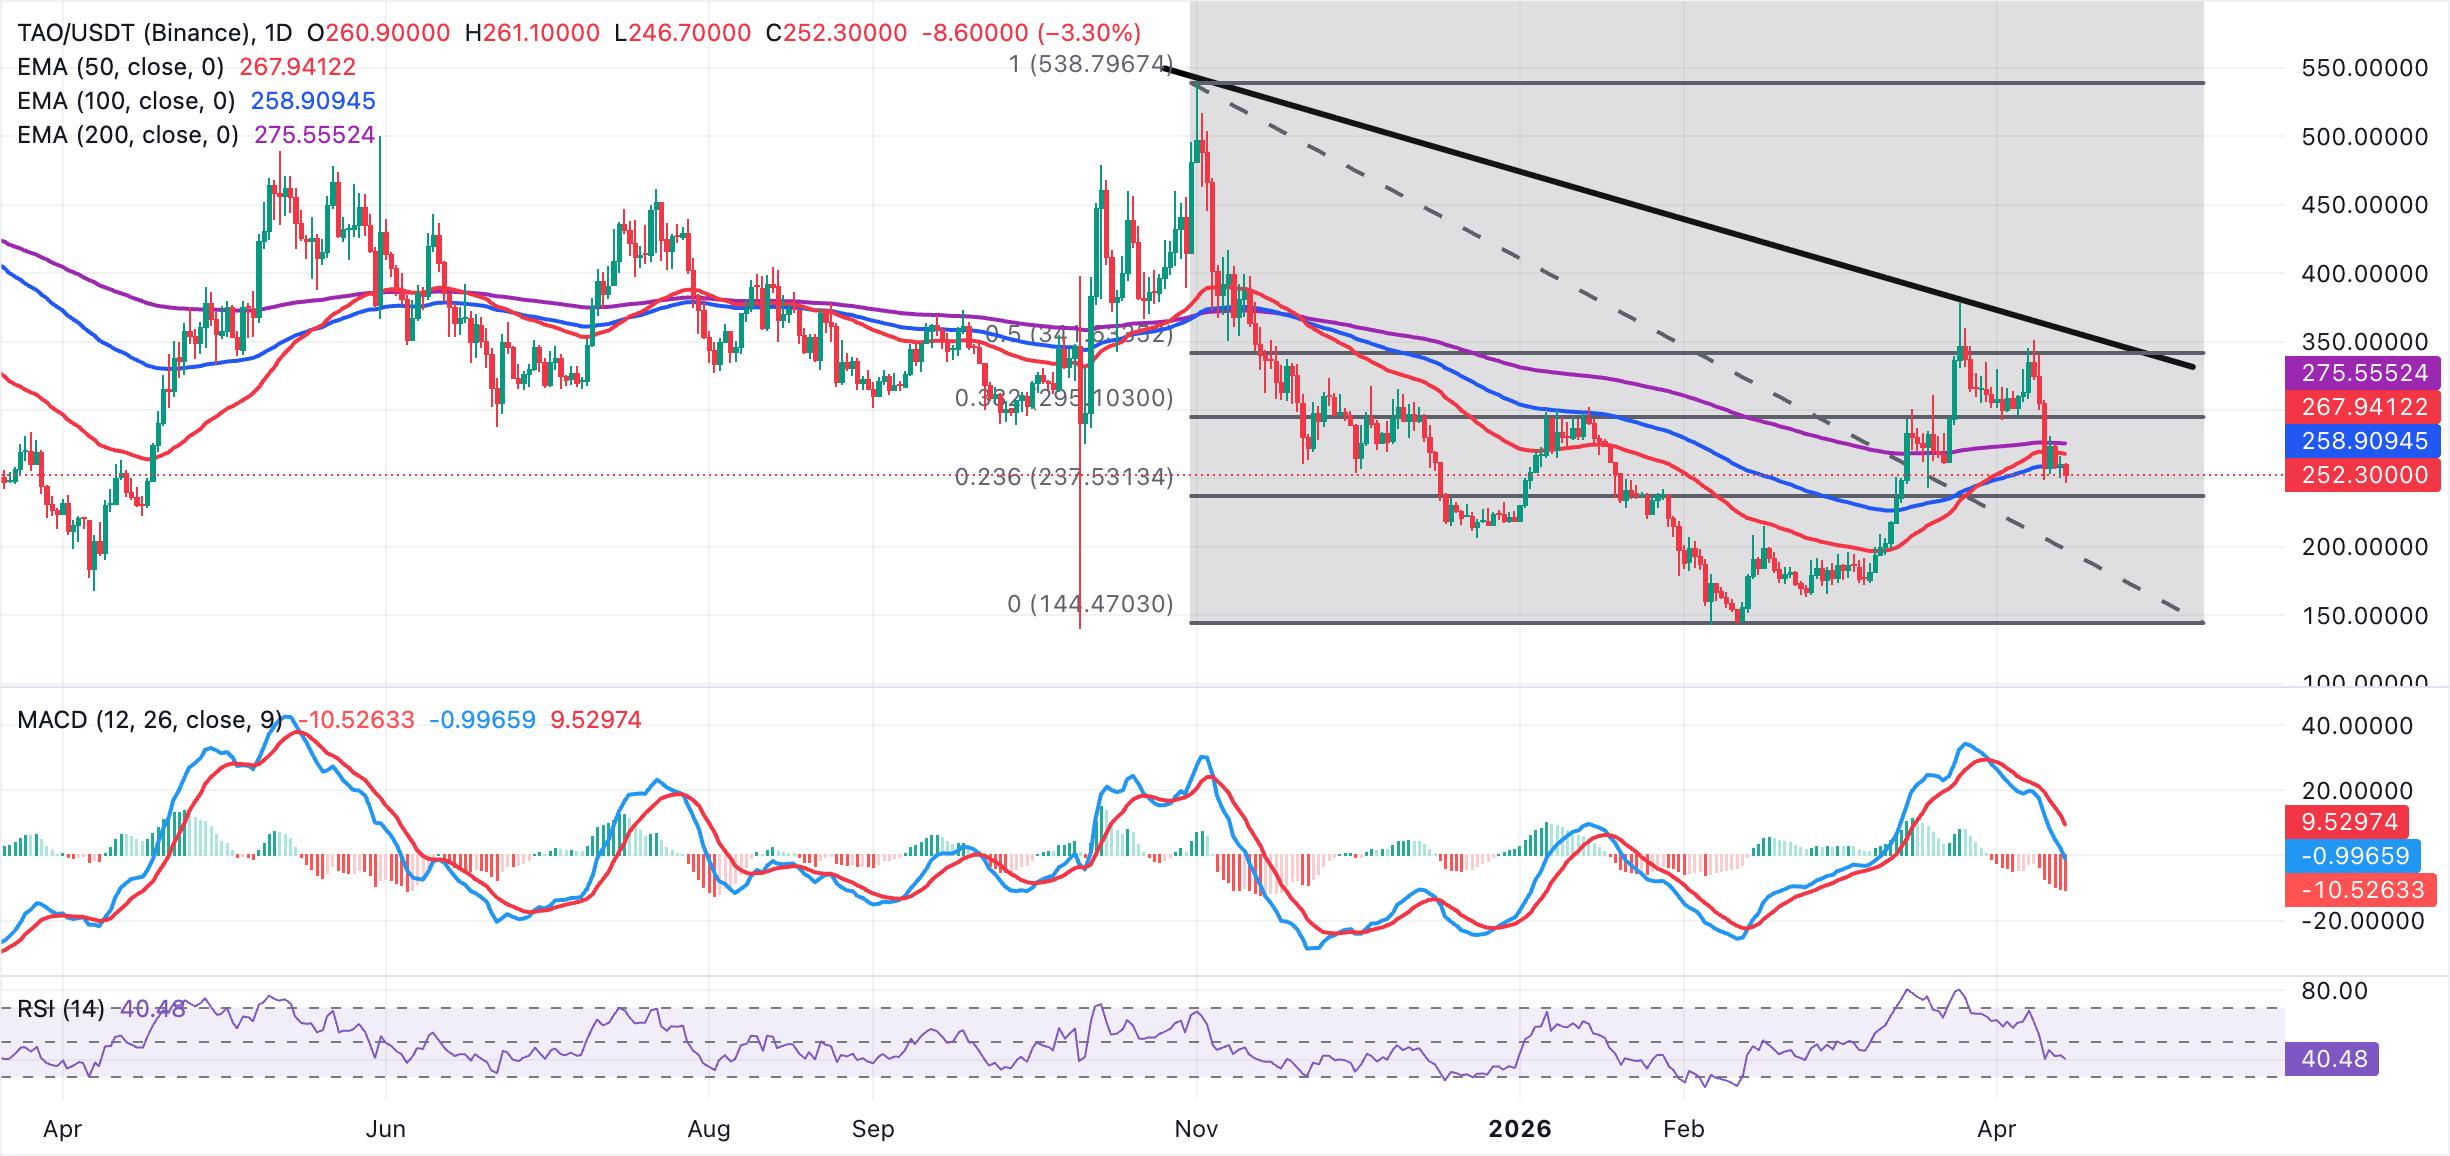
On the topside, TAO's initial resistance is seen at the 100-day EMA near $259, followed by the 50-day EMA around $268 and then the 200-day EMA at $276. A sustained break above the EMA band would be needed to ease the current bearish structure, with further resistance at the 38.2% Fibonacci retracement of the broader downswing at $295 and higher toward the 50% retracement at $342. On the downside, immediate support lies at the 23.6% retracement near $238, with a deeper bearish extension exposing the prior cycle low area around $145.
Open Interest, funding rate FAQs
Higher Open Interest is associated with higher liquidity and new capital inflow to the market. This is considered the equivalent of increase in efficiency and the ongoing trend continues. When Open Interest decreases, it is considered a sign of liquidation in the market, investors are leaving and the overall demand for an asset is on a decline, fueling a bearish sentiment among investors.
Funding fees bridge the difference between spot prices and prices of futures contracts of an asset by increasing liquidation risks faced by traders. A consistently high and positive funding rate implies there is a bullish sentiment among market participants and there is an expectation of a price hike. A consistently negative funding rate for an asset implies a bearish sentiment, indicating that traders expect the cryptocurrency’s price to fall and a bearish trend reversal is likely to occur.
(The technical analysis of this story was written with the help of an AI tool.)

100만 명이 넘는 사용자가 FXStreet를 통해 실시간 시장 데이터, 차트 도구, 전문가 인사이트, 포렉스 뉴스를 이용합니다. 포괄적인 경제 캘린더와 교육 웨비나는 트레이더가 정보를 유지하고 신중한 결정을 내리도록 돕습니다. FXStreet는 바르셀로나 본사와 전 세계 지역에 걸쳐 약 60명의 팀으로 구성되어 있습니다.
더 읽기


