
Bittensor Price Forecast: TAO eyes second leg higher as bullish momentum builds
작성자 Manish Chhetri
수정됨: 8 Apr 2026


인기 기사

Bittensor (TAO) continues to climb, trading above $335 on Wednesday after surging over 8% so far this week.
- Bittensor price extends its gains on Wednesday, up over 8% so far this week.
- Derivatives data point to a bullish outlook, with positive funding rates and increasing Open Interest indicating rising investor confidence.
- The technical outlook suggests TAO could be gearing up for a second leg higher, targeting levels above $400.
Bittensor (TAO) continues to climb, trading above $335 on Wednesday after surging over 8% so far this week. Improving sentiment across the derivatives market supports a bullish outlook for TAO, while technical analysis suggests a continuation of the bullish trend, aiming for levels above $400 in the upcoming days.
Derivatives data shows a bullish bias
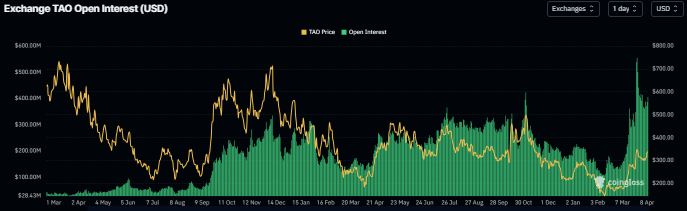
CoinGlass’s data shows that the futures’ OI at exchanges in Bittensor reached a record high of $554.98 million on March 26 and, despite a slight pullback, remains on an upward trajectory, standing at $407.58 million as of Wednesday. An increasing OI indicates new or additional money entering the market and new buying, which could fuel a second leg higher in the TAO price.
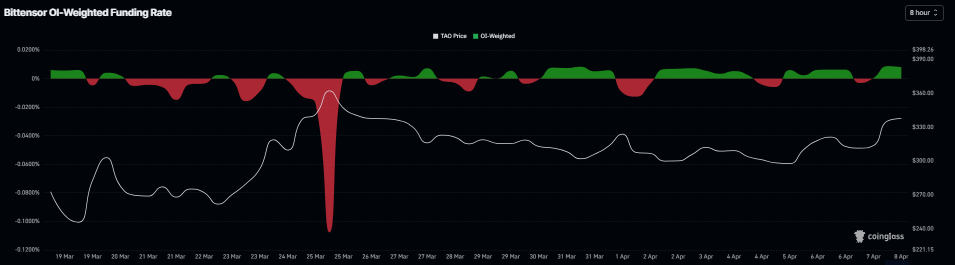
In addition, TAO’s funding rate flipped positive on Tuesday and stands at 0.008% on Wednesday, indicating that longs are paying shorts. Historically, as shown in the chart below, when funding rates have flipped from negative to positive and risen, the TAO price has surged.
Apart from bullish derivatives metrics, market sentiment also supports a risk-on stance amid easing geopolitical tensions between the US and Iran following the announcement of a two-week ceasefire, which could further fuel TAO’s upward momentum.
Bittensor Price Forecast: TAO bulls aim for levels above $400
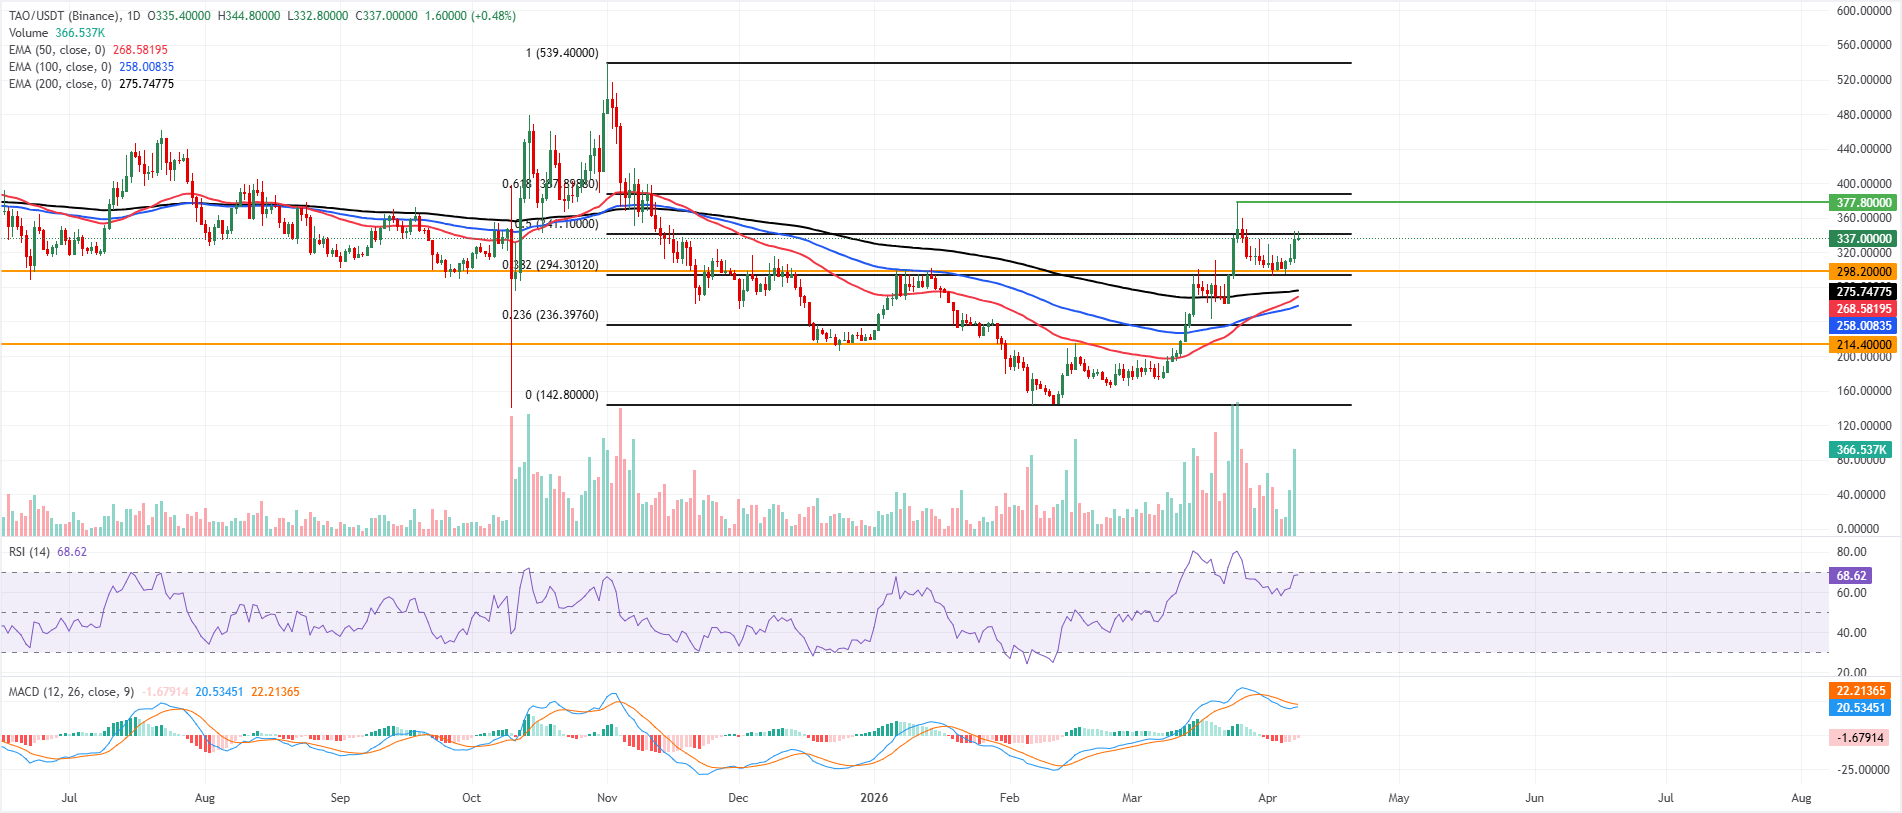
Bittensor price trades above $335 on Wednesday, up over 8% so far this week. The near-term bias turns cautiously bullish as price holds well above the 50-day, 100-day and 200-day Exponential Moving Averages near $258-$275, keeping the broader uptrend intact despite the recent pullback from the $377 area.
The Relative Strength Index (RSI) on the daily chart at 68 stays in positive territory without showing outright overbought stress, while the Moving Average Convergence Divergence (MACD) line climbs toward the signal line above zero, and the contracting negative histogram suggests fading bearish pressure after the correction.
Immediate cushion emerges at horizontal support at $298, which roughly aligns with the 38.2% Fibonacci retracement at $294, measured from the $142 low to the $539 high.
On the upside, initial resistance stands near $341, the 50.0% retracement, followed by the $388 area at the 61.8% retracement, where any rejection would cap the nascent recovery. A daily close above $341 would open the way for a second leg toward the key psychological level at $400.
(The technical analysis of this story was written with the help of an AI tool.)

100만 명이 넘는 사용자가 FXStreet를 통해 실시간 시장 데이터, 차트 도구, 전문가 인사이트, 포렉스 뉴스를 이용합니다. 포괄적인 경제 캘린더와 교육 웨비나는 트레이더가 정보를 유지하고 신중한 결정을 내리도록 돕습니다. FXStreet는 바르셀로나 본사와 전 세계 지역에 걸쳐 약 60명의 팀으로 구성되어 있습니다.
더 읽기


