
BNB Price Forecast: Correction extends as bearish signals point to deeper losses
작성자 Manish Chhetri
수정됨: 19 Jun 2026


인기 기사

BNB (BNB), formerly known as Binance Coin, continues to extend its losses, trading below $573 at the time of writing on Friday, losing over 7% so far this week. Muted institutional demand, rising short bets and falling Open Interest (OI) signal growing downside bias.
- BNB continues its correction, trading below $573 on Friday and extending losses by over 7% so far this week.
- Muted ETF flows, rising short bets and falling open interest in the derivatives market support a bearish outlook.
- The technical outlook suggests a daily close below the $570 support level could trigger a deeper correction toward $488.
BNB (BNB), formerly known as Binance Coin, continues to extend its losses, trading below $573 at the time of writing on Friday, losing over 7% so far this week. Muted institutional demand, rising short bets and falling Open Interest (OI) signal growing downside bias. The technical outlook shows BNB is approaching a critical support zone at $570, and a decisive close below this could pave the way for deeper losses.
Muted institutional demand
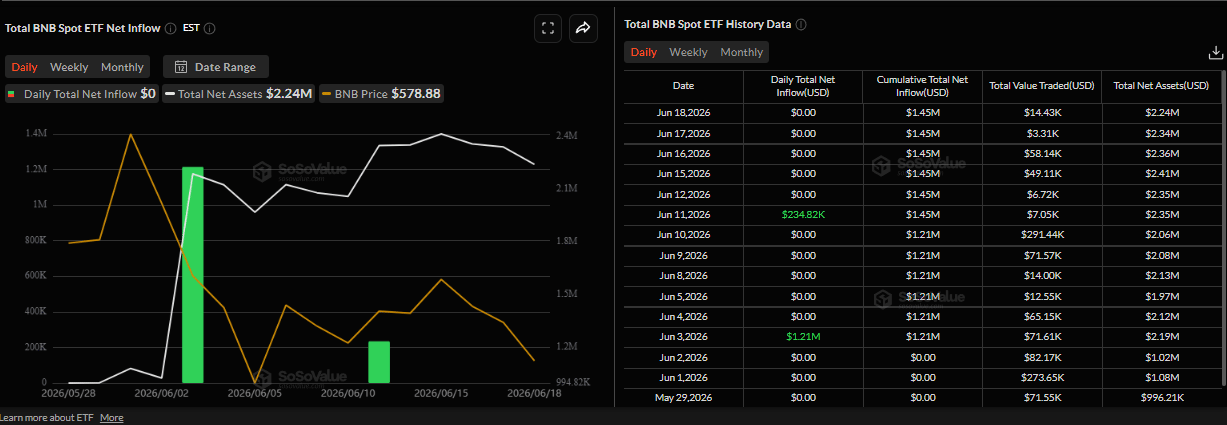
SoSoValue data shows that BNB’s spot Exchange-Traded Funds (ETFs) have remained largely silent since their launch on May 28, indicating a lack of meaningful institutional demand for the token. This muted demand fails to provide a cushion against falling BNB prices.
Derivatives metrics hint at further losses
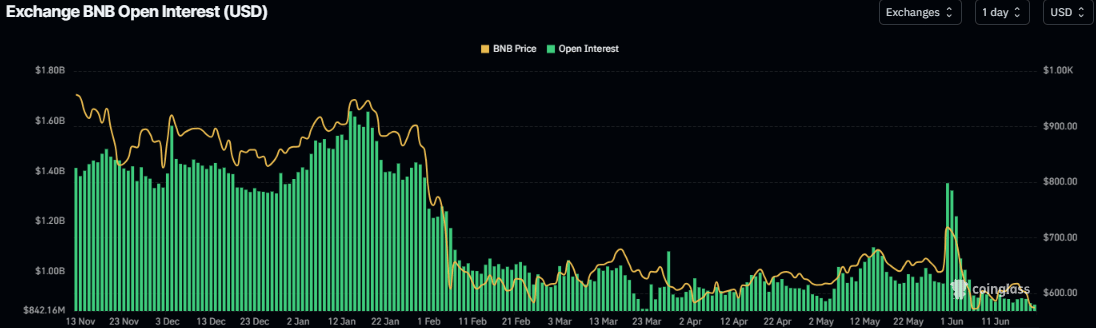
BNB’s derivatives metrics support a negative outlook. BNB’s futures OI dropped to $867 million on Friday after a mild rise in early June but has been continuously falling since mid-January. This drop in OI reflects waning investor participation and projects a bearish outlook.
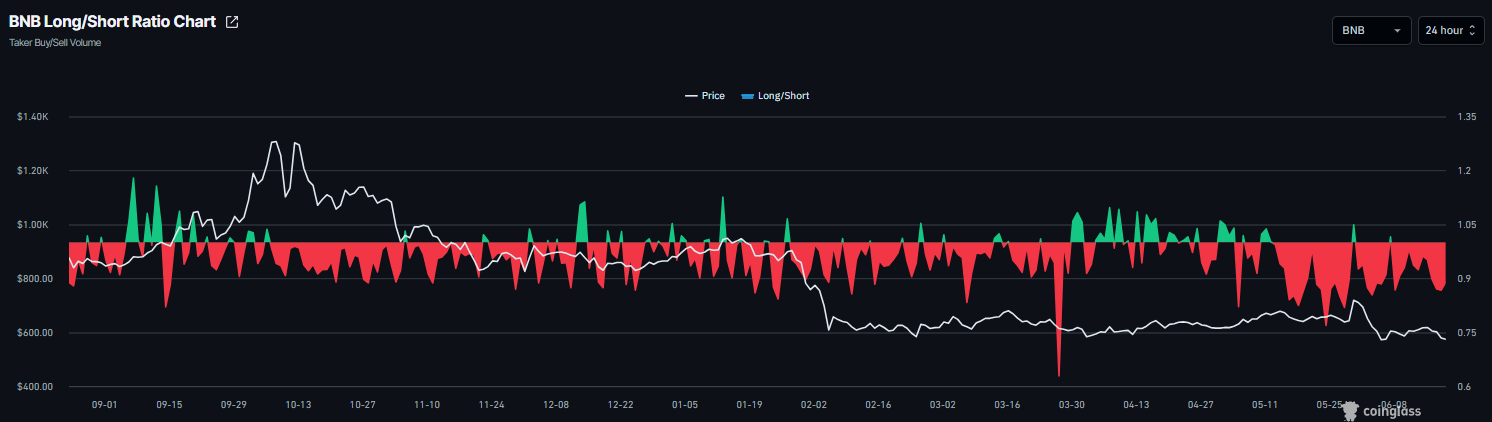
In addition, CoinGlass’ long-to-short ratio for BNB reads 0.88 on Friday, nearing its lowest level in over a month. This ratio, being below one, reflects bearish sentiment in the market, as more traders are betting on the asset’s price to fall.
BNB Price Forecast: Deeper losses if BNB closes below $570
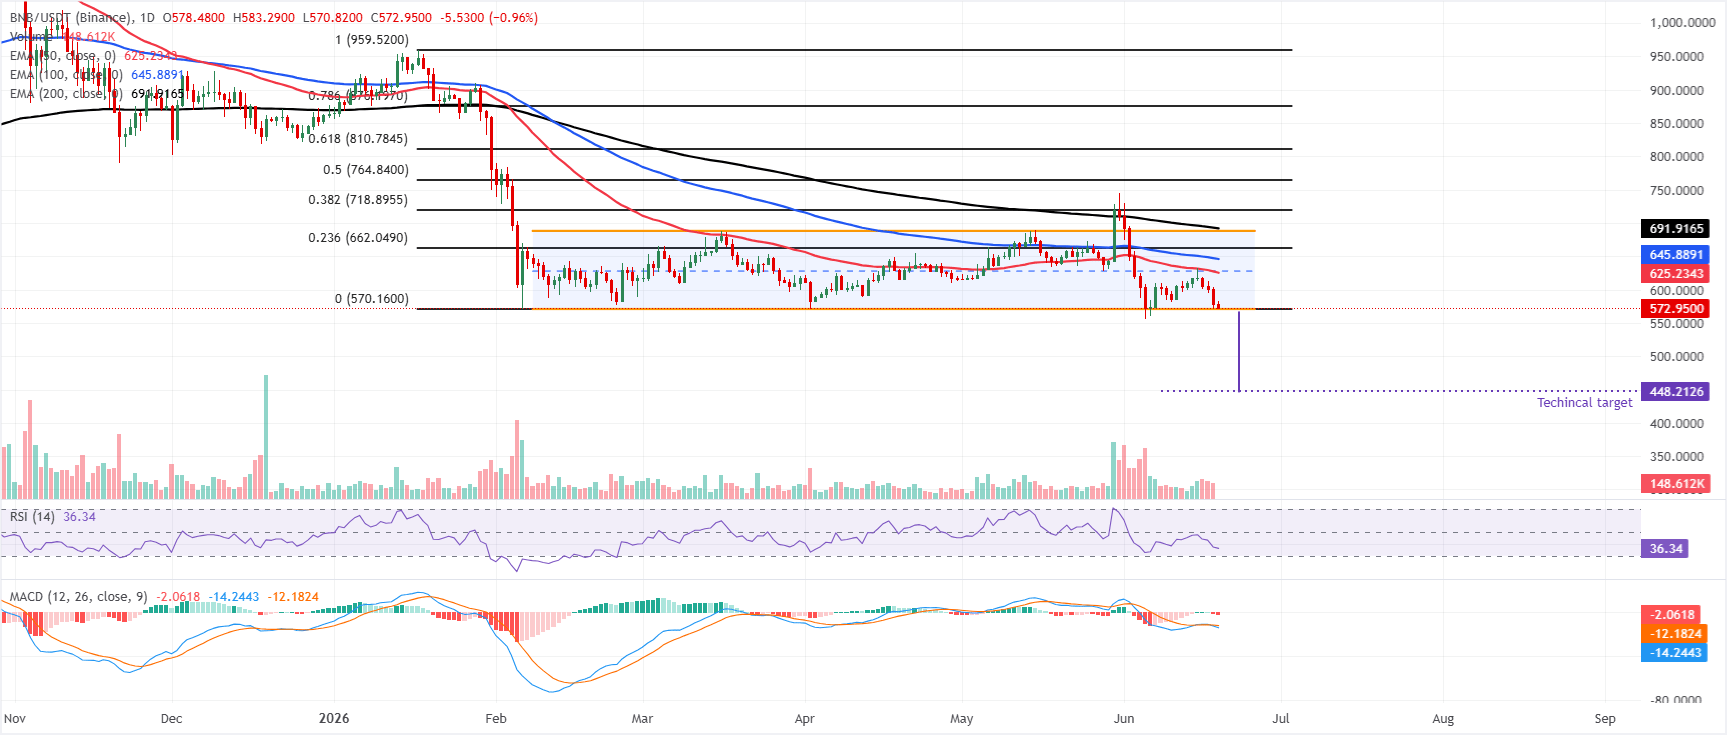
BNB price trades at $572.95 on Friday, extending a bearish phase after facing rejection from the 50-day Exponential Moving Average (EMA) at $625.24 at the start of this week.
BNB is sliding within a parallel channel, hovering just above the lower boundary near $570, while the Relative Strength Index (RSI) hovers in the mid-30s, and the Moving Average Convergence Divergence (MACD) stays below zero with negative values, hinting that sellers still retain control despite nearing oversold conditions.
On the downside, initial support aligns with the channel bottom at roughly $570, where a daily close below would suggest a correction toward the technical target at $488.21 (based on the distance between the channel extrapolated from the breakdown point).
On the topside, any bounce faces immediate resistance from the 50-day EMA at $625.24, followed by the 100-day EMA at $645.88 and the 23.6% Fibonacci retracement at $662.04; a stronger recovery would need to challenge the channel top near $687.30 and the 200-day EMA at $691.91 before the higher retracement barriers at $718.89, $764.84, $810.78, $876.20 and $959.52 come back into play.
(The technical analysis of this story was written with the help of an AI tool.)

100만 명이 넘는 사용자가 FXStreet를 통해 실시간 시장 데이터, 차트 도구, 전문가 인사이트, 포렉스 뉴스를 이용합니다. 포괄적인 경제 캘린더와 교육 웨비나는 트레이더가 정보를 유지하고 신중한 결정을 내리도록 돕습니다. FXStreet는 바르셀로나 본사와 전 세계 지역에 걸쳐 약 60명의 팀으로 구성되어 있습니다.
더 읽기


