
Cardano Price Analysis: ADA attempts recovery as whale buying fails to lift bearish trend
작성자 Manish Chhetri
수정됨: 20 May 2026


인기 기사

Cardano (ADA) recovers slightly, trading above $0.250 on Wednesday, after posting five straight days of losses since last week. On-chain data shows that whale wallets are accumulating ADA during the recent correction, signaling continued long-term interest in the altcoin.
- Cardano recovers slightly on Wednesday after posting five consecutive red candlesticks.
- Data shows that whale wallets have accumulated ADA tokens during recent price dips.
- Weakening momentum indicators and mixed derivatives metrics suggest ADA’s recovery potential is limited.
Cardano (ADA) recovers slightly, trading above $0.250 on Wednesday, after posting five straight days of losses since last week. On-chain data shows that whale wallets are accumulating ADA during the recent correction, signaling continued long-term interest in the altcoin. Despite this buying activity, weakening technical momentum and mixed sentiment in the derivatives markets continue to put a lid on ADA’s recovery.
Whales are buying the dip
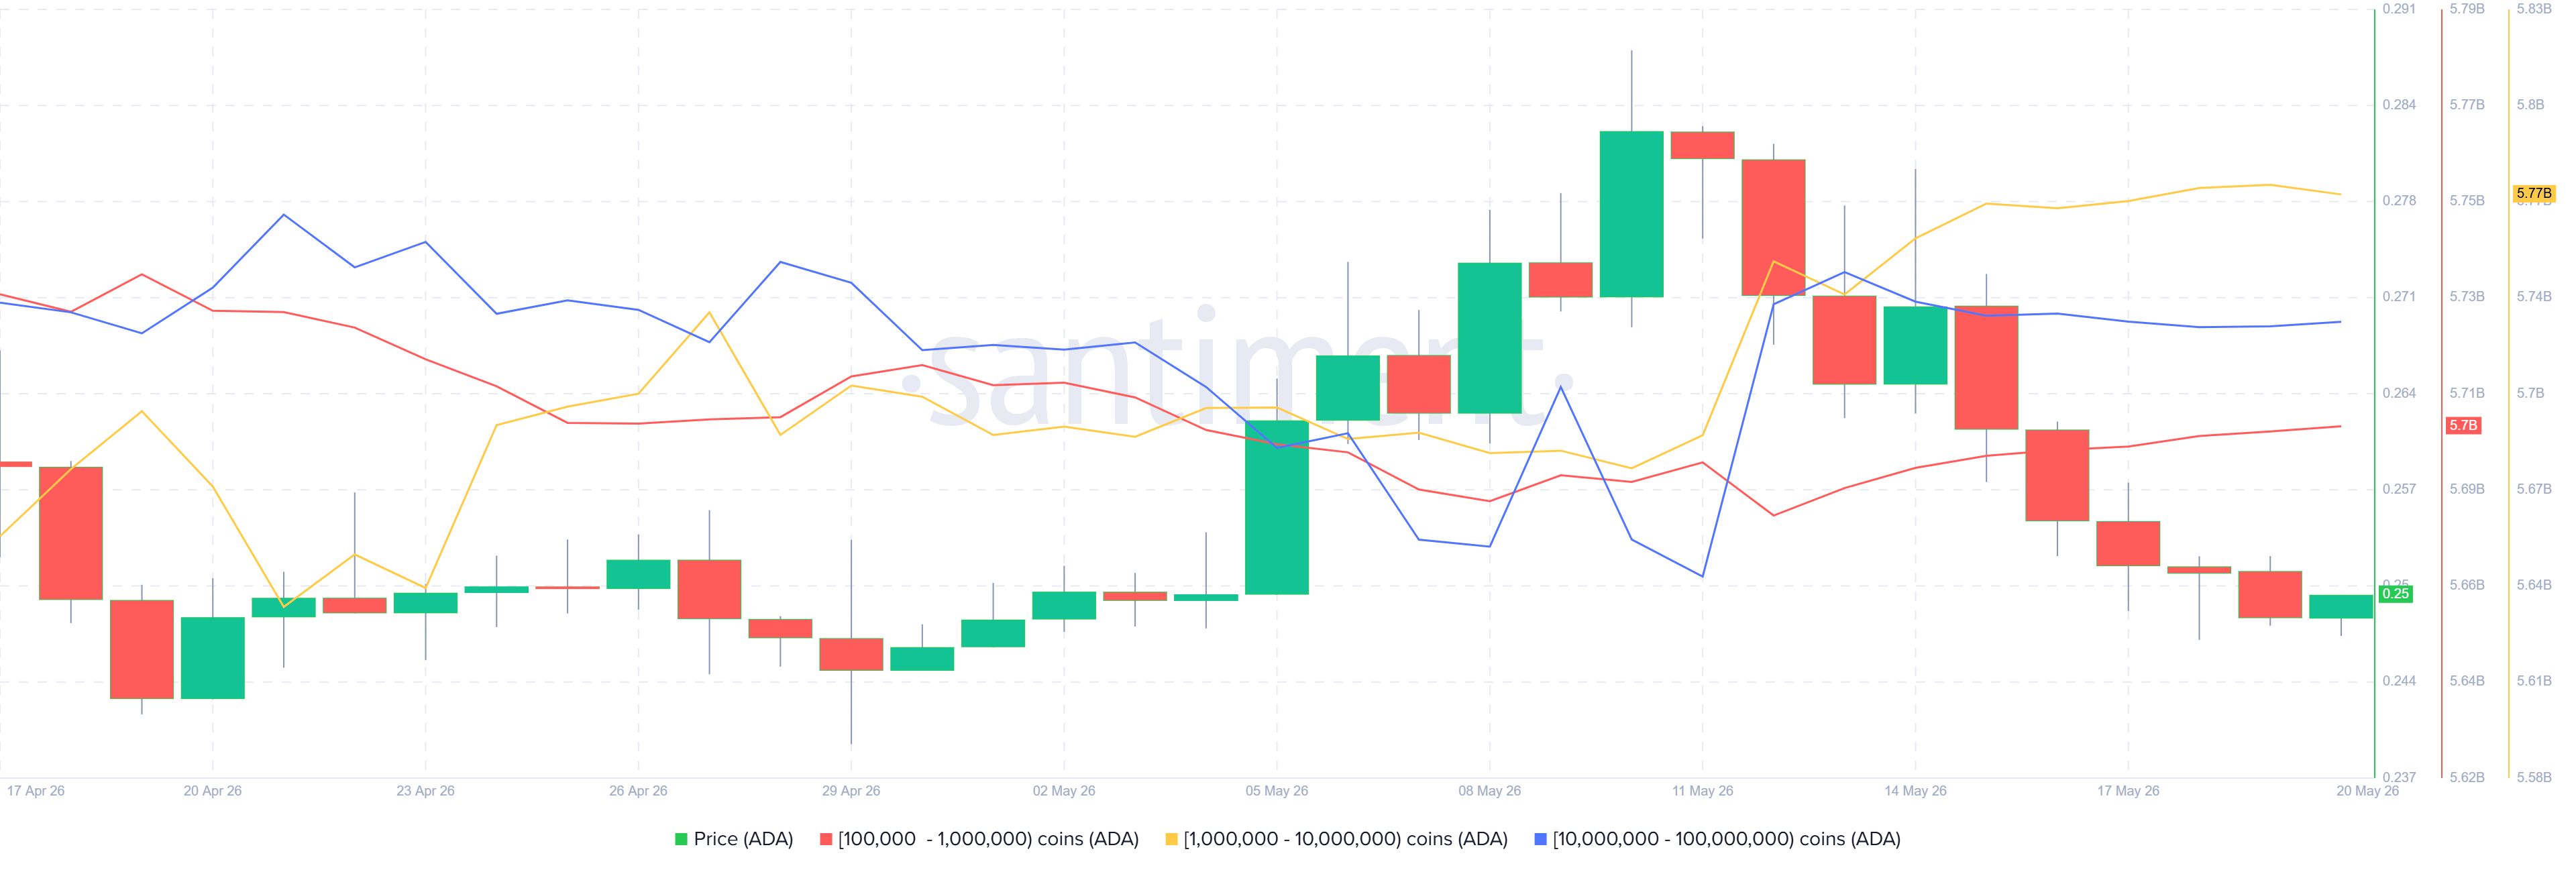
Santiment’s Supply Distribution data shows that large-wallet holders (whales) are buying ADA during its recent price dips, a move that supports the positive outlook for the token.
The metric indicates that whales holding between 100,000 and 1 million tokens (red line), between 1 million and 10 million (yellow line), and those holding between 10 million and 100 million ADA tokens have accumulated a total of 250 million tokens since May 11. This buy-the-dip scenario signals continued long-term interest among large-wallet holders, which could act as a cushion.
Mixed derivatives metrics continue to limit ADA recovery
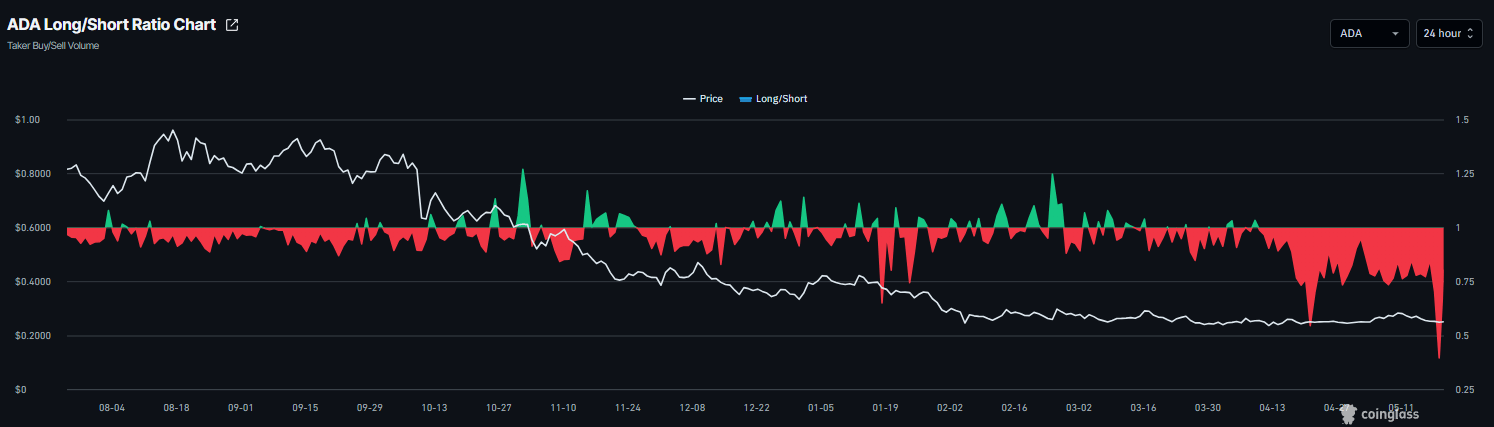
The mixed sentiment in the derivatives market continues to limit ADA’s recovery potential. CoinGlass’ long-to-short ratio reads 0.80 on Wednesday, nearing its lowest level over a month. This ratio, being below one, reflects bearish sentiment in the market, as more traders are betting on the asset’s price to fall.
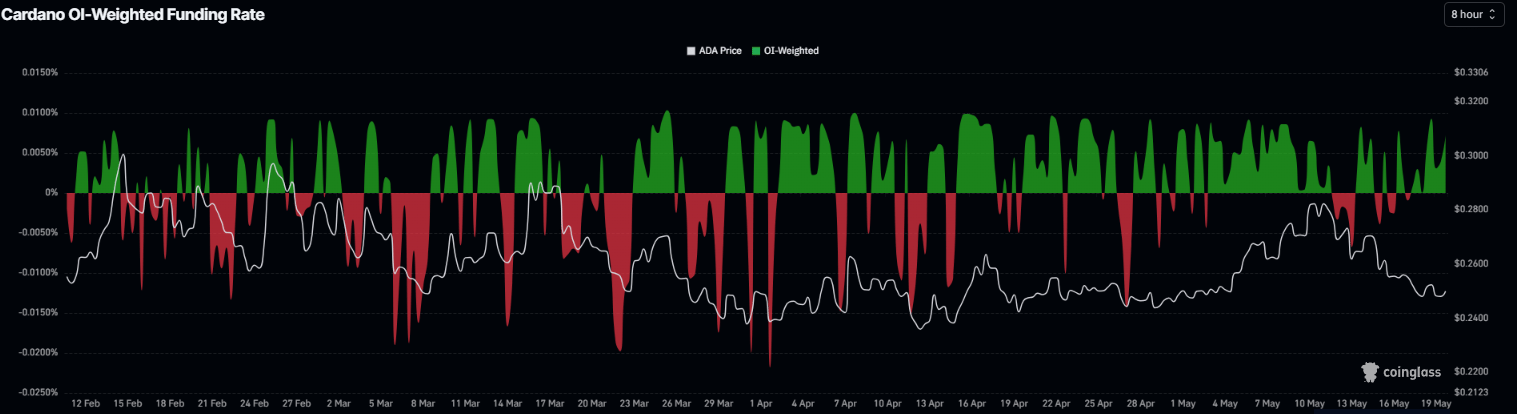
On the contrary, funding rates support improving sentiment. CoinGlass’ OI-Weighted Funding Rate data for Cardano flipped positive on Sunday and read 0.0072% on Wednesday. This positive rate indicates that longs are paying shorts and projecting a mild bullish sentiment.
Cardano Price Forecast: Momentum indicators tilt bearish
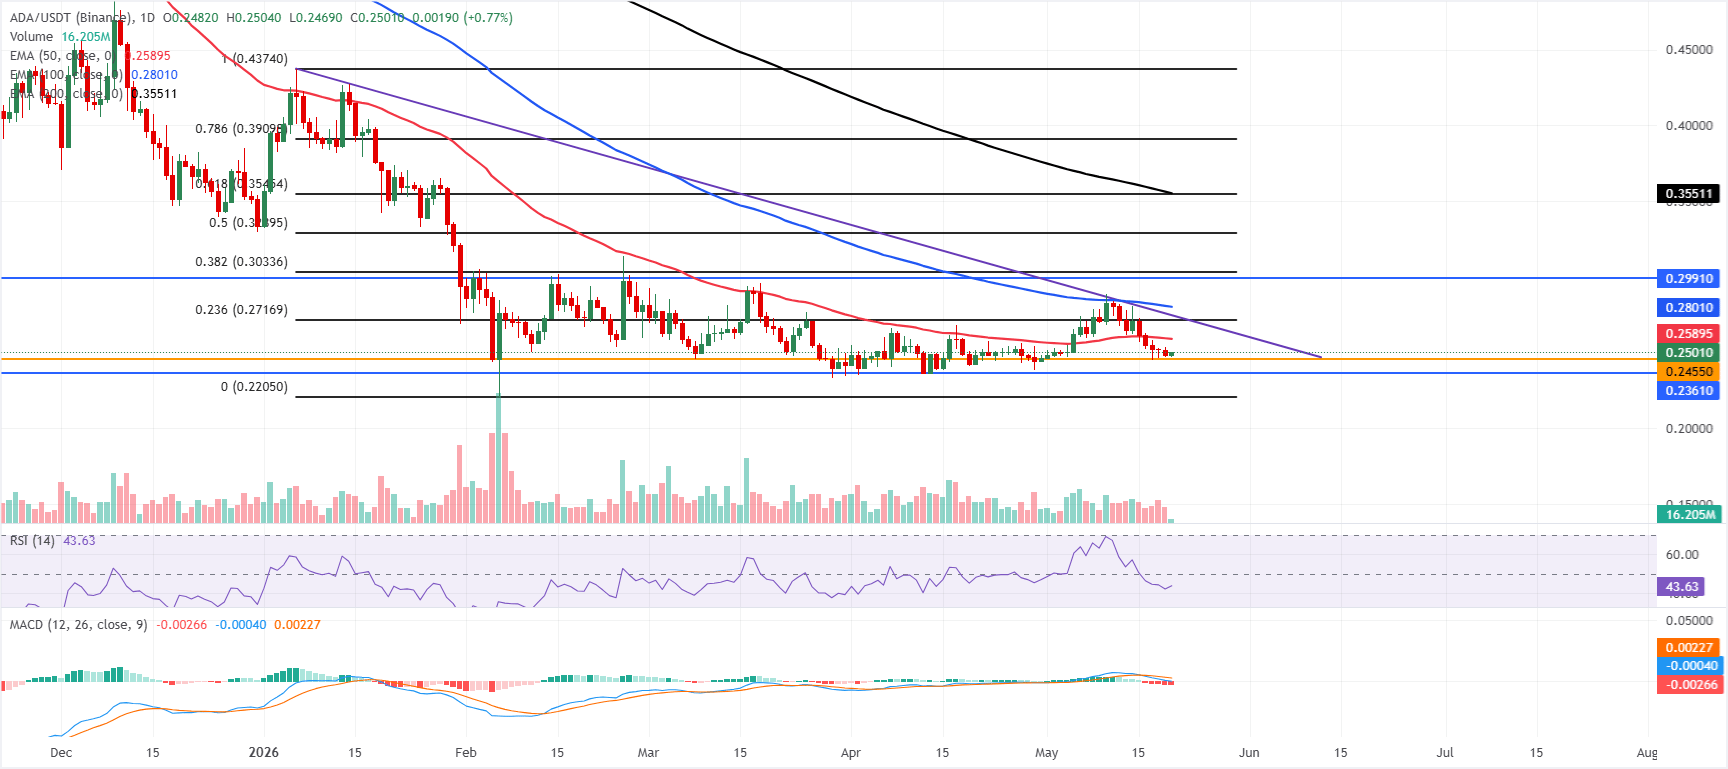
Cardano price is trading at $0.250 on Wednesday, keeping a bearish near‑term tone as it remains below the 50-day, 100-day and 200-day Exponential Moving Averages (EMAs) at $0.258, $0.280 and $0.355, respectively, and under a downward resistance trendline (drawn by connecting multiple highs since early January).
The Relative Strength Index (RSI) on the daily chart hovers around 43, and the Moving Average Convergence Divergence (MACD) stays in negative territory, which together suggest subdued momentum and reinforce the idea that rallies are likely to be capped by the nearby EMA and Fibonacci resistances rather than signal a sustained recovery.
On the topside, initial resistance appears at the 50-day EMA near $0.258, followed by the 23.6% Fibonacci retracement at $0.271(drawn from the January high to the February low) and the trendline break level at $0.274, with additional barriers at the 100-day EMA around $0.280 and the horizontal hurdle at $0.299 before the 38.2% Fibonacci retracement at $0.303.
On the downside, immediate support lies at the horizontal level of $0.245, ahead of $0.236, and then the Fibonacci anchor near $0.220 (February low), where a deeper pullback could find a more solid demand zone.
(The technical analysis of this story was written with the help of an AI tool.)

100만 명이 넘는 사용자가 FXStreet를 통해 실시간 시장 데이터, 차트 도구, 전문가 인사이트, 포렉스 뉴스를 이용합니다. 포괄적인 경제 캘린더와 교육 웨비나는 트레이더가 정보를 유지하고 신중한 결정을 내리도록 돕습니다. FXStreet는 바르셀로나 본사와 전 세계 지역에 걸쳐 약 60명의 팀으로 구성되어 있습니다.
더 읽기


