
Cardano Price Forecast: ADA edges higher as derivatives and momentum indicators flag tentative bullish bias
작성자 Manish Chhetri
수정됨: 4 May 2026


인기 기사

Cardano (ADA) trades slightly above $0.250 on Monday after taking a breather in the previous week. Neutral on-chain metrics and slight bullish derivatives data suggest cautious optimism among traders. On the technical side, fading bearish signals suggest a possible recovery for ADA.
- Cardano price trades slightly higher on Monday after consolidating the previous week.
- On-chain data remains largely neutral, while derivatives metrics lean slightly bullish, suggesting cautious optimism.
- The technical outlook shows fading bearish pressure, with momentum indicators signaling a possible upside move ahead.
Cardano (ADA) trades slightly above $0.250 on Monday after taking a breather in the previous week. Neutral on-chain metrics and slight bullish derivatives data suggest cautious optimism among traders. On the technical side, fading bearish signals suggest a possible recovery for ADA.
Cardano sentiment neutral with slight bullish bias
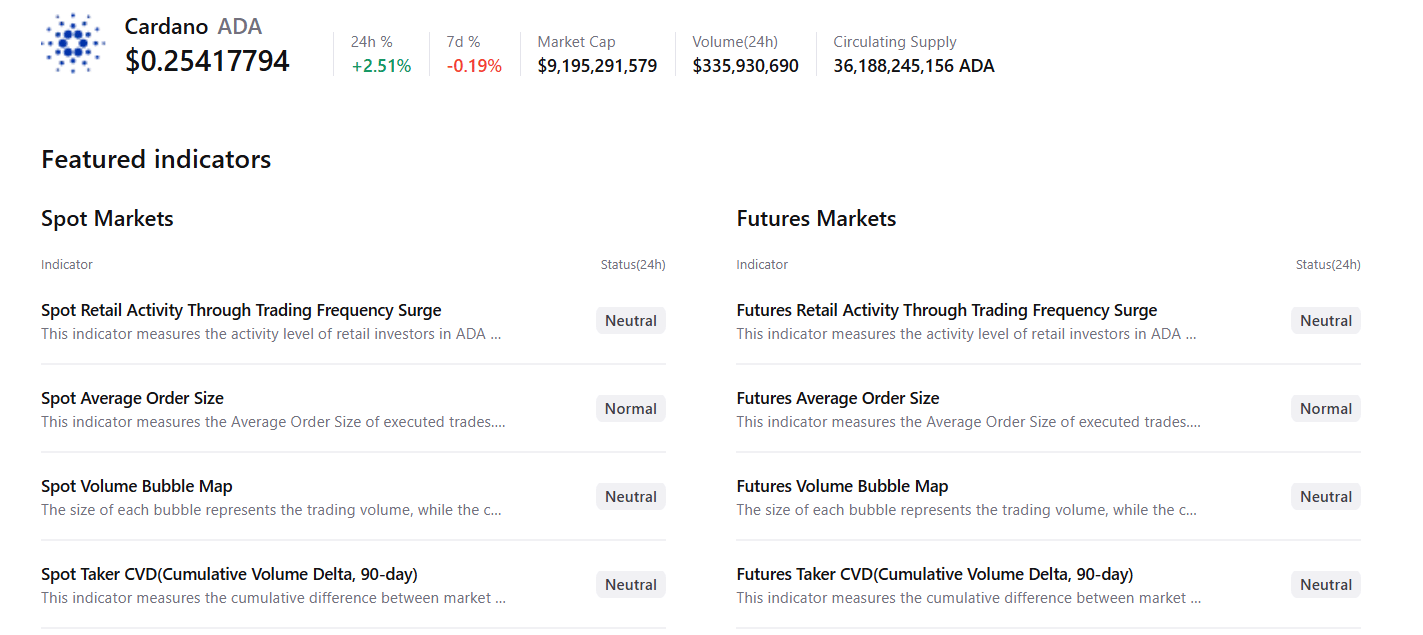
CryptoQuant’s summary data for Cardano shows neutral conditions among spot and futures traders, as shown below, suggesting a lack of strong directional conviction.
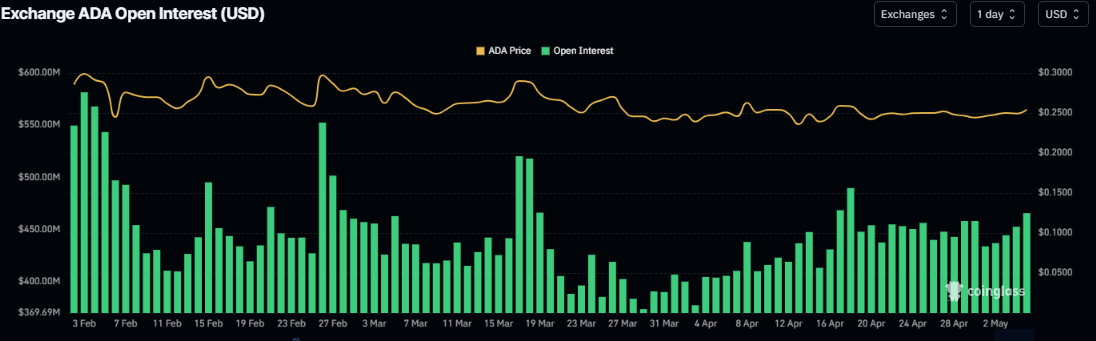
On the derivatives side, metrics support a mild bullish bias. CoinGlass’ Open Interest (OI) for ADA rose to $465.52 million on Monday, from $433.60 million on Friday, and has steadily increased since then. This steady increase in OI reflects growing participation and fresh capital entering the market, suggesting a potential upside in ADA.
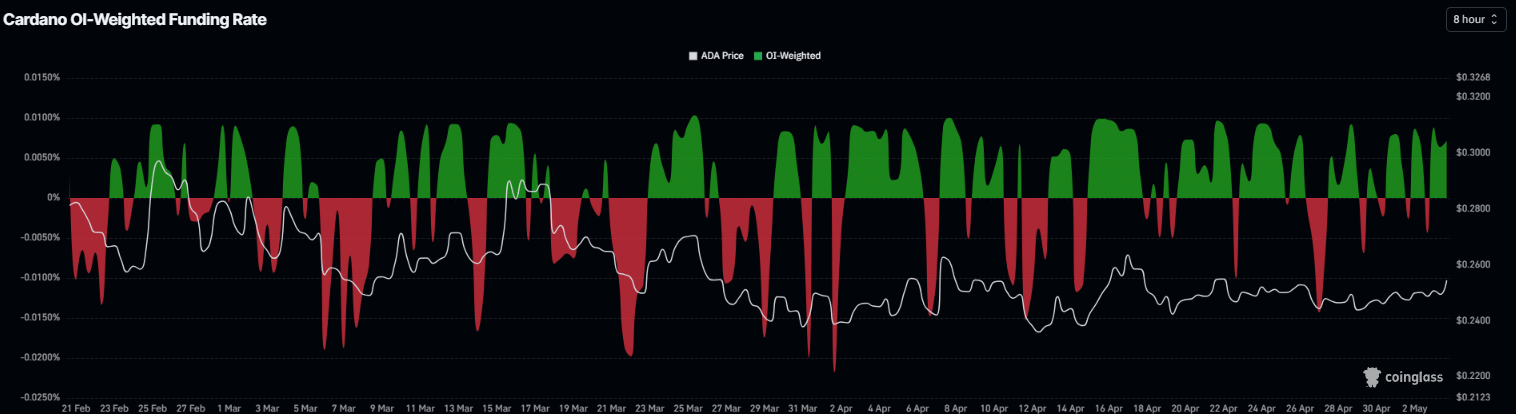
Meanwhile, the funding rates also support improving sentiment. CoinGlass’ OI-Weighted Funding Rate data for Cardano flipped positive on Sunday, reading 0.0072% on Monday. This positive rate indicates that longs are paying shorts and projecting a bullish sentiment.
Cardano Price Forecast: Momentum indicators fading bearish pressure
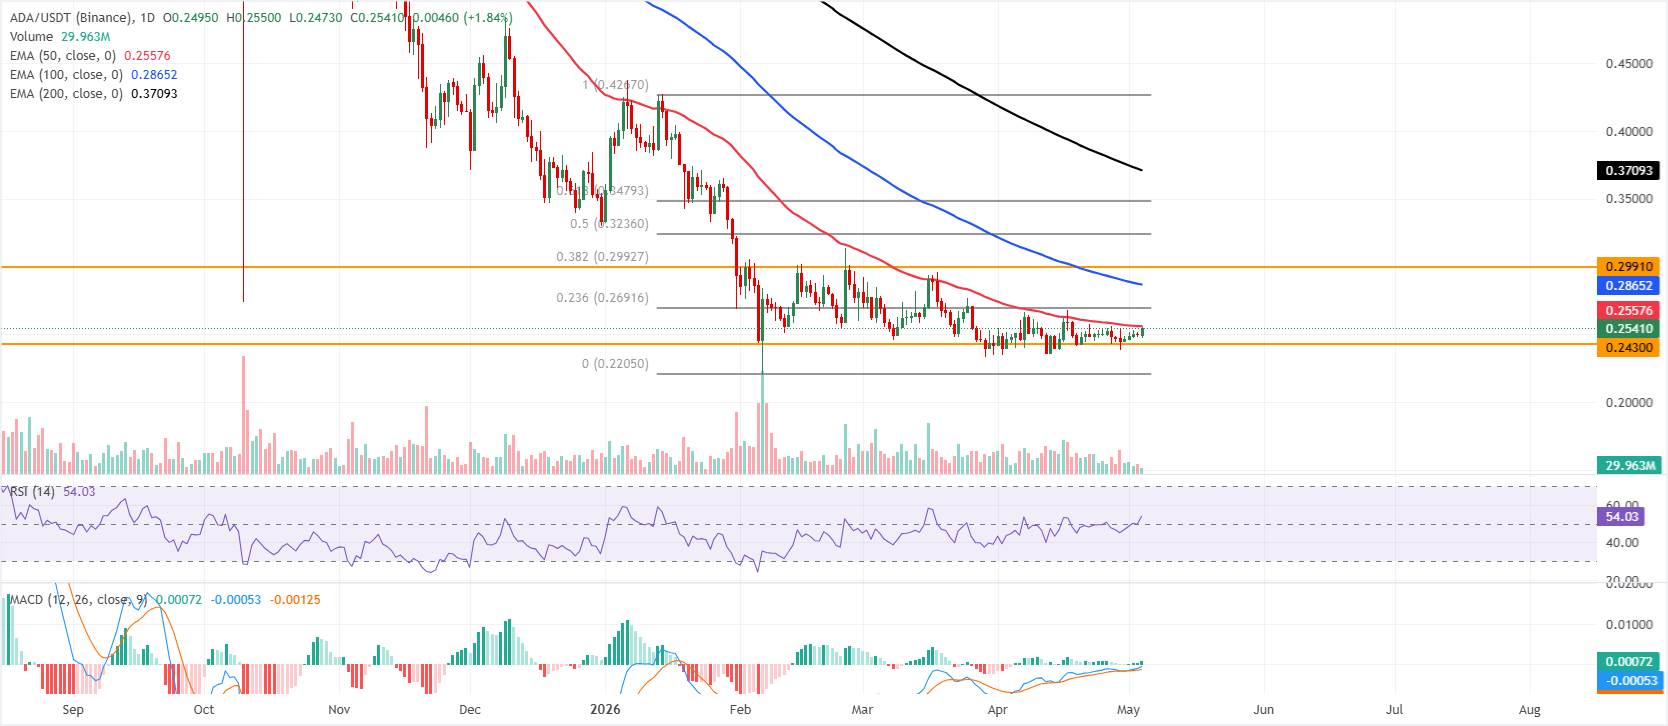
Cardano is trading at $0.253 on Monday, maintaining a neutral-to-slightly bearish near-term bias as price holds below the 50-day exponential moving average (EMA) at $0.255 and remains well below the 100-day and 200-day EMAs at $0.286 and $0.370. This configuration suggests rallies remain capped by layered overhead supply, even as the Relative Strength Index (RSI) at 54 drifts slightly above the midline, hinting at consolidative rather than impulsive downside. The Moving Average Convergence Divergence (MACD) line remains marginally above its signal line, with a small positive histogram, hinting at modest upside attempts but not negating the dominant overhead resistance.
On the topside, immediate resistance is seen at the 50-day EMA near $0.255, with further obstacles at the 23.6% Fibonacci retracement of the latest downswing at $0.269 and the 100-day EMA at $0.286. Higher up, a dense barrier emerges around $0.299, where a horizontal resistance at $0.299 aligns with the 38.2% Fibonacci level at $0.299, ahead of deeper retracement hurdles at $0.323 and $0.347 and the 200-day EMA at $0.370.
On the downside, initial support is at the $0.243 horizontal level; a decisive break below this floor would open the way for a continuation of the broader bearish phase.
(The technical analysis of this story was written with the help of an AI tool.)

100만 명이 넘는 사용자가 FXStreet를 통해 실시간 시장 데이터, 차트 도구, 전문가 인사이트, 포렉스 뉴스를 이용합니다. 포괄적인 경제 캘린더와 교육 웨비나는 트레이더가 정보를 유지하고 신중한 결정을 내리도록 돕습니다. FXStreet는 바르셀로나 본사와 전 세계 지역에 걸쳐 약 60명의 팀으로 구성되어 있습니다.
더 읽기


