
Cardano Price Forecast: Consolidation near support as bearish momentum eases
작성자 Manish Chhetri
수정됨: 1 Jul 2026


인기 기사

Cardano (ADA) trades around $0.146 on Wednesday, stabilizing after a sharp correction as selling pressure eases. Weakening derivatives metrics indicate traders remain cautious, while fading bearish momentum indicators suggest a potential recovery for ADA.
- Cardano price consolidates around $0.146 on Wednesday after a recent sell-off.
- Weakening derivatives activity, with declining open interest and rising short positions, continues to support a cautious near-term outlook.
- The technical outlook shows bearish momentum is fading, raising the possibility of a potential recovery.
Cardano (ADA) trades around $0.146 on Wednesday, stabilizing after a sharp correction as selling pressure eases. Weakening derivatives metrics indicate traders remain cautious, while fading bearish momentum indicators suggest a potential recovery for ADA.
Derivatives traders remain cautious
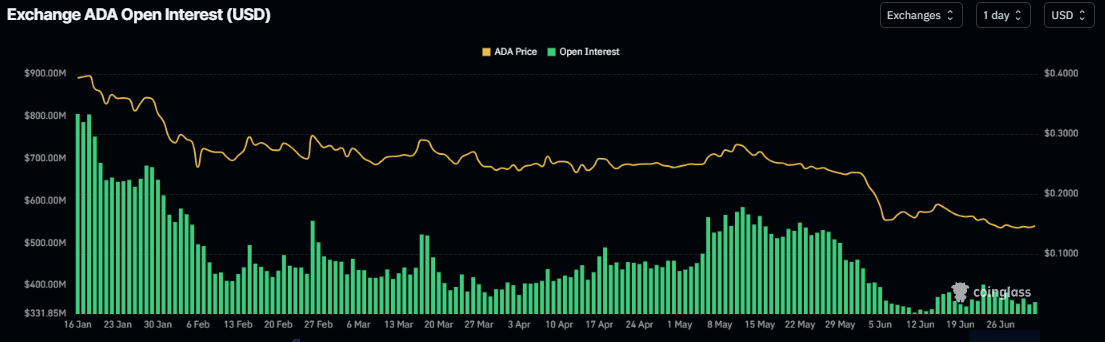
Cardano’s derivatives metrics support a negative outlook. ADA’s futures Open Interest (OI) dropped to $360 million on Wednesday after a mild rise in mid-May but has been continuously falling since mid-January. This drop in OI reflects waning investor participation and projects a bearish outlook.
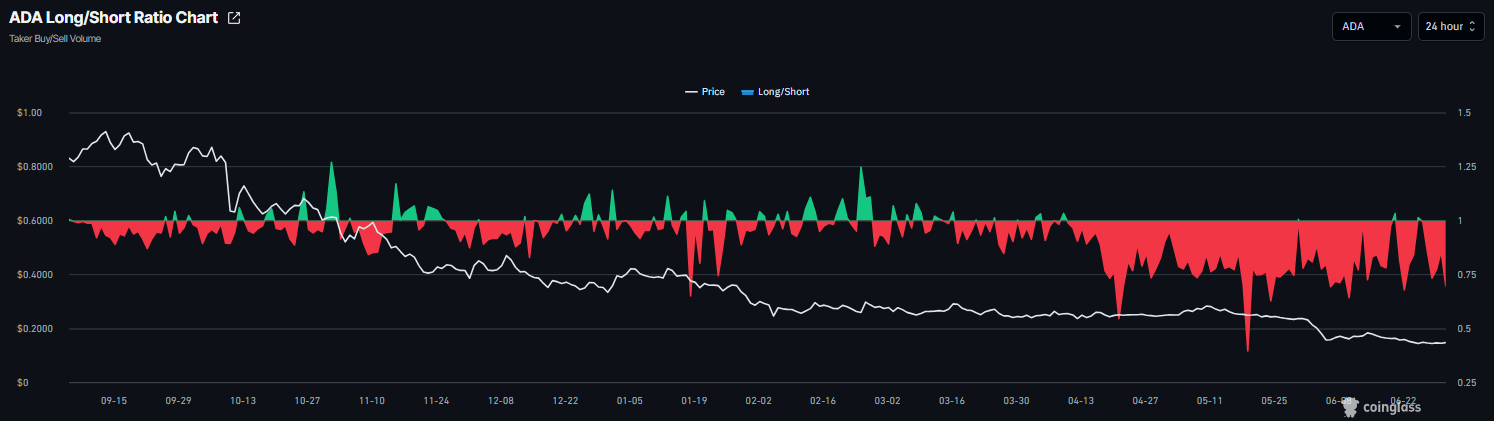
In addition, CoinGlass’ long-to-short ratio for ADA reads 0.69 on Wednesday, nearing its lowest level in over a month. This ratio, being below one, reflects bearish sentiment in the market, as more traders are betting on the asset’s price to fall.
Some signs of optimism
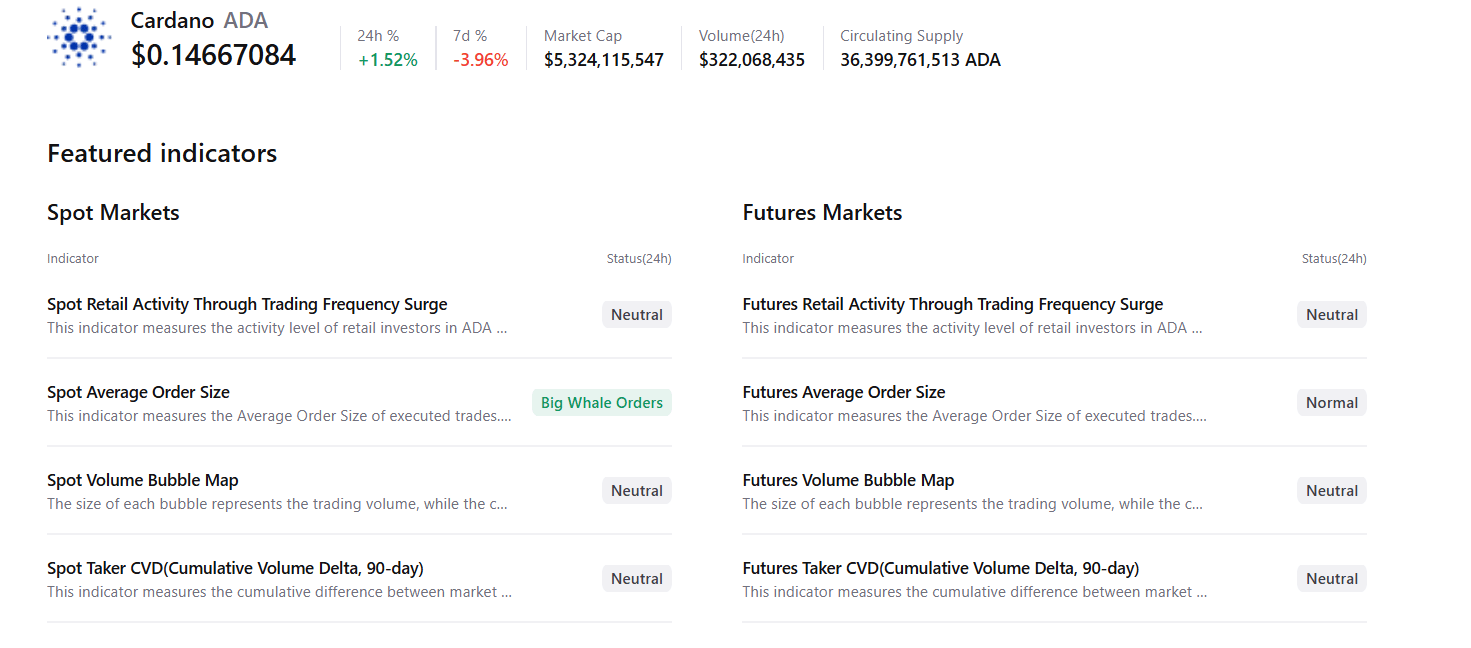
CryptoQuant’s summary data shows mild bullish sentiment. Cardano’s spot markets show large whale orders amid neutral conditions across other metrics, supporting a potential recovery.
Cardano Price Forecast: Fading bearish momentum
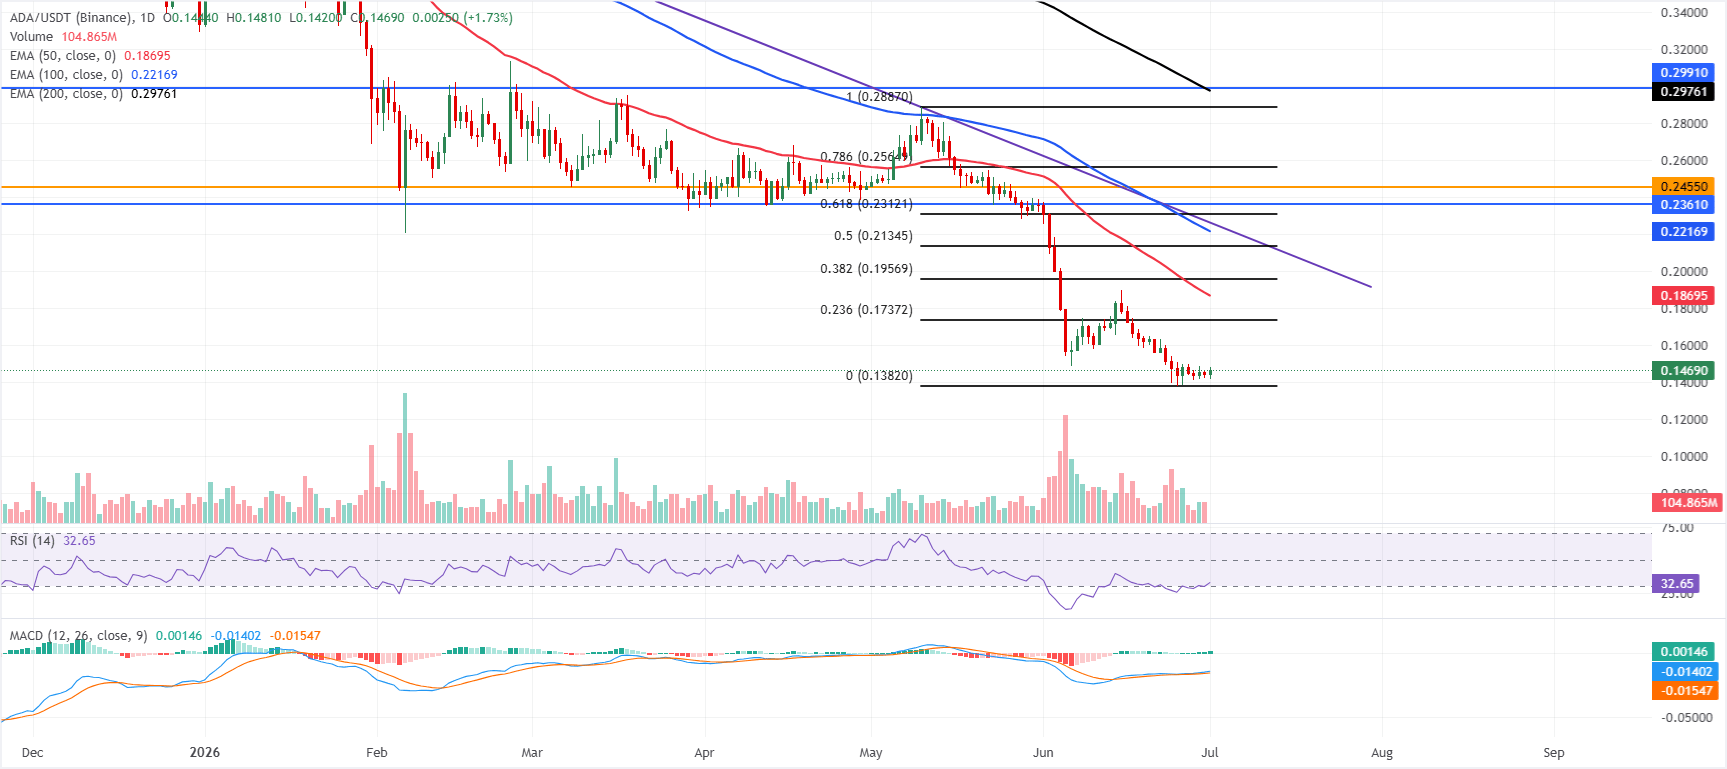
Cardano price trades at $0.146 on Wednesday, consolidating after a recent correction. However, ADA maintains a long-term bearish bias, with price holding well below the 50-day, 100-day, and 200-day Exponential Moving Averages (EMAs) at roughly $0.187, $0.221, and $0.297.
The Relative Strength Index (RSI) has stabilized near 33, and the Moving Average Convergence Divergence (MACD) line remains slightly positive, hinting at tentative downside fatigue but not yet altering the overarching downward structure.
On the topside, initial resistance is seen at the 23.6% Fibonacci retracement near $0.173, ahead of the 50-day EMA around $0.187 and the 38.2% Fibonacci retracement close to $0.1957. Further up, the 50% retracement level at $0.213, the 100-day EMA at $0.221 and the downtrend resistance trendline’s break area near $0.226 form a broader supply band, followed by clustered barriers between the 61.8% Fibonacci retracement at $0.231, horizontal caps at $0.236 and $0.245, and the upper band defined by $0.256–$0.299 including the 78.6% Fibonacci retracement, the 200-day EMA around $0.2976 and overhead horizontal resistance.
On the downside, immediate support sits at the Fibonacci anchor at $0.1382; a clear break below this floor would expose fresh lows in the broader downtrend.
(The technical analysis of this story was written with the help of an AI tool.)

100만 명이 넘는 사용자가 FXStreet를 통해 실시간 시장 데이터, 차트 도구, 전문가 인사이트, 포렉스 뉴스를 이용합니다. 포괄적인 경제 캘린더와 교육 웨비나는 트레이더가 정보를 유지하고 신중한 결정을 내리도록 돕습니다. FXStreet는 바르셀로나 본사와 전 세계 지역에 걸쳐 약 60명의 팀으로 구성되어 있습니다.
더 읽기


