
Cardano Price Forecast: On-chain data signals risk of deeper correction
작성자 Manish Chhetri
수정됨: 15 Apr 2026


인기 기사

Cardano (ADA) is trading below $0.240 on Wednesday, down nearly 4% after a rejection at the key resistance level the previous day.
- Cardano price trades in red on Wednesday after being rejected from the key resistance zone the previous day.
- On-chain data shows dormant wallets are moving alongside the NPL indicator, which shows a negative spike, hinting that early holders could be offloading ADA tokens.
- The technical outlook suggests deeper losses, as momentum indicators signal a bearish bias.
Cardano (ADA) is trading below $0.240 on Wednesday, down nearly 4% after a rejection at the key resistance level the previous day. On-chain metrics point to a bearish outlook, as a surge in dormant wallet activity and a negative spike in the Network Realized Profit/Loss (NPL) indicator suggest early investors may be offloading tokens, increasing the likelihood of a deeper correction in the near term.
Signs of concern
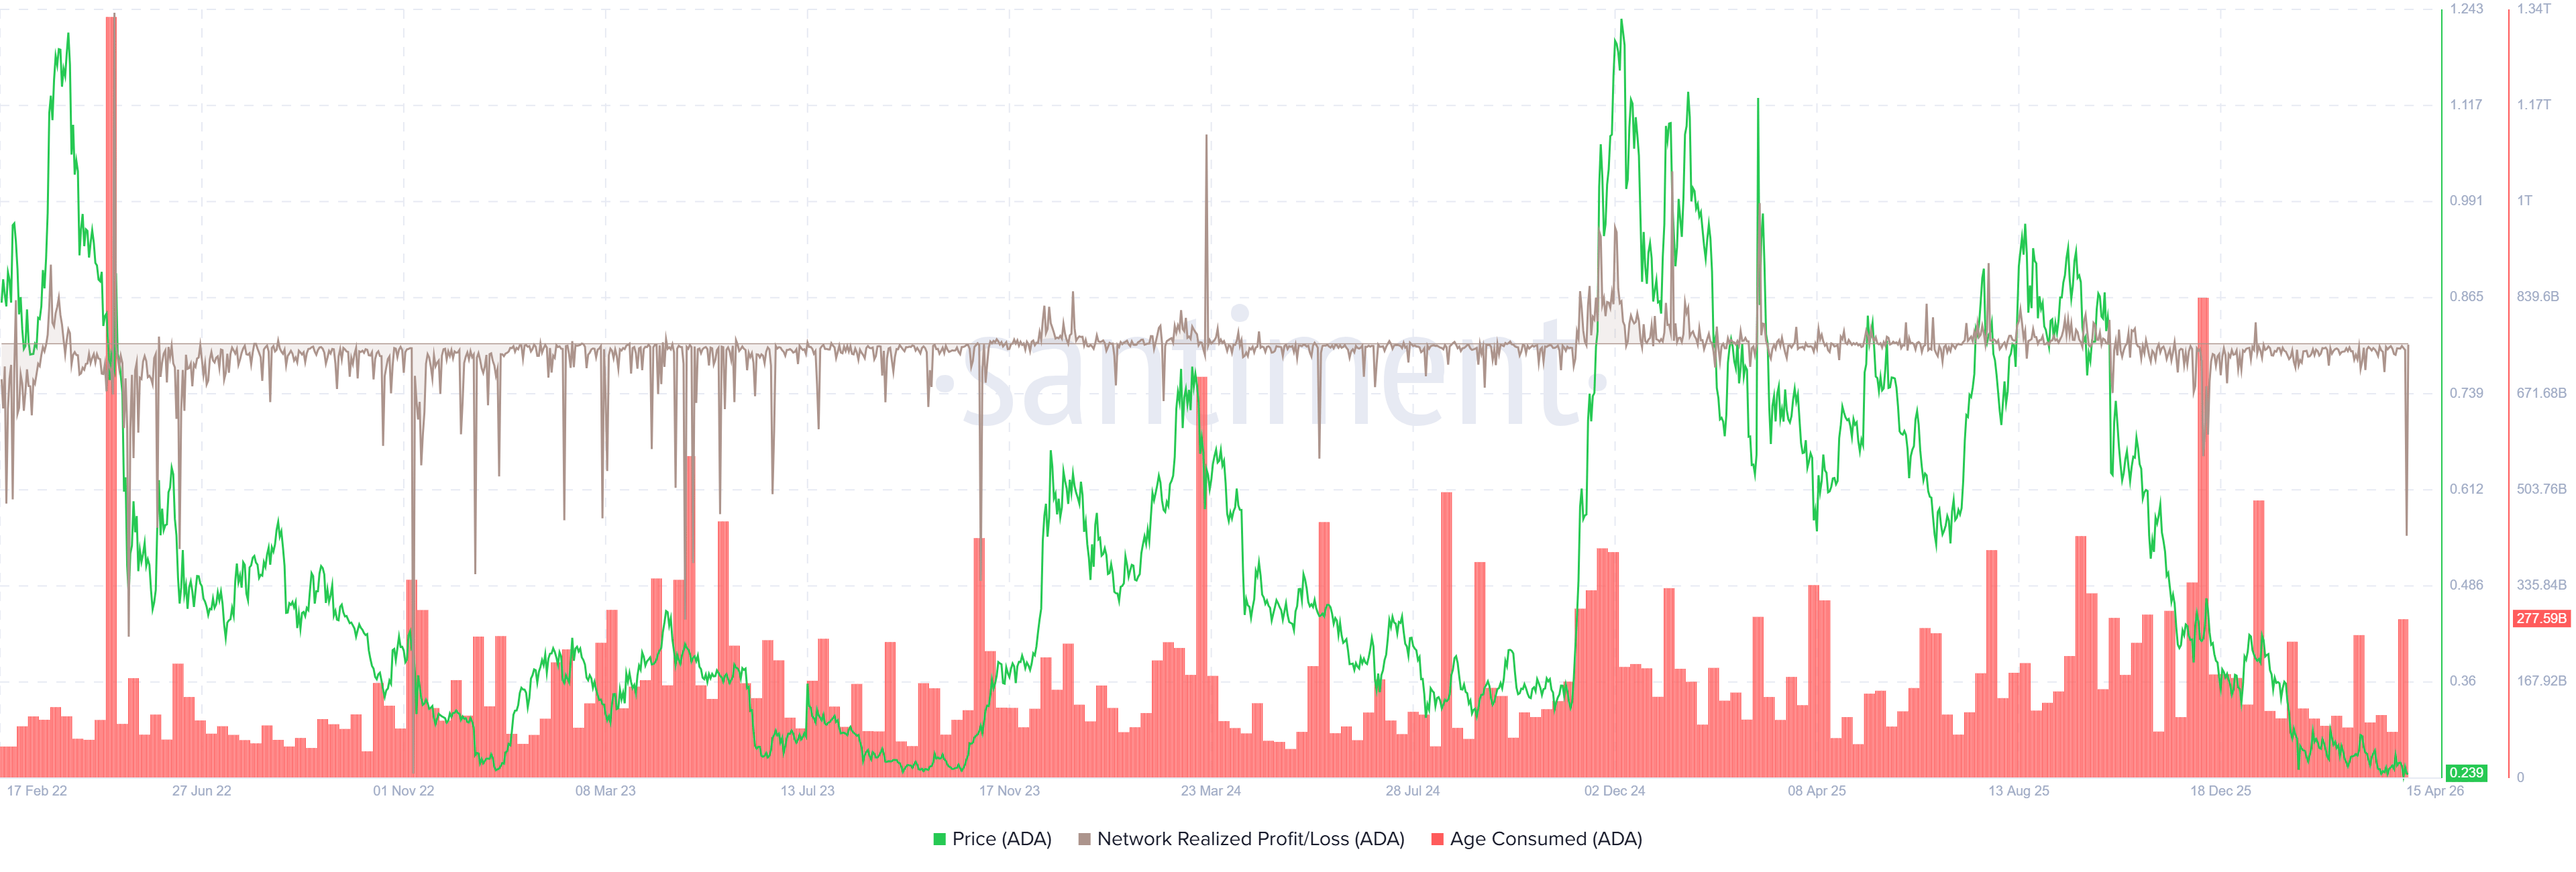
Santiment data indicates signs of concern for Cardano. The chart below shows that Santiment's Network Realized Profit/Loss (NPL) indicator computes a daily network-level Return On Investment (ROI) based on the coin's on-chain transaction volume, which measures market pain. Strong spikes in a coin's NPL indicate that its holders are, on average, selling their bags at a significant profit. On the other hand, strong dips imply that the coin's holders are, on average, realizing losses, suggesting panic sell-offs and investor capitulation. The metric shows a massive dip on Tuesday, indicating that holders, on average, were realizing losses.
During the same period, the Santiment’s Age Consumed index also showed an upward spike, suggesting dormant tokens (tokens stored in wallets for a long time) are in motion.
Historically, a surge in dormant wallet activity combined with a negative spike in the NPL indicator has often triggered sell-offs in Cardano. A similar pattern was observed in early December, followed by a sharp price correction in ADA, highlighting the risk of renewed downside pressure under current conditions.
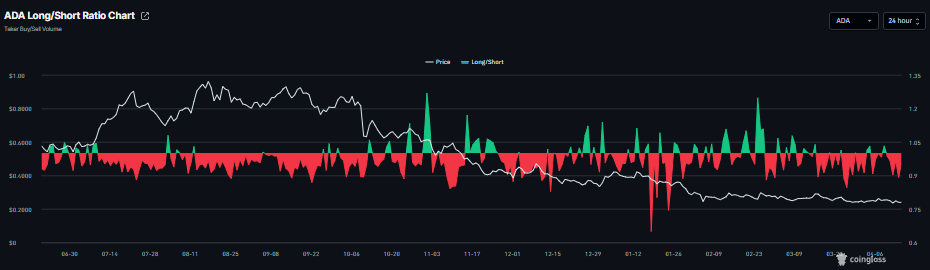
On the derivatives side, CoinGlass' long-to-short ratio reads 0.95 on Wednesday and has been mostly negative since mid-March. A ratio below one indicates bearish sentiment in the market, as traders are betting that the asset price will fall.
Cardano Price Forecast: Price action supports a deeper correction
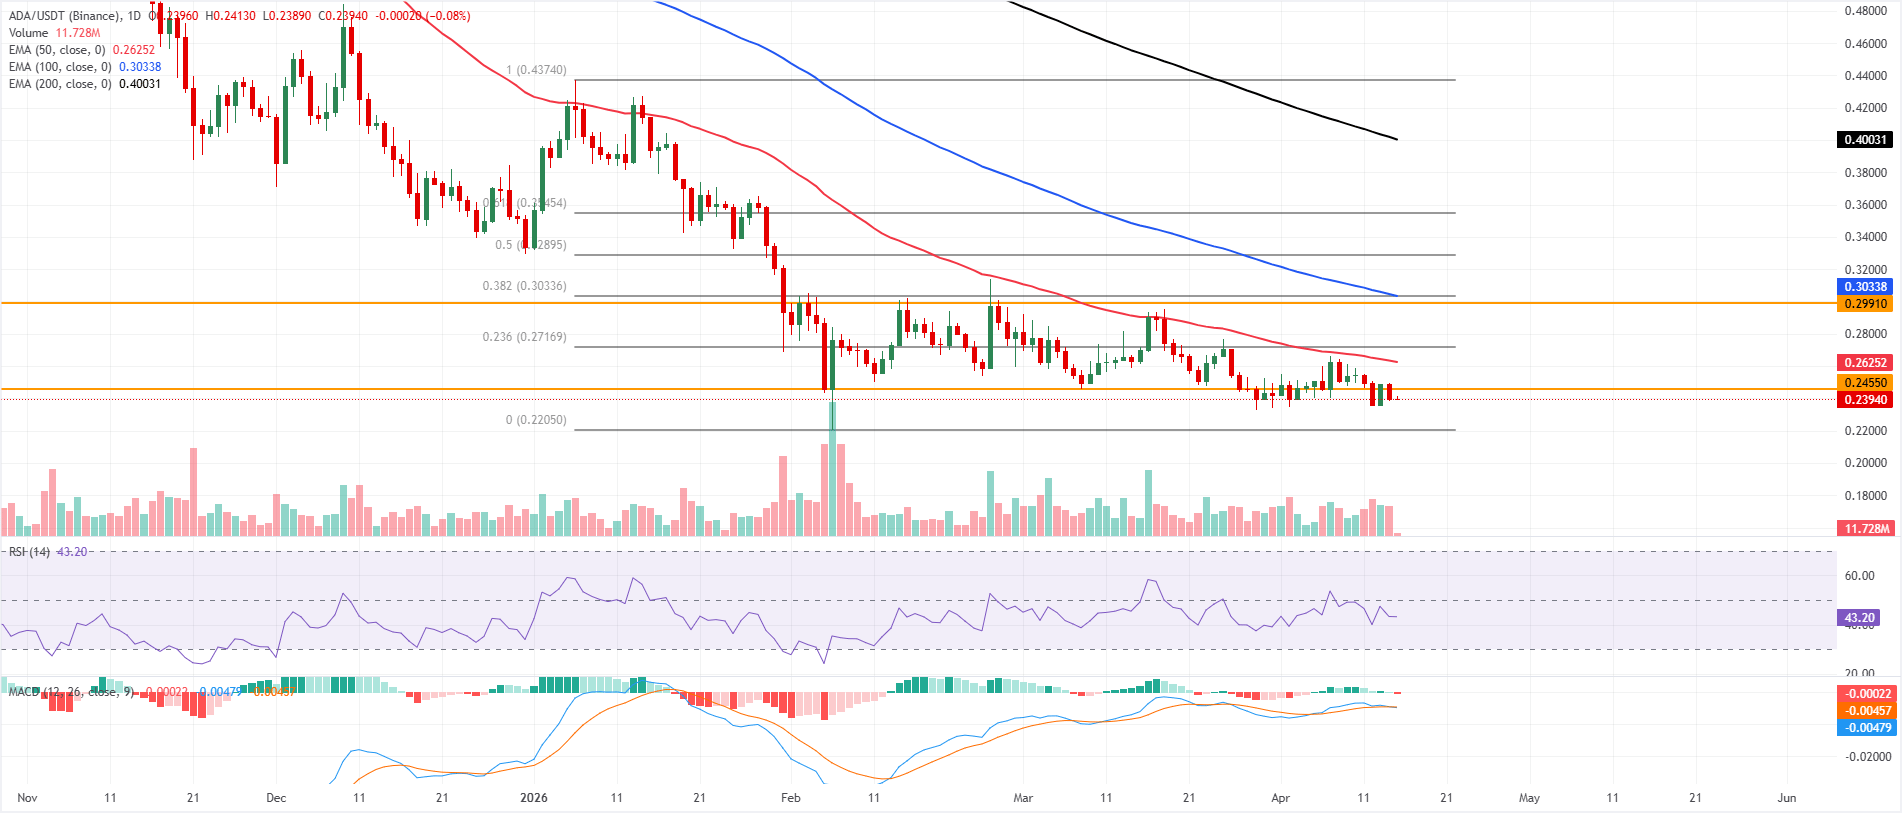
Cardano is trading at $0.239 on Wednesday, maintaining a bearish near-term bias as it holds well below the 50-day, 100-day, and 200-day Exponential Moving Averages (EMAs). ADA remains capped first by the nearby horizontal barrier at $0.245, with the 50-day EMA at $0.262 and the 23.6% Fibonacci retracement of the latest downswing at $0.271 layering additional overhead supply.
A subdued Relative Strength Index (RSI) on the daily chart is around 43, and a slightly negative Moving Average Convergence Divergence (MACD) reading suggests that upside momentum is weak and rallies are likely to face selling pressure at these resistance levels.
On the topside, a daily close above $0.245 would be the first sign of relief, exposing the 50-day EMA at $0.262 and the 23.6% retracement at $0.271, ahead of a stronger congestion zone around $0.299 and the $0.303 area where the 38.2% Fibonacci retracement clusters with the 100-day EMA. Further up, the 50% and 61.8% retracements at $0.328 and $0.354, followed by the 78.6% level at $0.391 and the distant 200-day EMA at $0.400, define progressively stronger resistance on any sustained recovery.
On the downside, the only notable support is the Fibonacci anchor at $0.220, where buyers would be expected to defend the latest cycle low if the decline extends.
(The technical analysis of this story was written with the help of an AI tool.)

100만 명이 넘는 사용자가 FXStreet를 통해 실시간 시장 데이터, 차트 도구, 전문가 인사이트, 포렉스 뉴스를 이용합니다. 포괄적인 경제 캘린더와 교육 웨비나는 트레이더가 정보를 유지하고 신중한 결정을 내리도록 돕습니다. FXStreet는 바르셀로나 본사와 전 세계 지역에 걸쳐 약 60명의 팀으로 구성되어 있습니다.
더 읽기


