
Cardano Price Forecast: Whale accumulation, bullish derivatives fuel recovery
작성자 Manish Chhetri
수정됨: 3 Jul 2026


인기 기사

Cardano (ADA) extends its recovery, trading above $0.160 on Friday, up over 15% so far this week. The recovery is supported by whale wallets accumulating ADA tokens during recent price dips.
- Cardano extends gains on Friday after recovering over 15% so far this week.
- Santiment data shows that whales have been accumulating during recent price dips.
- Rising open interest, positive funding rates and improving momentum indicators support further gains.
Cardano (ADA) extends its recovery, trading above $0.160 on Friday, up over 15% so far this week. The recovery is supported by whale wallets accumulating ADA tokens during recent price dips. In addition, strengthening derivatives metrics and a constructive technical outlook suggest further gains for ADA in the coming days.
Whales buy ADA dips
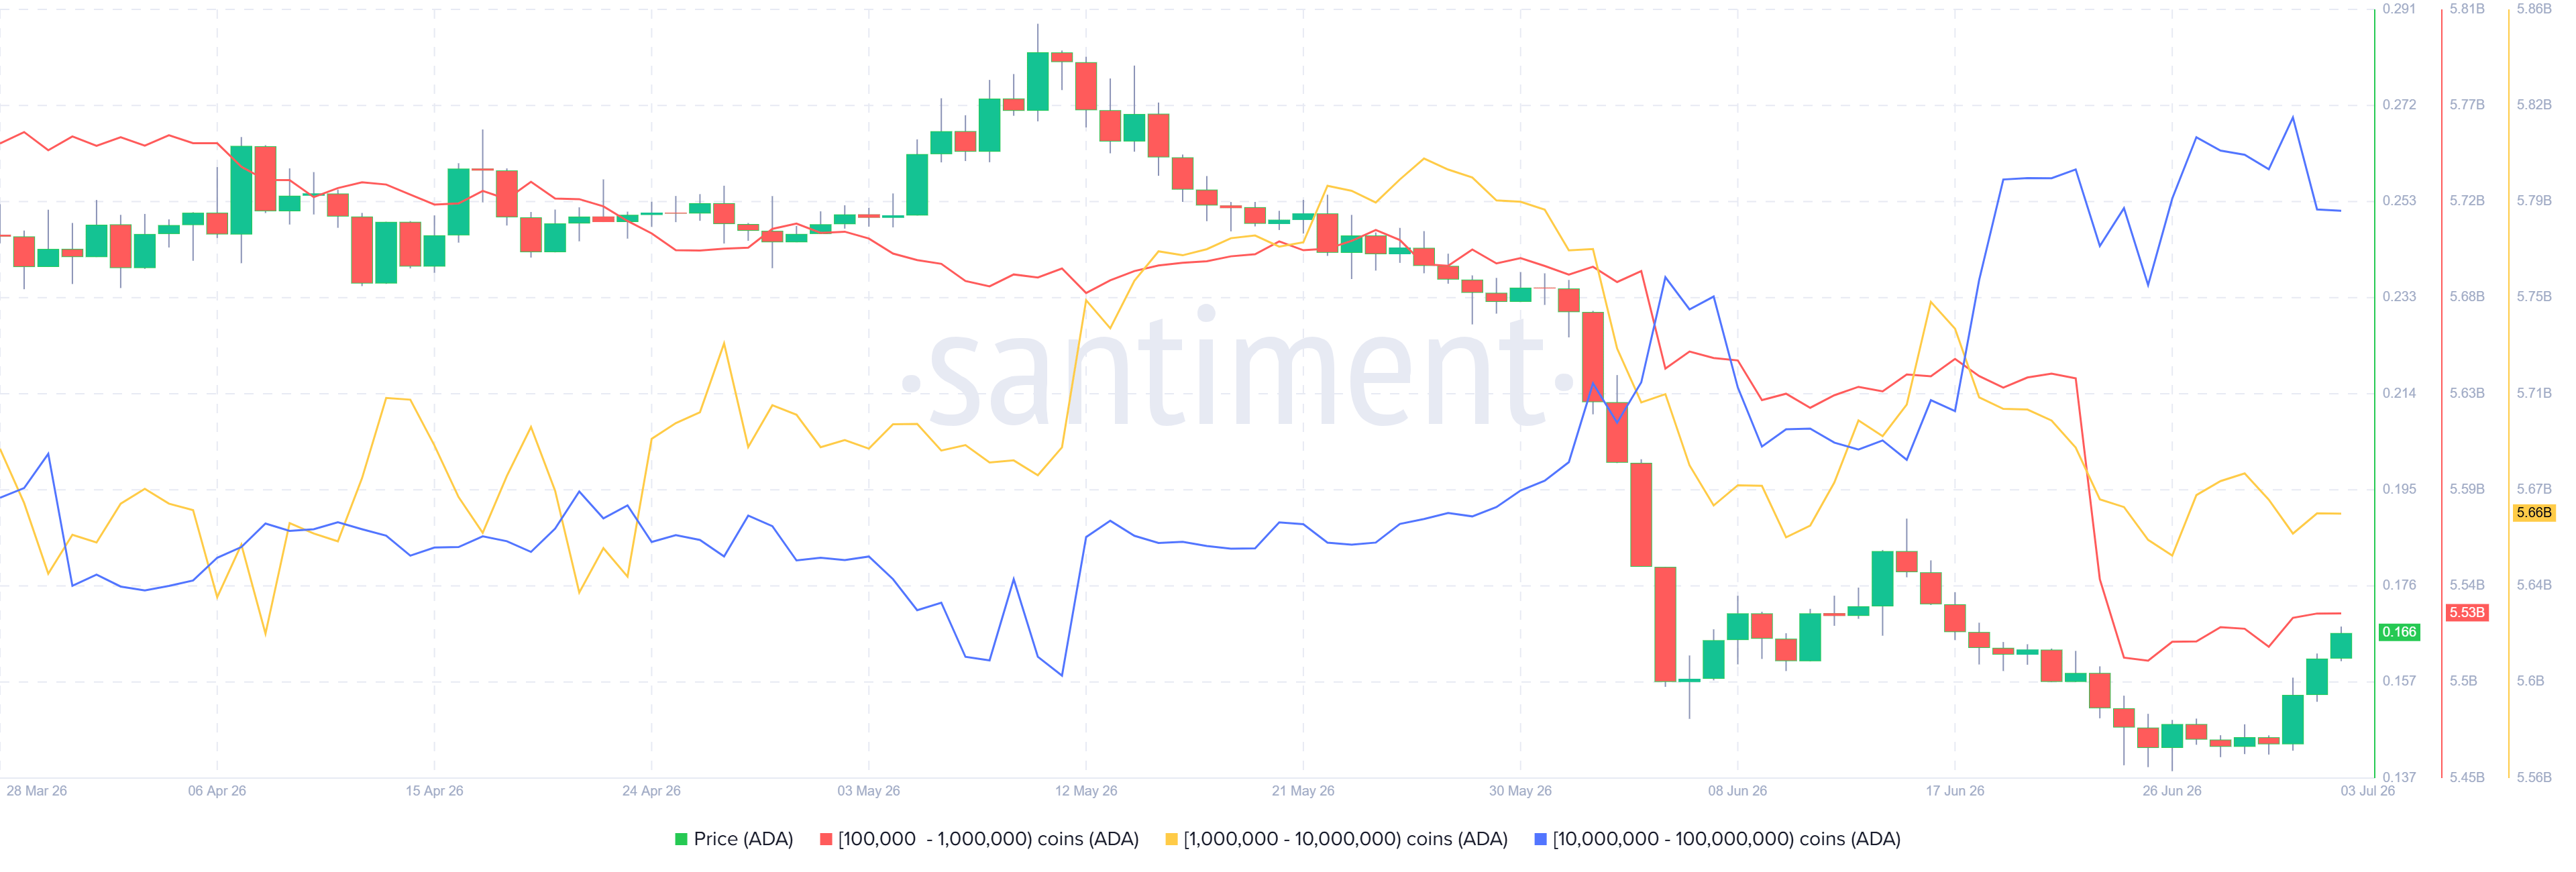
Santiment’s Supply Distribution data shows that large-wallet holders (whales) are buying ADA during its recent price dips, a move that supports the positive outlook for the token.
The metric indicates that whales holding between 100,000 and 1 million ADA tokens (red line), 1 million and 10 million ADA tokens (yellow line), and 10 million and 100 million ADA tokens (blue line) have accumulated a total of 150 million ADA tokens since June 25. This buy-the-dip scenario signals continued long-term interest among large-wallet holders, which could act as a cushion and boost the short-term upside move.
Derivatives traders show a bullish bias
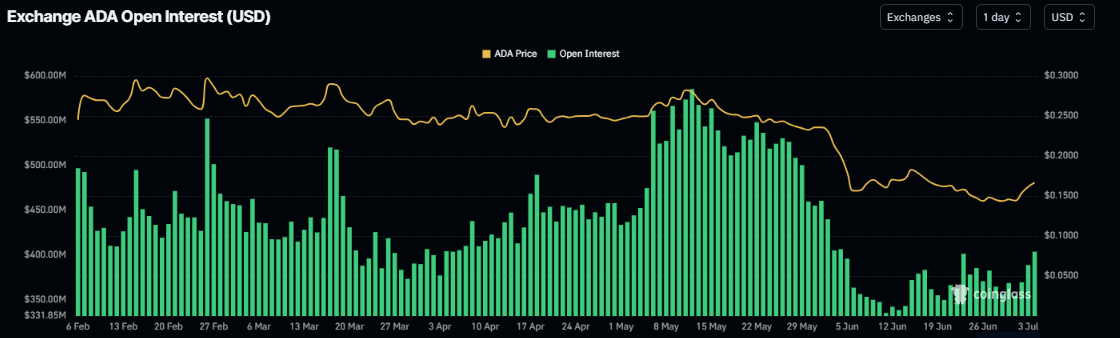
On the derivatives side, metrics further support a positive outlook for Cardano. ADA’s futures Open Interest (OI) surges to $403 million on Friday after falling to $335 million in mid-June. This rise in OI reflects increasing investor participation and projects a bullish outlook.
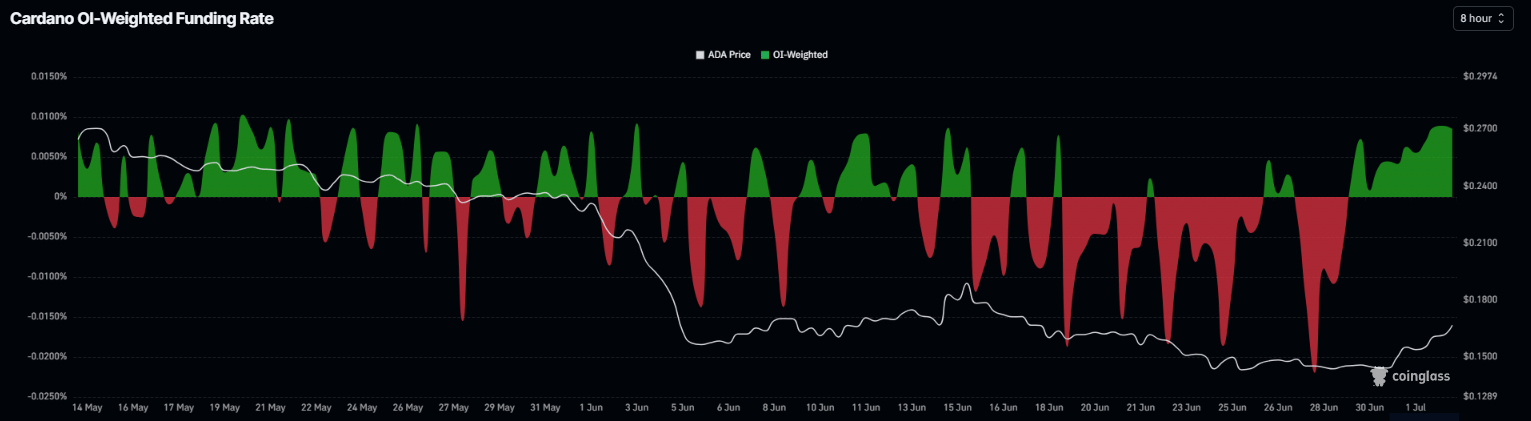
In addition, the funding rates data also shows improving sentiment. CoinGlass’ OI-Weighted Funding Rate data for ADA flipped positive on Monday and read 0.0085% on Friday. This positive rate indicates that longs are paying shorts and projecting a bullish sentiment.
Cardano Price Forecast: Extends recovery
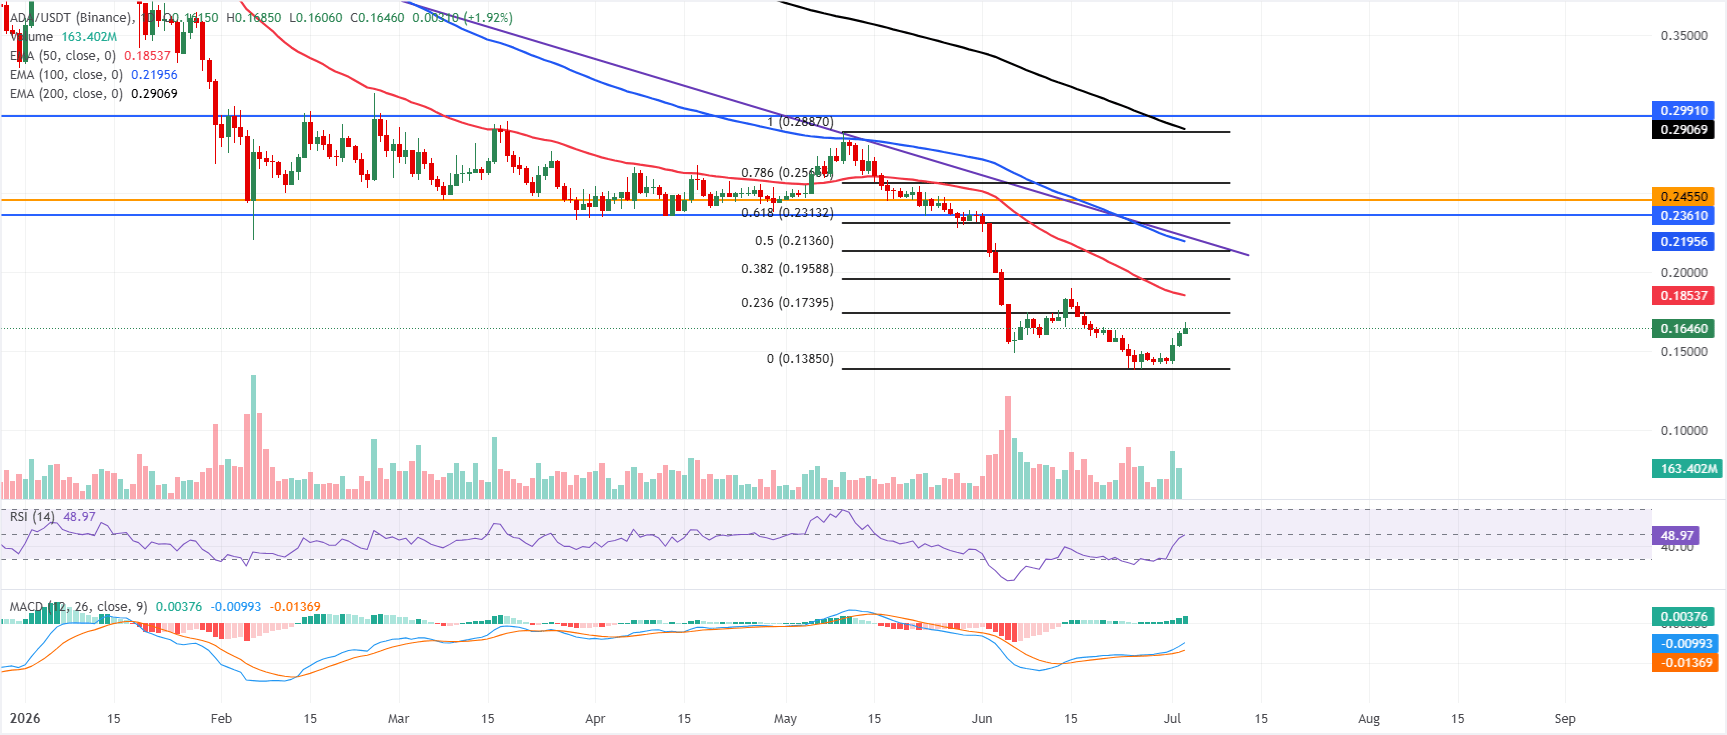
Cardano price trades above $0.160 on Friday, up over 15% so far this week. Despite this price recovery, ADA maintains a bearish tone, with price remaining well below the 50-day, 100-day, and 200-day Exponential Moving Averages (EMAs), clustered between roughly $0.190 and $0.290.
While the Relative Strength Index (RSI) hovers near the neutral 50 mark and the Moving Average Convergence Divergence (MACD) remains marginally above zero, hinting at stabilizing momentum, the pair remains structurally capped by a dense band of overhead resistance.
On the topside, initial resistance emerges at the 23.6% Fibonacci retracement at $0.173, ahead of the 50-day EMA near $0.185 and the 38.2% Fibonacci retracement at $0.195. Further up, the 50% retracement level at $0.213, the 100-day EMA at $0.219 and the downtrend trendline break zone around $0.222 form a broader supply region, reinforced by the 61.8% Fibonacci retracement level at $0.231 and horizontal barriers at $0.236 and $0.245.
On the downside, immediate focus is on the recent price area around $0.164, with stronger structural support only evident near the Fibonacci anchor around $0.138, where buyers could attempt to slow the decline.
(The technical analysis of this story was written with the help of an AI tool.)

100만 명이 넘는 사용자가 FXStreet를 통해 실시간 시장 데이터, 차트 도구, 전문가 인사이트, 포렉스 뉴스를 이용합니다. 포괄적인 경제 캘린더와 교육 웨비나는 트레이더가 정보를 유지하고 신중한 결정을 내리도록 돕습니다. FXStreet는 바르셀로나 본사와 전 세계 지역에 걸쳐 약 60명의 팀으로 구성되어 있습니다.
더 읽기


