
Chainlink Price Forecast: Renewed capital inflows support LINK’s mild recovery
작성자 Vishal Dixit
수정됨: 9 Jun 2026


인기 기사

Chainlink (LINK) price hovers near $8.00 at press time on Tuesday, reflecting a mild recovery after hitting a two-year low of $6.99 on Saturday.
- Chainlink hovers near $8 on Tuesday, holding steady after the 7% rebound on Sunday.
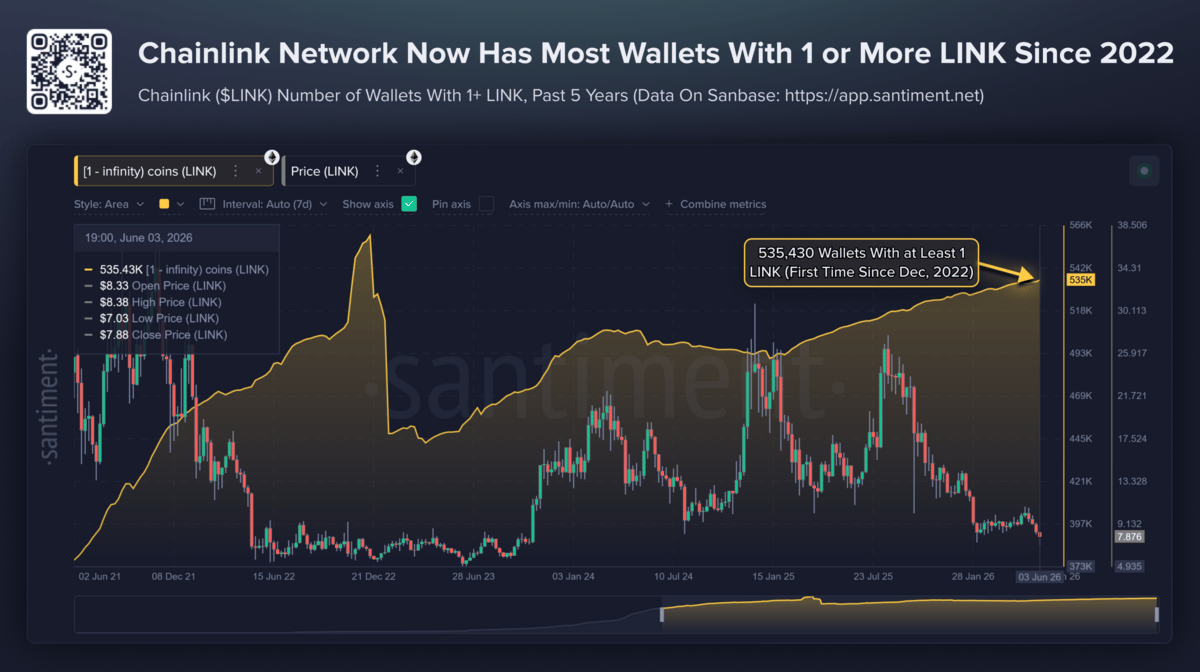
- The Chainlink ecosystem shows steady growth, with wallets holding at least 1 LINK reaching a three-year high.
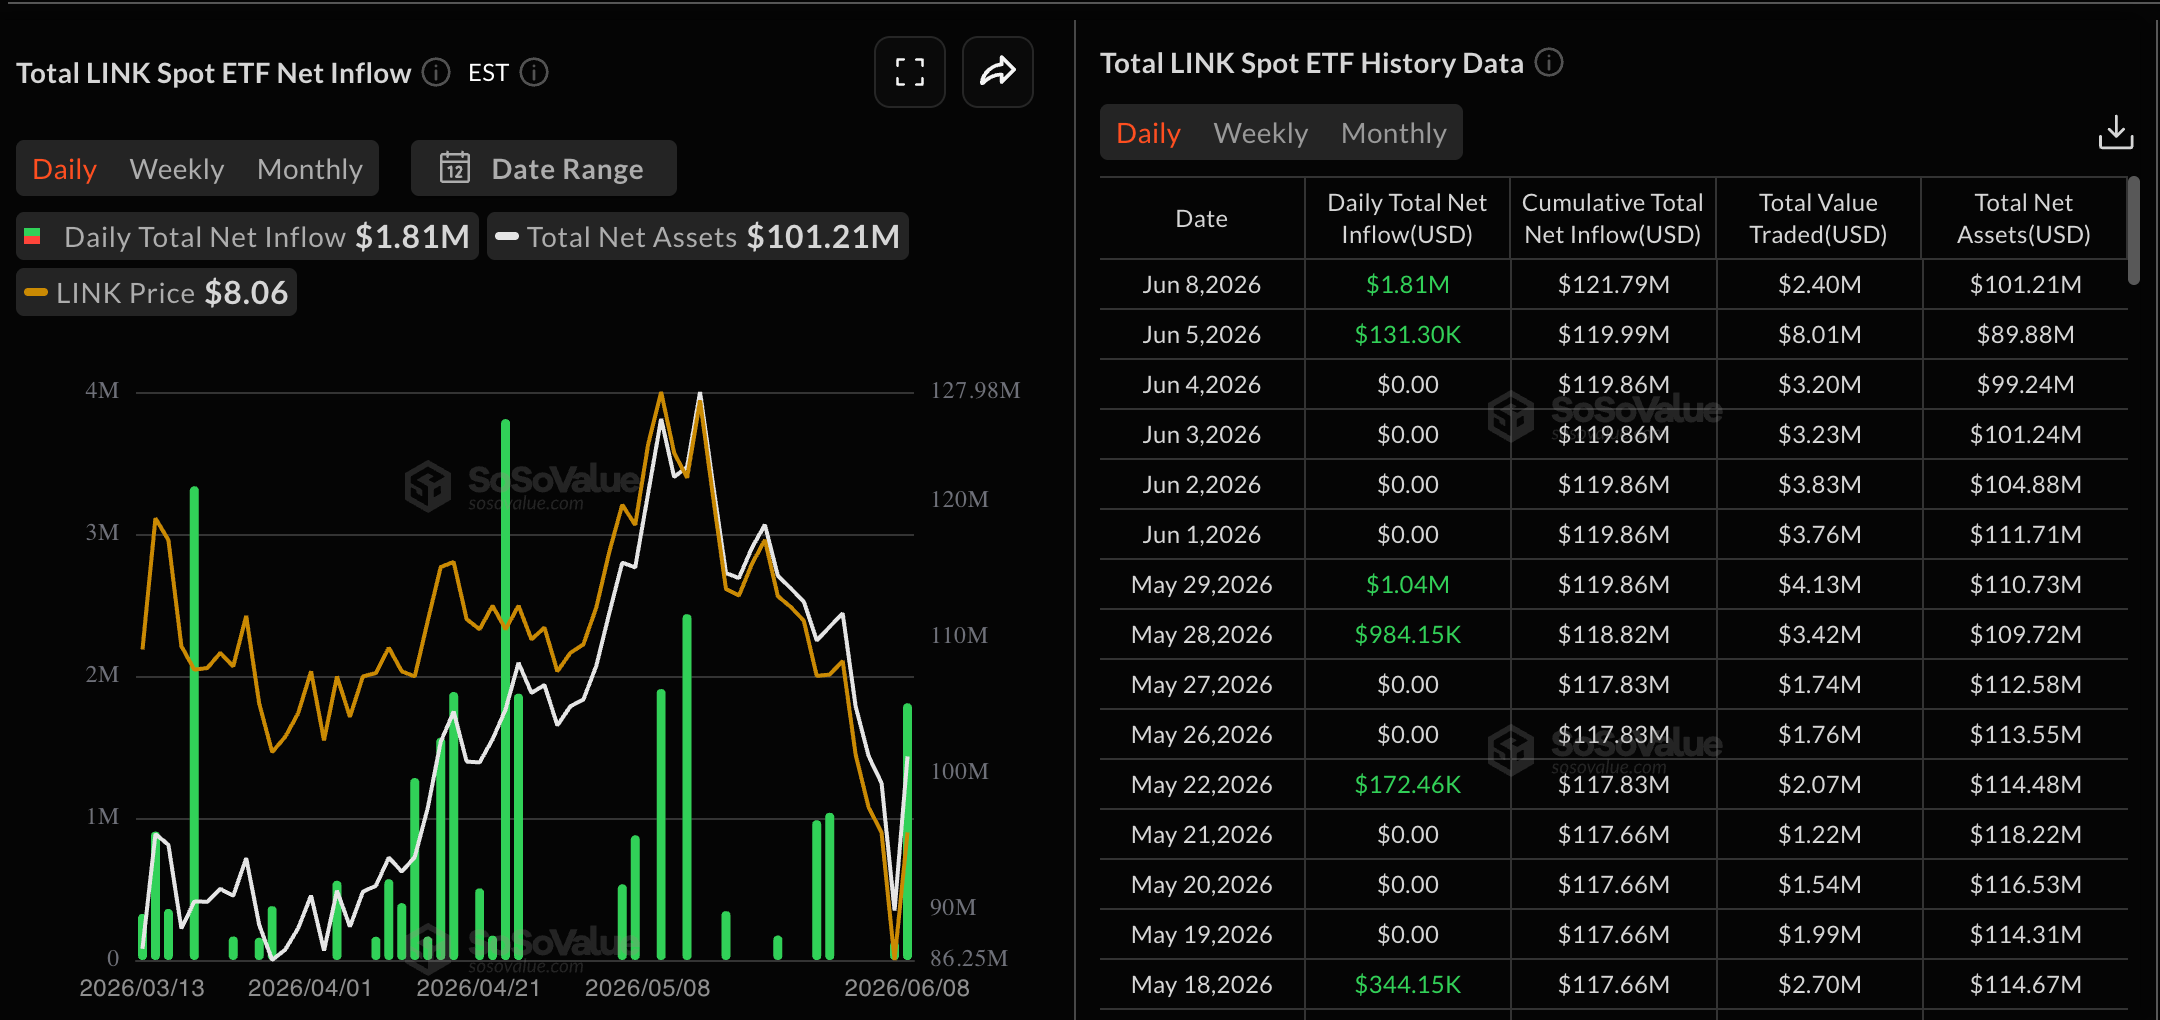
- LINK focused Exchange Traded Funds recorded $1.81 million in inflows, extending the streak of institutional inflows since December.
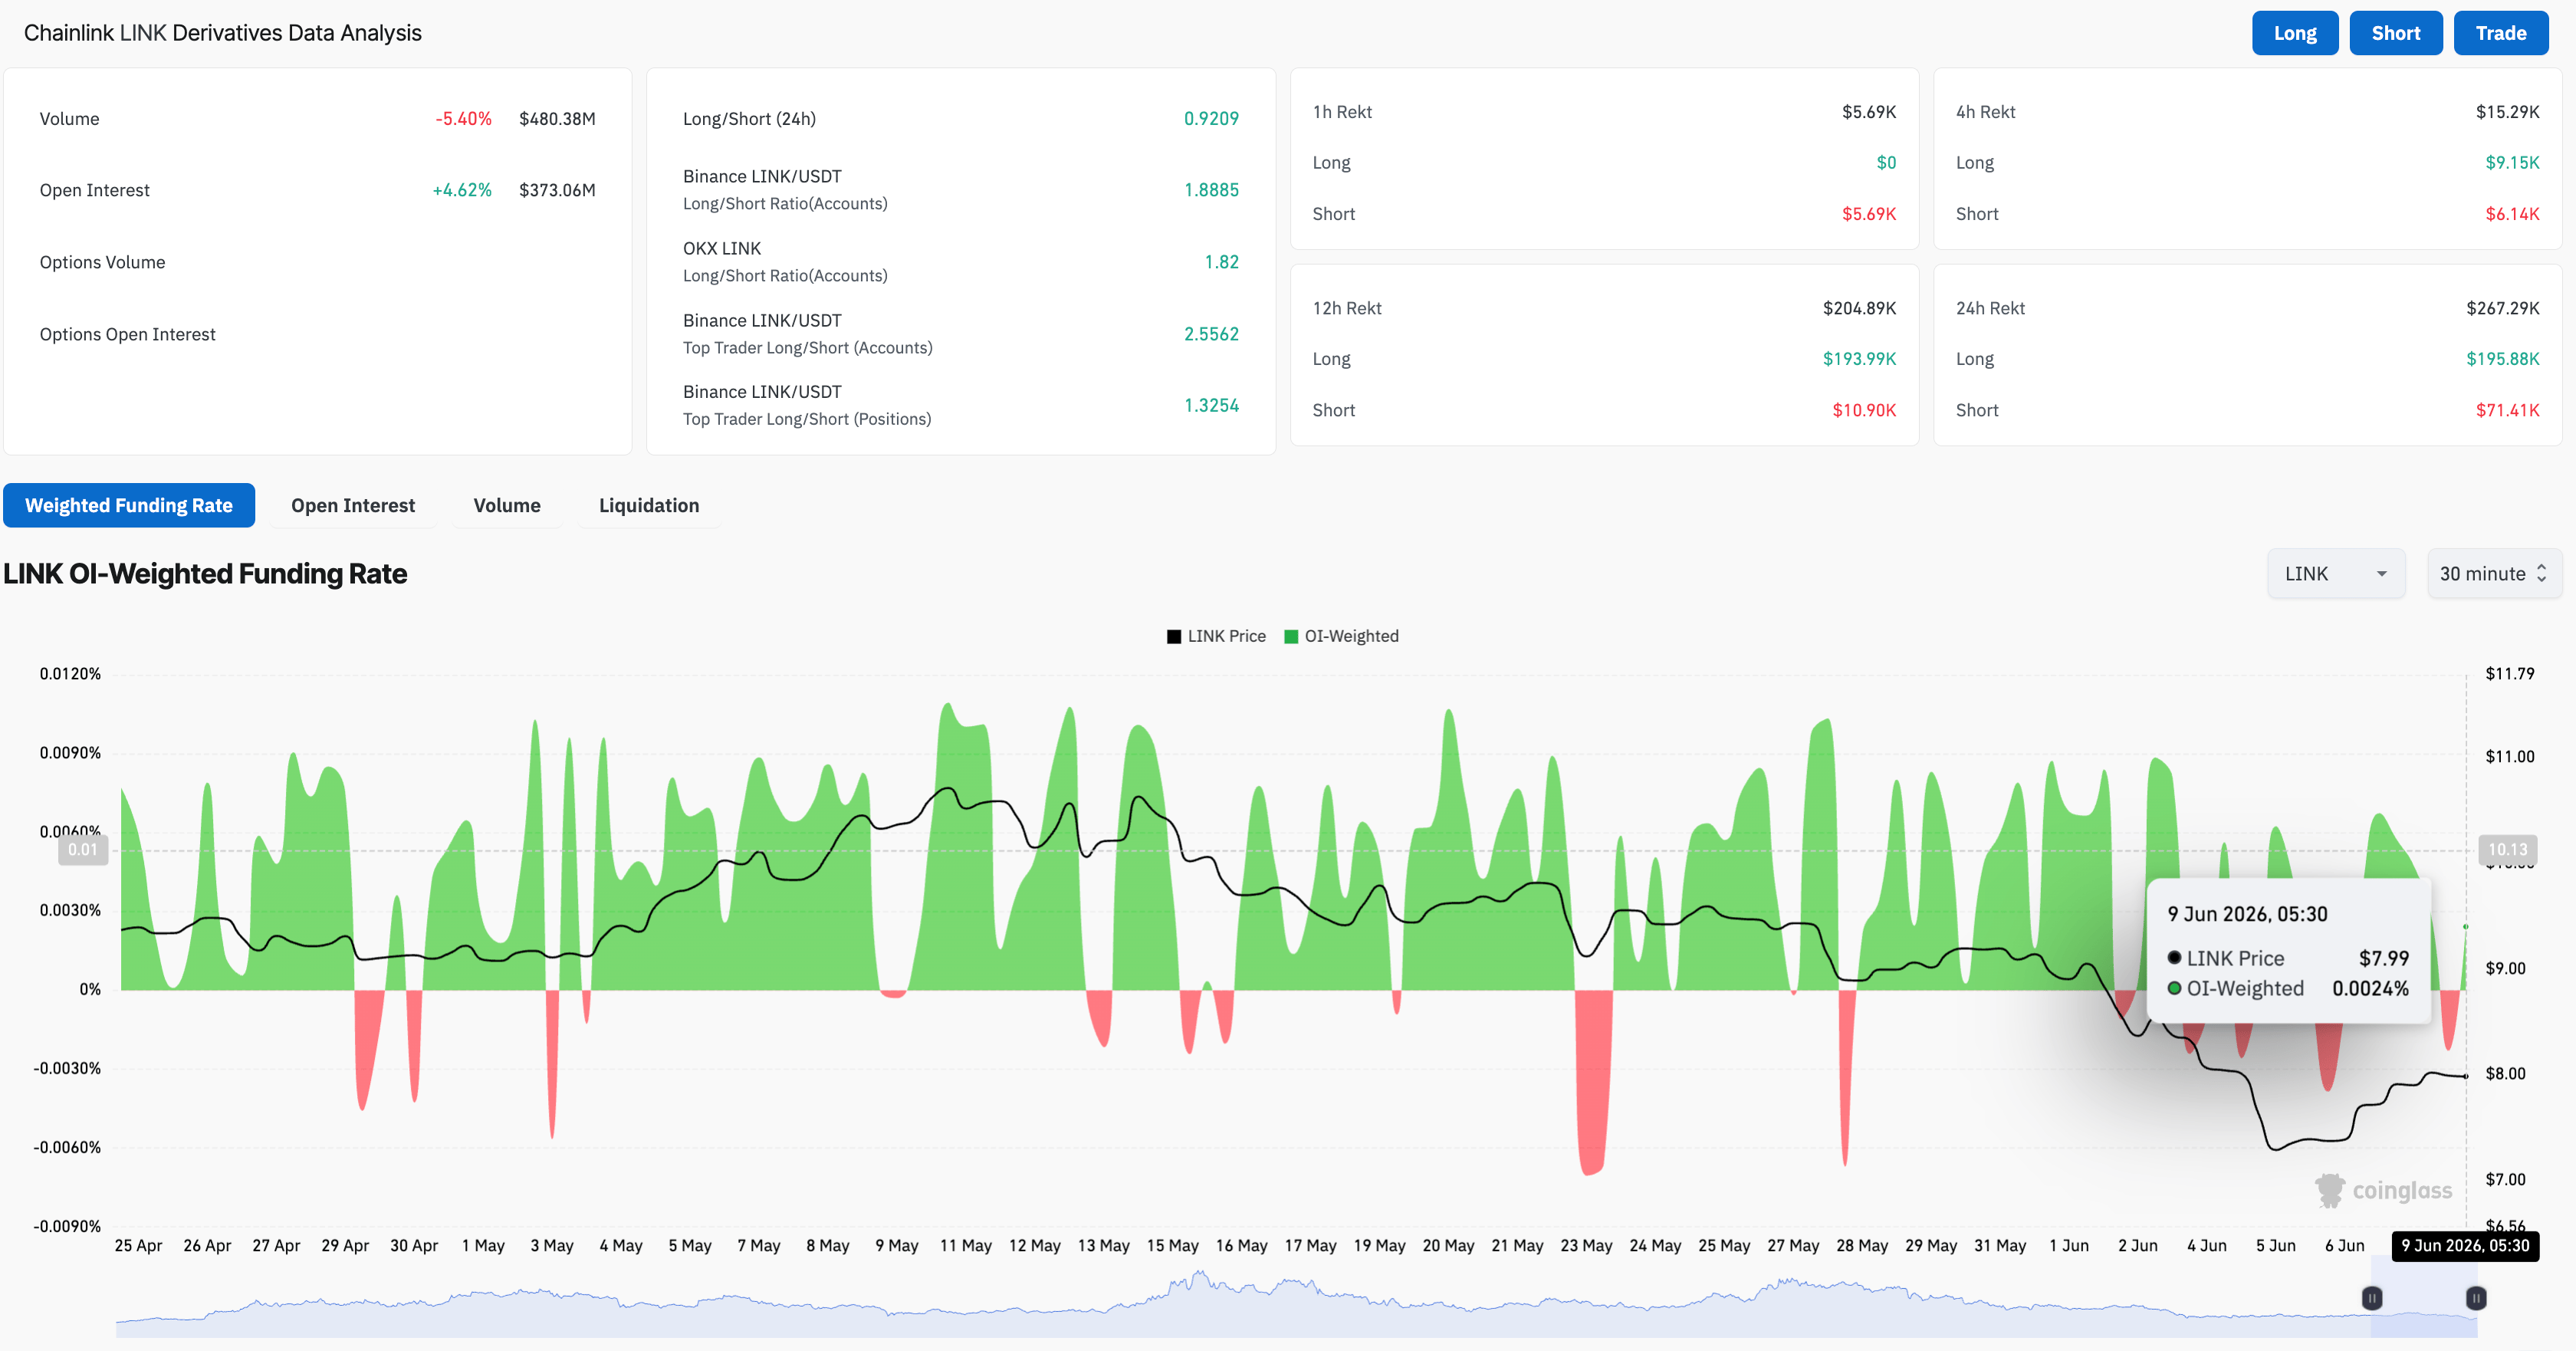
- Retail interest rebuilds in LINK derivatives, with an over 4% rise in Open Interest, while investor sentiment remains mixed.
Chainlink (LINK) price hovers near $8.00 at press time on Tuesday, reflecting a mild recovery after hitting a two-year low of $6.99 on Saturday. Renewed capital inflows of about $1.81 million on Monday, amid a steady ecosystem growth, with wallets holding at least 1 LINK token reaching a fresh high, prompt a firm long-term outlook.
Still, mixed investor sentiment in the derivatives market weighs on short-term price action, keeping the bias neutral to bearish.
Institutional inflows back the growing Chainlink ecosystem
Chainlink price has remained capped below $10 since February, following six consecutive months of losses totaling over 60%. Still, the on-chain data show significant community resilience, driving ecosystem growth. According to Santiment, the number of wallets holding at least 1 LINK token, typically linked to new users, hit 535,650 on Monday, the highest total since December 2022.
Although these low-volume wallets fail to dictate price trends, the consistent increase in their count points to gradual adoption and accumulation, supporting Chainlink's long-term outlook as a central player in oracle services, tokenized assets, and real-world asset infrastructure.
Corroborating the long-term outlook, institutional investors continue to accumulate LINK through Exchange Traded Funds (ETFs). Data show that the LINK-focused ETFs recorded $1.81 million in inflows on Monday, driving total net assets to $101.21 million. Notably, the LINK ETFs have maintained zero outflows since their inception on December 2.
LINK derivatives stand on a knife-edge
Derivatives market sentiment often reflects short-term volatility in a high-leverage, risk-exposed setting. According to CoinGlass, LINK futures Open Interest (OI) is up over 4% in the last 24 hours to $373.06 million, reflecting an increase in the notional value of outstanding contracts as traders regain risk-on sentiment.
The OI-weighted funding rate of 0.0024%, up from the -0.0023% dip the previous day, reaffirms mild bullish investor sentiment. However, the $269,290 in total liquidations over the last 24 hours, led by $195,880 in long liquidations, highlights a biased wipeout of bullish positions as price remains muted below $8.00.
The lack of upside continuation weighs down on highly leveraged long positions, keeping the sentiment rooted.
Chainlink’s rebound teeters on an upside breakout
Chainlink trades below $8.00 at press time on Tuesday, up from a $7.79 low earlier on the day, reflecting steady buying pressure on lower levels. Still, LINK maintains a broader bearish bias as the 50-day Exponential Moving Average (EMA) at $9.04 and the 100-day EMA at $9.48 both sit well above spot, suggesting the broader recovery structure has weakened, while the 200-day EMA near $10.70 reinforces a higher-term cap.
From a technical perspective, the price remains capped by a persistent long-term resistance trendline formed by connecting the highs of November 11 and January 14.
That said, the momentum, though constructive, remains fragile. The Relative Strength Index (RSI) is at 35 on the daily chart, with an uptick from the overbought zone, reflecting easing selling pressure. Yet, the Moving Average Convergence Divergence (MACD) and signal line remain below zero, with a negative histogram, suggesting downside pressure still dominates despite the market edging toward oversold conditions.
On the top side, the initial barrier is seen around the February 11 low at $8.13, acting as support-turned-resistance near the S1 Pivot Point at $8.31. A decisive close above this zone could test the dynamic barrier of the 50-day EMA at $9.04.
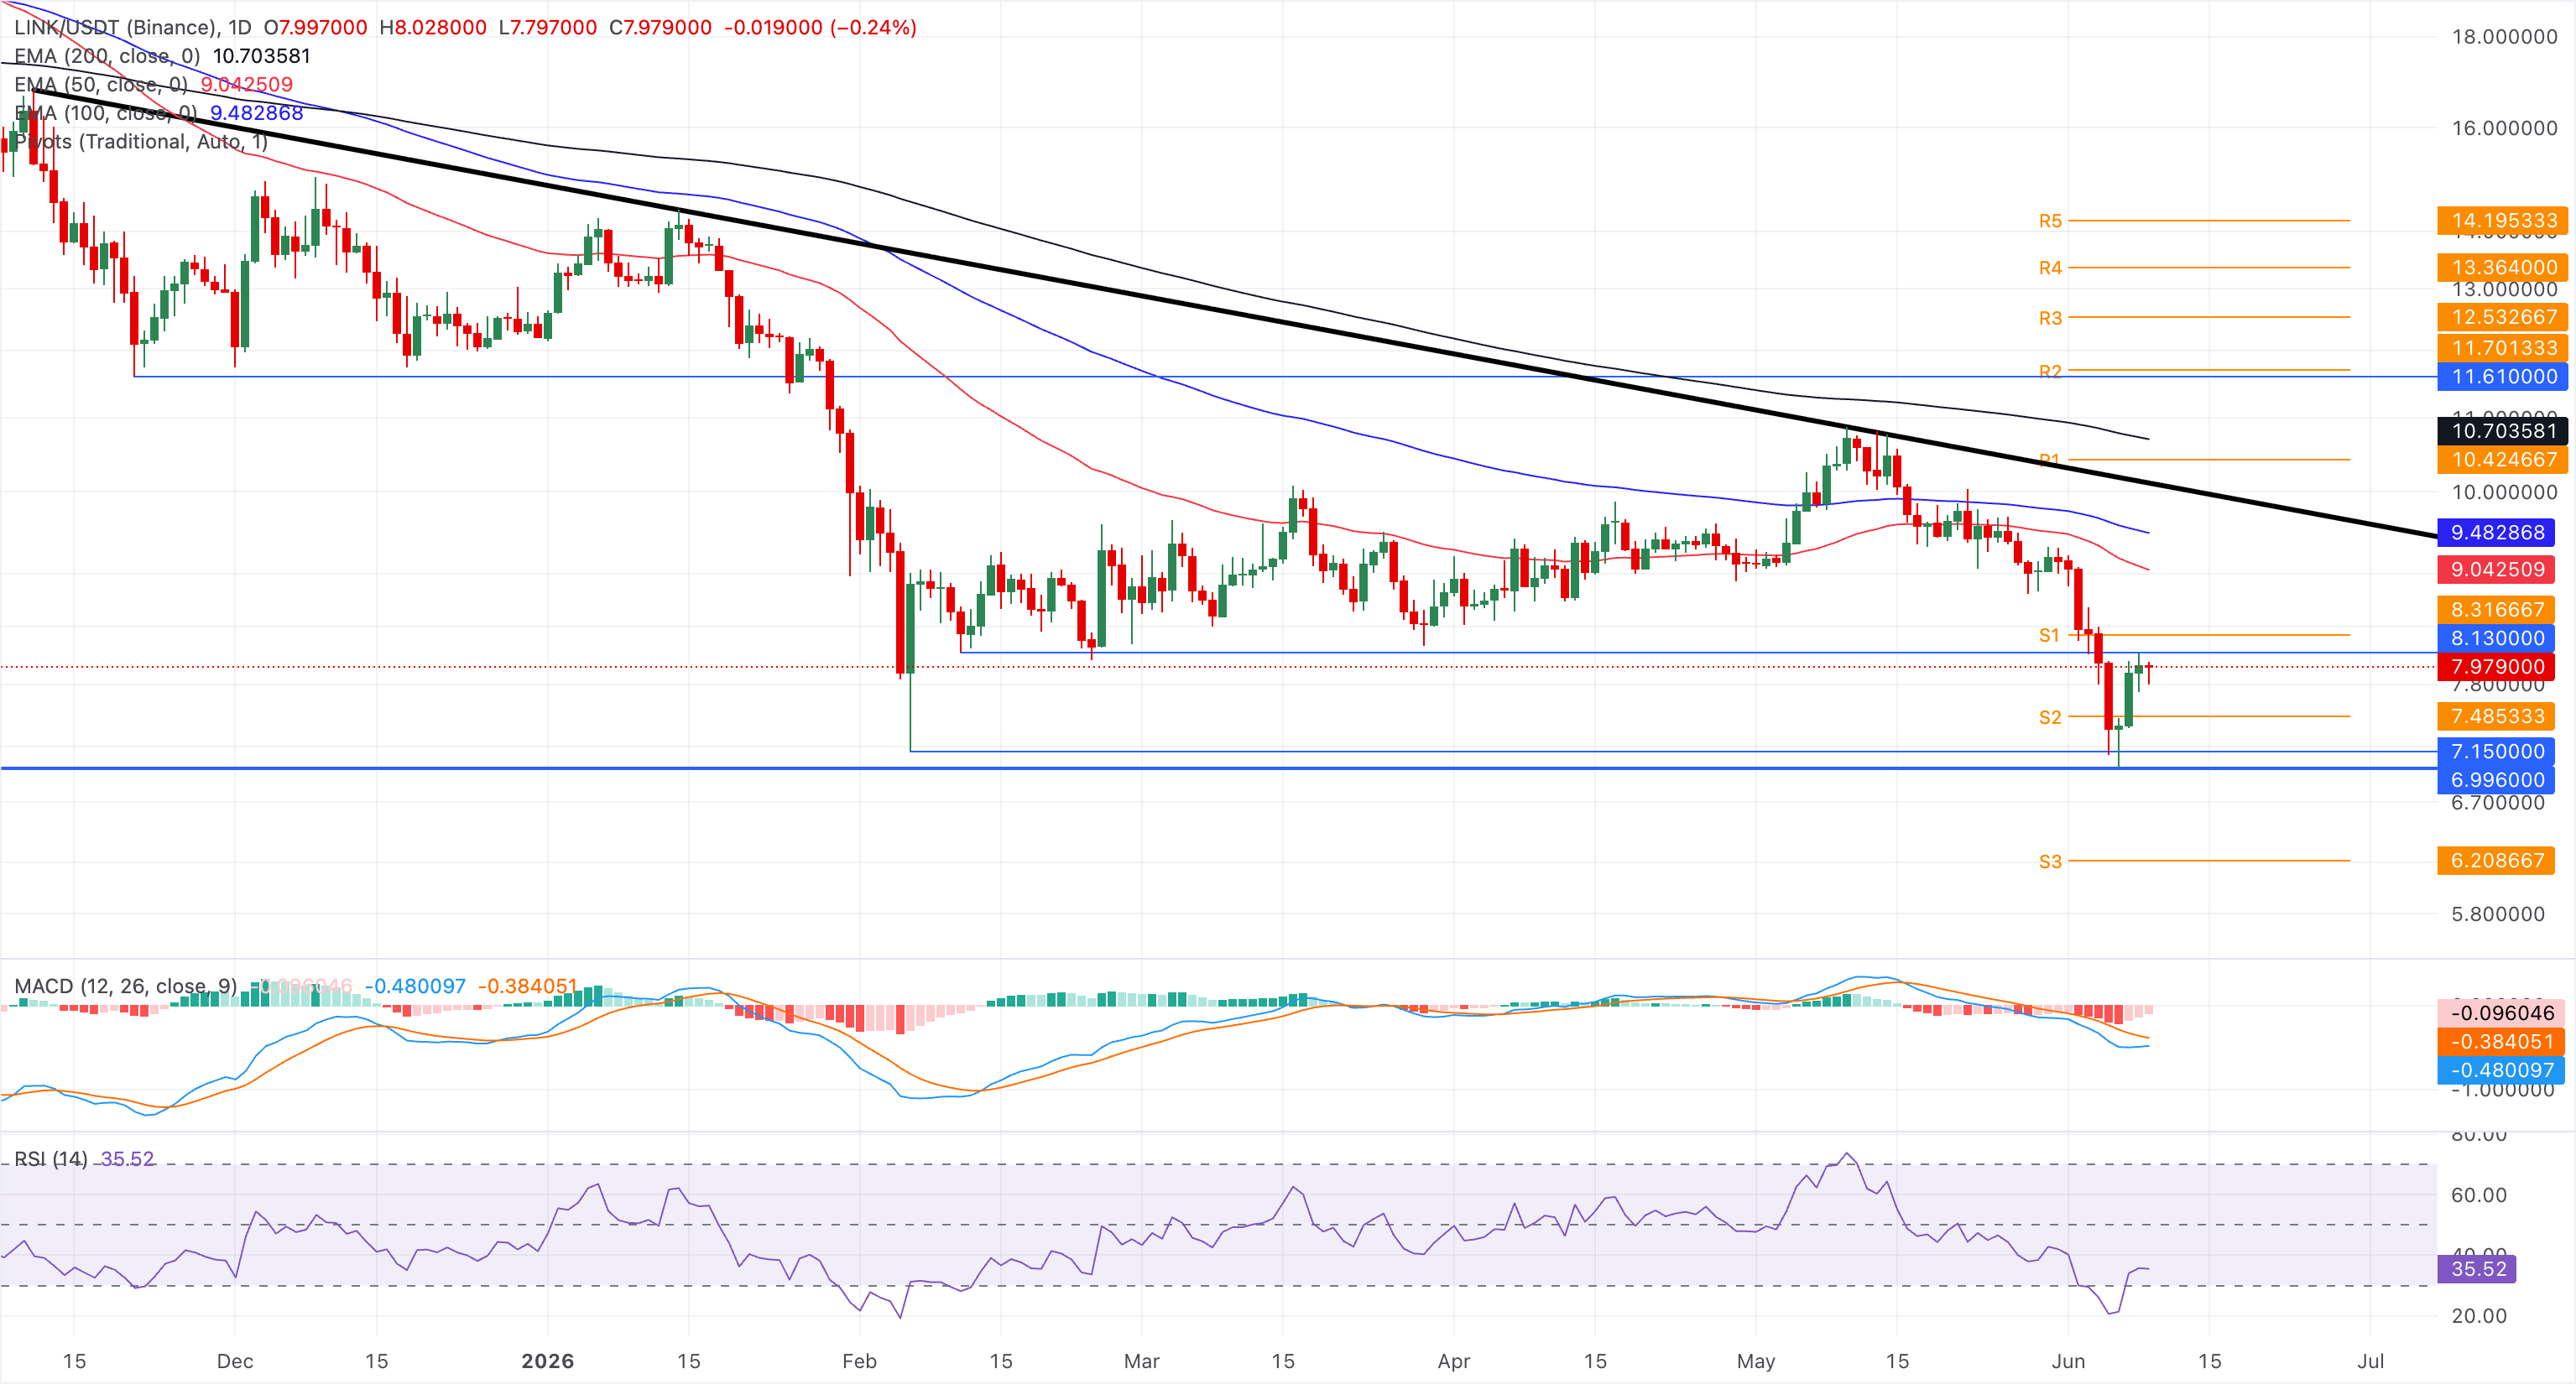
On the downside, the S2 Pivot Point at $7.48 guards against a move toward the cluster of support at the February 6 low at $7.15 and the Saturday low at $6.99.
(The technical analysis of this story was written with the help of an AI tool.)

100만 명이 넘는 사용자가 FXStreet를 통해 실시간 시장 데이터, 차트 도구, 전문가 인사이트, 포렉스 뉴스를 이용합니다. 포괄적인 경제 캘린더와 교육 웨비나는 트레이더가 정보를 유지하고 신중한 결정을 내리도록 돕습니다. FXStreet는 바르셀로나 본사와 전 세계 지역에 걸쳐 약 60명의 팀으로 구성되어 있습니다.
더 읽기


