
Chiliz Price Forecast: Mixed signals limit recovery
작성자 Manish Chhetri
게시일: 26 Feb 2026 | 수정일: 26 Feb 2026


인기 기사

Chiliz (CHZ) is trading red below $0.035 at the time of writing on Thursday, retracing after a 6% relief rally the previous day amid a broader downward trend.
- Chiliz price trades in the red on Thursday, after a 6% relief rally the previous day.
- Mixed on-chain and derivatives data signals indecisiveness among CHZ traders, capping upside recovery.
- The technical outlook suggests the primary trend remains bearish, keeping the overall outlook tilted to the downside.
Chiliz (CHZ) is trading red below $0.035 at the time of writing on Thursday, retracing after a 6% relief rally the previous day amid a broader downward trend. Mixed signals from the on-chain and derivatives metrics suggest that CHZ’s short-term outlook remains uncertain, limiting the scope for a recovery.
Mixed signals among CHZ traders
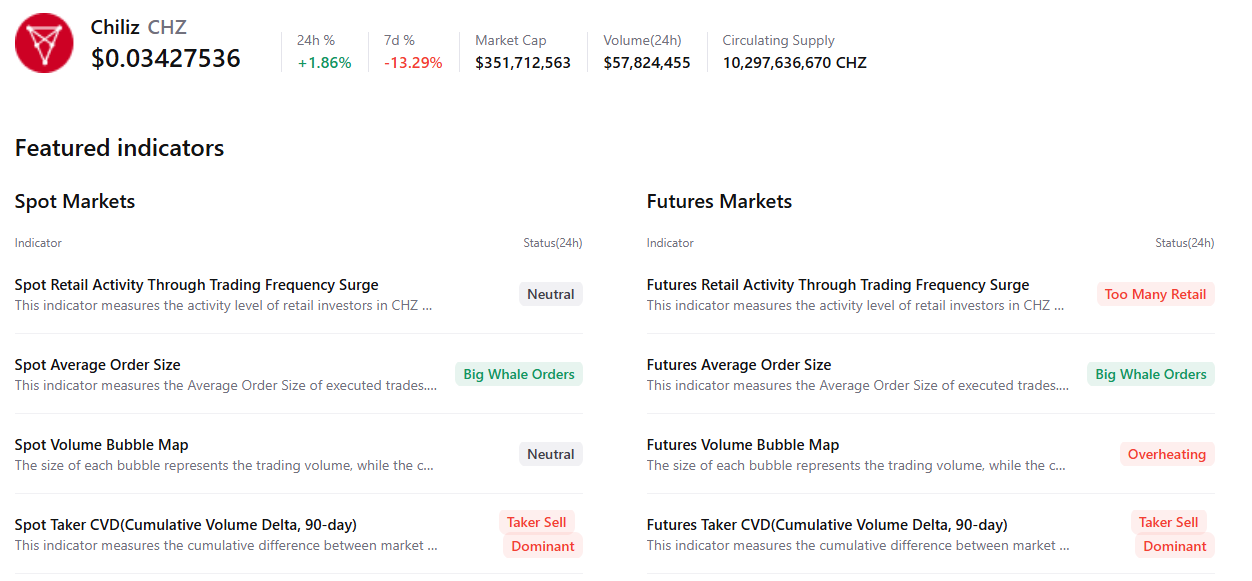
Chiliz’s CryptoQuant summary data show mixed conditions with early signs of bearishness. Activity across both spot and futures markets suggests sellers’ dominance, while the futures market shows rising retail traders and overheating, reflecting negative sentiment among investors. However, the presence of large whale orders in the market suggests a slightly optimistic outlook for CHZ.
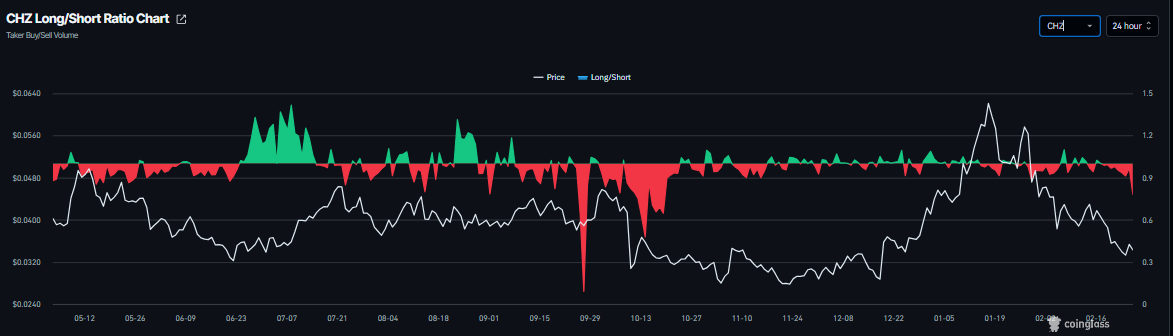
CHZ’s derivatives data also show mixed signals. CoinGlass long-to-short ratio for Chiliz reads 0.78 on Thursday. This ratio, being below one, reflects bearish sentiment in the market, as more traders are betting on the asset’s price to fall.
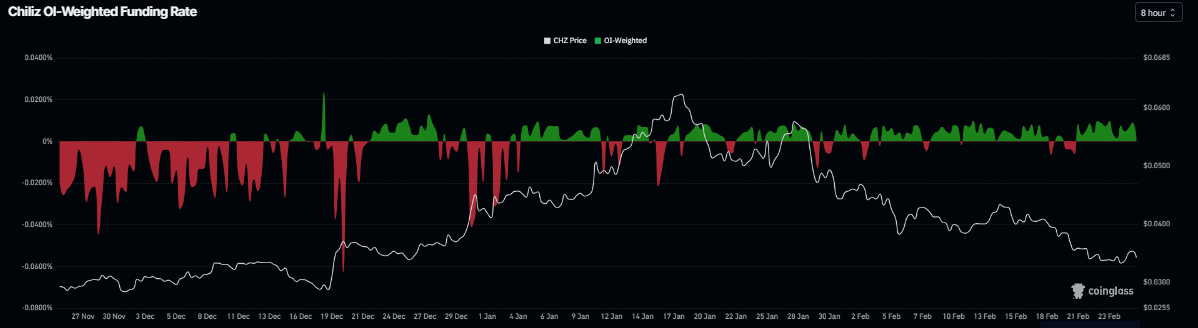
Meanwhile, the funding rates support a bullish thesis. CoinGlass’s OI-Weighted Funding Rate data shows that the number of traders betting that the price of CHZ will slide further is lower than those anticipating a price increase. The metric flipped to a positive rate on Saturday and currently stands at 0.0022% on Thursday, indicating that longs are paying shorts.
This combination suggests indecision among CHZ investors and limits the chances of a sustained recovery.
Chiliz Price Forecast: CHZ's broader structure remains bearish
Chiliz price is trading in red at $0.034 as of writing on Thursday. The near-term bias is mildly bearish as price holds below the persistent descending trend line from $0.064 and trades under the 50- and 100-day Exponential Moving Averages (EMAs), which now cap the upside near the $0.040-$0.041 zone.
On the daily chart, the Relative Strength Index around 37 stays below the 50 midline, signaling ongoing downside momentum, while the Moving Average Convergence Divergence (MACD) indicator remains in negative territory with the line below the signal and a shallow histogram, reinforcing a subdued tone rather than a capitulation sell-off.
Initial resistance stands at $0.037, aligned with a prior horizontal cap, followed by the confluence of a descending trend line and clustered moving averages near $0.040–$0.041, where a daily close above would ease bearish pressure.
On the downside, immediate support is at $0.033, with further protection coming in at $0.027, a key horizontal level whose loss would open the way to fresh lows within the broader downtrend.
(The technical analysis of this story was written with the help of an AI tool.)

100만 명이 넘는 사용자가 FXStreet를 통해 실시간 시장 데이터, 차트 도구, 전문가 인사이트, 포렉스 뉴스를 이용합니다. 포괄적인 경제 캘린더와 교육 웨비나는 트레이더가 정보를 유지하고 신중한 결정을 내리도록 돕습니다. FXStreet는 바르셀로나 본사와 전 세계 지역에 걸쳐 약 60명의 팀으로 구성되어 있습니다.
더 읽기


