
Cosmos Hub Price Forecast: ATOM under pressure as bearish momentum accelerates
작성자 Manish Chhetri
게시일: 2 Mar 2026 | 수정일: 2 Mar 2026


인기 기사

Cosmos Hub (ATOM) steadies near $1.82 at the time of writing on Monday, following a 20% decline the previous week. Weakening on-chain and derivatives data support a bearish outlook, while technical analysis remains unfavorable.
- Cosmos Hub price hovers at $1.82 on Monday after falling over 20% in the previous week.
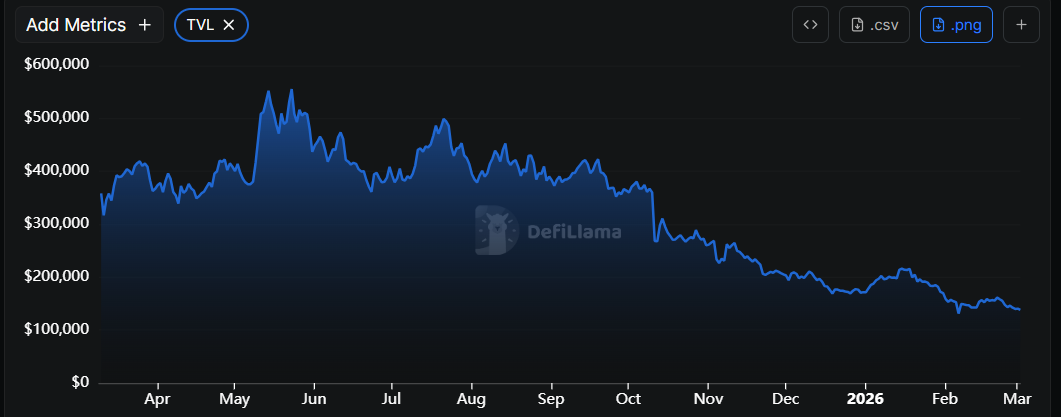
- On-chain and derivatives data paint a bearish outlook, as ATOM’s TVL is falling alongside negative funding rates.
- The technical outlook suggests further downside, as momentum indicators show bearish strength gaining traction.
Cosmos Hub (ATOM) steadies near $1.82 at the time of writing on Monday, following a 20% decline the previous week. Weakening on-chain and derivatives data support a bearish outlook, while technical analysis remains unfavorable. In addition, risk-off sentiment persists, as the escalating military aggression in the Middle East over the weekend continues to weigh on the crypto market.
On-chain and derivatives data show bearish bias
DefiLlama data shows that Cosmos Hub’s Total Value Locked (TVL) drops to $138,370 on Monday, and has been steadily declining since mid-January. Falling TVL signals weakening activity and waning user engagement in ATOM’s ecosystem, implying that fewer participants are depositing or interacting with ATOM-based protocols, which doesn’t bode well for its price.
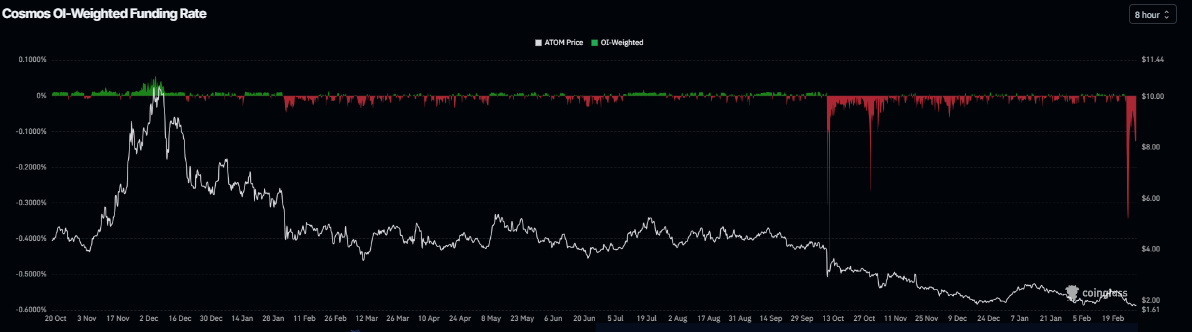
Derivatives data for Cosmos Hub also support a bearish outlook. Coinglass’s OI-Weighted Funding Rate data shows that the number of traders betting that the price of ATOM will slide further is higher than those anticipating a price increase. The metric flipped to a negative rate on Thursday and stands at -0.127% on Monday, indicating shorts are paying longs and suggesting bearish sentiment toward ATOM.
Cosmos Hub Price Forecast: Bears in control of the momentum
Cosmos Hub is trading at $1.82 as of Monday. The near-term bias stays mildly bearish, as price holds below the 50- and 100-day Exponential Moving Averages (EMAs), which continue to trend lower and cap recovery attempts. ATOM also trades under the 23.6% Fibonacci retracement at $1.90, measured from $2.69 (January 14 high) to $1.65 (February 6 low), underscoring a failed attempt to sustain above this initial corrective resistance on Sunday.
Momentum remains weak, with the Relative Strength Index (RSI) on the daily chart at 36, indicating subdued buying interest, and the Moving Average Convergence Divergence (MACD) declining below its signal line and the zero mark, signaling persistent downside pressure.
Immediate resistance at $1.83 is reinforced by the abovementioned 23.6% Fibonacci retracement at $1.90, and a daily close above this band would be needed to ease selling pressure and open the way toward the 38.2% Fibonacci retracement at $2.05 and the 50-day EMA near $2.12.
On the downside, the $1.80 area acts as the first line of support ahead of the recent $1.65 swing low, where previous demand emerged.
A break below $1.65 would extend the dominant downtrend and expose lower levels, while only a sustained move back above $2.05 would start to neutralize the current bearish tone.
(The technical analysis of this story was written with the help of an AI tool.)

100만 명이 넘는 사용자가 FXStreet를 통해 실시간 시장 데이터, 차트 도구, 전문가 인사이트, 포렉스 뉴스를 이용합니다. 포괄적인 경제 캘린더와 교육 웨비나는 트레이더가 정보를 유지하고 신중한 결정을 내리도록 돕습니다. FXStreet는 바르셀로나 본사와 전 세계 지역에 걸쳐 약 60명의 팀으로 구성되어 있습니다.
더 읽기


