
Crude Oil forgets the war and shrugs at the tollbooth
작성자 Joshua Gibson
수정됨: 2 Jul 2026


인기 기사

Crude Oil finished Thursday at its lowest level in 18 weeks, which means the vast risk premium that built up around this year's conflict has fully bled away, back to pre-war levels.
- WTI settled at an 18-week low on Thursday, completing the round trip of its war-driven spike.
- The market is waving off a live Strait of Hormuz toll dispute that Washington had vowed to prevent.
- Momentum is deeply oversold, yet no demand-side catalyst has appeared to arrest the slide.
Crude Oil finished Thursday at its lowest level in 18 weeks, which means the vast risk premium that built up around this year's conflict has fully bled away, back to pre-war levels. The interesting part is not the round trip, which was always likely once the fighting stopped, but that WTI keeps grinding lower while a genuine flashpoint is live. The two sides are trading threats over a Strait of Hormuz toll, yet a barrel of Crude Oil that leans on that waterway trades as though the dispute barely registers.
The premium round-trips to zero
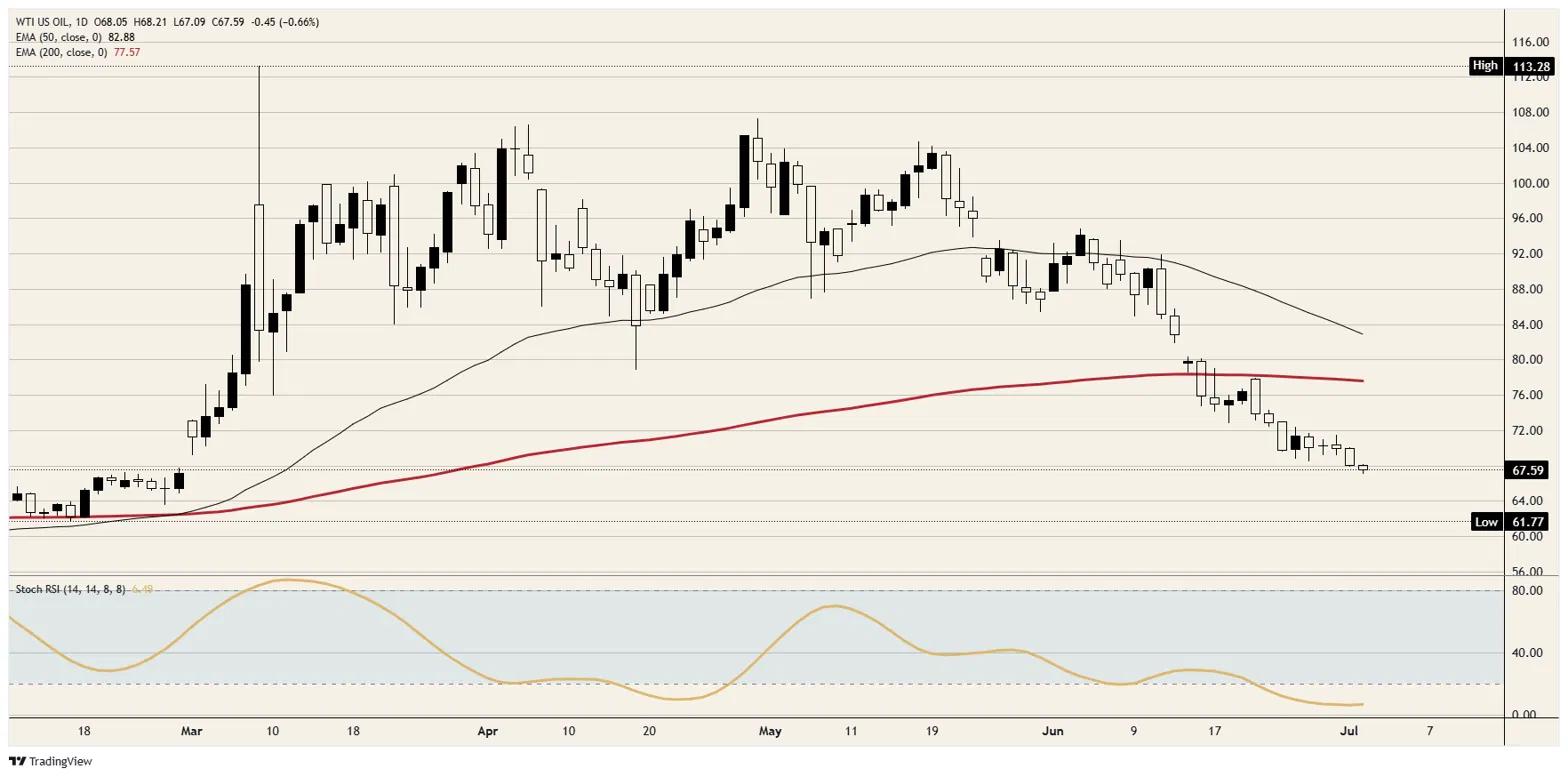
The spike that carried Crude Oil above $110 at the height of the conflict has fully reversed, and the benchmark now trades below both its 50-period Exponential Moving Average (EMA) near $83 and its 200-period EMA close to $78. Strip out the geopolitics and what remains is the market that existed before the war: oversupplied, with the Americas led by the US, Guyana, and Brazil pushing production to fresh highs and inventories near multi-year peaks. That surplus never disappeared; it was masked by a fear bid, and with the fear gone the glut is doing exactly what gluts do to price.
A toll is a tax, not a blockade
Underneath the alarming headline sits a distinction the market has worked out. Tehran, with Oman as its coastal partner, is insisting on the right to charge for passage once the current toll-free window lapses, calling the levy a service fee, not a toll. Washington, which had promised to keep the strait toll-free, is trying to head it off by dangling roughly $100 billion in frozen Iranian funds, so far to no avail. A toll and a blockade are not the same animal, though: a fee lifts the delivered cost of a barrel at the margin, but it removes not a single barrel from the market.
Extortion needs the traffic to keep moving
There is a deeper reason the threats ring hollow. A toll only earns money if ships keep coming, so a Tehran that has chosen to monetize the strait has every incentive to keep it open rather than shut it: closing the waterway collects nothing, while taxing the flow collects a fortune. The sabre-rattling reads less like a prelude to disruption than like leverage over the size of the fee, which is why the market answers a supply-risk headline with a shrug and a lower close. That calm is not a guarantee, though, and a toll regime Washington refuses to accept could still tip into the disruption everyone is dismissing.
Cheaper Crude Oil does the Fed a favour
The cross-asset signal, for now, points away from trouble. Falling Crude Oil is dragging headline inflation lower, and that easing is exactly what hands a hawkish Federal Reserve (Fed) the cover to leave rates alone rather than hike, tying this week's soft US jobs data to a central bank that no longer feels boxed in. Cheaper Crude Oil is doing part of the Fed's job, and a barrel stuck in the high $60s keeps that disinflationary tailwind blowing.
Levels to watch
Resistance: The first ceiling is the $70 round number just overhead, and a push through it runs quickly into the $72 area that capped the last bounce. Nothing structural improves until Crude Oil reclaims the 200 EMA near $78, and the falling 50 EMA around $83 marks where the downtrend would truly be called into question.
Support: With momentum this stretched there is little below to lean on. The nearest shelf sits near $65, and beneath it the low $60s come into play, where Crude Oil last bottomed before the conflict lit the fuse. A daily Stochastic Relative Strength Index (Stoch RSI) buried near 6 says the selling is deeply overstretched, so a reflex bounce would surprise no one, though oversold readings inside a downtrend tend to mark pauses rather than turns.
Bias: The path of least resistance stays lower until proven otherwise. The war premium is gone and the underlying market is oversupplied, while the only bullish story is being correctly discounted as rent-seeking rather than lost supply, leaving little to halt the slide beyond position-squaring bounces. The trade is to fade rallies into the $70 to $72 band rather than chase the lows, with the deeply oversold momentum arguing for patience on fresh shorts. A sustained reclaim of the 200 EMA near $78 would retire the bearish view; short of that, lower remains the line of least resistance.
WTI spot daily chart
WTI Oil FAQs
WTI Oil is a type of Crude Oil sold on international markets. The WTI stands for West Texas Intermediate, one of three major types including Brent and Dubai Crude. WTI is also referred to as “light” and “sweet” because of its relatively low gravity and sulfur content respectively. It is considered a high quality Oil that is easily refined. It is sourced in the United States and distributed via the Cushing hub, which is considered “The Pipeline Crossroads of the World”. It is a benchmark for the Oil market and WTI price is frequently quoted in the media.
Like all assets, supply and demand are the key drivers of WTI Oil price. As such, global growth can be a driver of increased demand and vice versa for weak global growth. Political instability, wars, and sanctions can disrupt supply and impact prices. The decisions of OPEC, a group of major Oil-producing countries, is another key driver of price. The value of the US Dollar influences the price of WTI Crude Oil, since Oil is predominantly traded in US Dollars, thus a weaker US Dollar can make Oil more affordable and vice versa.
The weekly Oil inventory reports published by the American Petroleum Institute (API) and the Energy Information Agency (EIA) impact the price of WTI Oil. Changes in inventories reflect fluctuating supply and demand. If the data shows a drop in inventories it can indicate increased demand, pushing up Oil price. Higher inventories can reflect increased supply, pushing down prices. API’s report is published every Tuesday and EIA’s the day after. Their results are usually similar, falling within 1% of each other 75% of the time. The EIA data is considered more reliable, since it is a government agency.
OPEC (Organization of the Petroleum Exporting Countries) is a group of 12 Oil-producing nations who collectively decide production quotas for member countries at twice-yearly meetings. Their decisions often impact WTI Oil prices. When OPEC decides to lower quotas, it can tighten supply, pushing up Oil prices. When OPEC increases production, it has the opposite effect. OPEC+ refers to an expanded group that includes ten extra non-OPEC members, the most notable of which is Russia.

100만 명이 넘는 사용자가 FXStreet를 통해 실시간 시장 데이터, 차트 도구, 전문가 인사이트, 포렉스 뉴스를 이용합니다. 포괄적인 경제 캘린더와 교육 웨비나는 트레이더가 정보를 유지하고 신중한 결정을 내리도록 돕습니다. FXStreet는 바르셀로나 본사와 전 세계 지역에 걸쳐 약 60명의 팀으로 구성되어 있습니다.
더 읽기


