

Crude Oil stops trading the headlines and starts trading the war
- WTI trades just above the $91.00 handle, up almost 6% on the day, with Brent testing the $95.00 area as both benchmarks return to early-June levels.
- Fresh Iranian threats and a head-for-an-eye doctrine from Washington's top diplomat keep the escalation channel producing on schedule.
- The advance is one-directional rather than headline-reactive, and the futures market is paying up harder than the spot tape.
Crude Oil is staging the kind of one-day advance that usually arrives strapped to a flash headline, and the wires have duly supplied several, but the tape refuses to behave like a reaction. WTI trades just above the $91.00 handle into the North American afternoon, up almost 6% on the day, while Brent presses the $95.00 area, up almost 5%, and both benchmarks sit back at levels last seen in early June.

The character of the move matters more than its size, because the advance has run in one direction since the day began and every dip has been absorbed within minutes. Futures are trading through the spot tape rather than lagging it, and that combination reads as repricing rather than reflex, which is not how this market has treated war headlines for most of July.
Disproportion finds its spokesman
The day's headline flow gives the rally a respectable alibi, because the escalation channel produced fresh material right on schedule. Iranian Foreign Minister Abbas Araghchi spent the week describing Tehran's doctrine as an eye for an eye and promising a powerful response to any strike on Iranian infrastructure, while the foreign ministry branded Washington's bridge-and-power-plant price list unlawful. Houthi forces, having declared a maritime embargo on Saudi Arabia earlier in the week, struck two Saudi tankers in the Red Sea on Wednesday, converting a threat against Saudi flows into a second live pressure point alongside the Strait of Hormuz.
Secretary of State Marco Rubio then supplied the centrepiece from Manila, answering the Iranian formula directly by describing Trump's strategy as a head for an eye. He added that the price rises every night until Tehran comes to its senses, that Iran keeps begging for a deal and then breaking it, and that the goal is keeping a nuclear weapon out of Tehran's hands rather than regime change. The line is the third rendering of the same arithmetic in four days, following the many-times-over pledge on American casualties and the posted rate of one bridge or power plant per tanker.
A market that wanted to fade this material would have had its chances, and for two weeks it took every one of them, renting the war premium through the morning and handing it back by the afternoon. The absence of that reflex today is the tell that the doctrine landed differently, not as noise to trade around but as confirmation that the retaliation ladder has no advertised top and that the disruption now runs wider than the Strait itself.
One-way traffic is not a twitch
Monday's session remains the useful contrast, because three days ago this market still traded like a nerve ending: an early WTI high just above the $84.00 handle, a midday flush through $79.50 on a single social-media post, and an immediate V-shaped recovery to test $83.00. That is what headline-reactive trading looks like, violent in both directions and pointless on net.
Thursday has produced none of that violence, which is precisely the point. WTI has printed higher lows through every hour of the session, climbing from the $86.50 area to just above $91.00, while Brent has run the same staircase from the $90.50 area to a test of $95.00. Pullbacks have reached about a Dollar at their deepest and have been reabsorbed within the hour, and the intraday Stochastic oscillator has cycled through overbought repeatedly without producing a reversal of any consequence, the signature of a trend day rather than a skirmish.
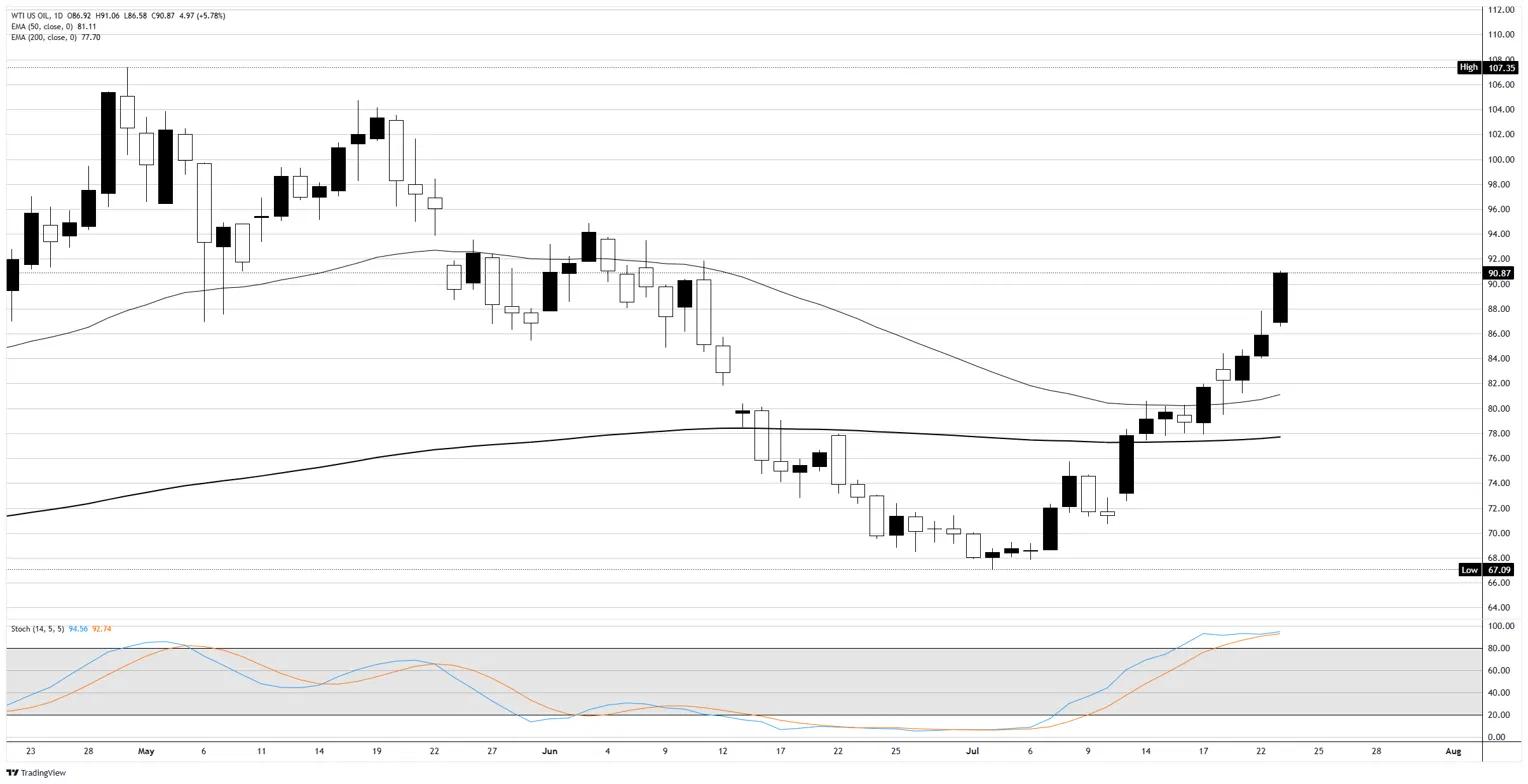
The daily chart supplies the wider frame, with WTI now trading more than a third above its early-July basing low near $67.00 and the entire recovery compressed into barely three weeks. A market covering that much ground with nothing resembling a durable rejection along the way is not hedging headline risk. It is rebuilding the war premium as a standing feature of the price.
The futures market strengthens the case rather than complicating it, with the WTI front month near $92.00, through the spot tape, and the Brent front-month contract back above the $100.00 handle for the first time since May, a level that belonged to the opening phase of the war. None of this requires much imagination about the physical balance, which currently features Gulf exports at roughly half their pre-war rate, Strait tanker traffic at a fraction of normal, reimposed sanctions on Iranian barrels, and a Strategic Petroleum Reserve at its lowest level since 1983.
Crude Oil technical levels
Resistance: The session high just above $91.00 is the immediate WTI cap, ahead of the early-June shelf near $95.00 that Brent is already testing. Beyond there the daily chart thins quickly toward $104.00, with the April conflict peak just above $107.00 as the outer marker and the $100.00 handle standing as Brent's own milestone.
Support: The $86.50 launch area from the start of the session is the first floor, ahead of the $85.00 handle. Below there sits the rising 50-day Exponential Moving Average near $81.00, the line the July advance has leaned on throughout and never surrendered, with Brent's equivalent near $85.50.
Bias: Bullish. The daily Stochastic oscillator is pinned in the mid-90s on both benchmarks, a reading that argues for a fade in a headline-twitch regime, but trend days do not honour oscillators and this one has spent the whole session proving it. Bullish while WTI holds above the $86.50 area, and a daily close back below the $85.00 handle is the signal that the speculative twitch has retaken the wheel.
WTI Crude Oil daily chart
WTI Oil FAQs
WTI Oil is a type of Crude Oil sold on international markets. The WTI stands for West Texas Intermediate, one of three major types including Brent and Dubai Crude. WTI is also referred to as “light” and “sweet” because of its relatively low gravity and sulfur content respectively. It is considered a high quality Oil that is easily refined. It is sourced in the United States and distributed via the Cushing hub, which is considered “The Pipeline Crossroads of the World”. It is a benchmark for the Oil market and WTI price is frequently quoted in the media.
Like all assets, supply and demand are the key drivers of WTI Oil price. As such, global growth can be a driver of increased demand and vice versa for weak global growth. Political instability, wars, and sanctions can disrupt supply and impact prices. The decisions of OPEC, a group of major Oil-producing countries, is another key driver of price. The value of the US Dollar influences the price of WTI Crude Oil, since Oil is predominantly traded in US Dollars, thus a weaker US Dollar can make Oil more affordable and vice versa.
The weekly Oil inventory reports published by the American Petroleum Institute (API) and the Energy Information Agency (EIA) impact the price of WTI Oil. Changes in inventories reflect fluctuating supply and demand. If the data shows a drop in inventories it can indicate increased demand, pushing up Oil price. Higher inventories can reflect increased supply, pushing down prices. API’s report is published every Tuesday and EIA’s the day after. Their results are usually similar, falling within 1% of each other 75% of the time. The EIA data is considered more reliable, since it is a government agency.
OPEC (Organization of the Petroleum Exporting Countries) is a group of 12 Oil-producing nations who collectively decide production quotas for member countries at twice-yearly meetings. Their decisions often impact WTI Oil prices. When OPEC decides to lower quotas, it can tighten supply, pushing up Oil prices. When OPEC increases production, it has the opposite effect. OPEC+ refers to an expanded group that includes ten extra non-OPEC members, the most notable of which is Russia.














