
Crypto Market Overview: Bitcoin loses $70,000 but ETFs, whale activity holds – WLD, ZEC, and TON lead losses
작성자 Vishal Dixit
게시일: 20 Mar 2026 | 수정일: 20 Mar 2026


인기 기사

Bitcoin (BTC) trades near $70,000 at press time on Friday as the US-Iran war impacts the global economy, linked with rising Oil prices. The sentiment in the crypto market is growing risk-averse, while institutions and large wallet investors, popularly known as whales, retain confidence.
- Bitcoin hovers around $70,000 in early Asian hours on Friday after three straight days of losses, implying intense downside pressure.
- ETF activity and whale count rise in Bitcoin despite faltering market sentiment, with liquidations crossing $400 million over the last 24 hours.
- Worldcoin, Zcash, and Toncoin lead losses as the broader cryptocurrency market witnesses a three-day decline.
Bitcoin (BTC) trades near $70,000 at press time on Friday as the US-Iran war impacts the global economy, linked with rising Oil prices. The sentiment in the crypto market is growing risk-averse, while institutions and large wallet investors, popularly known as whales, retain confidence.
Market gripped by fear, but institutional and whale interest holds steady
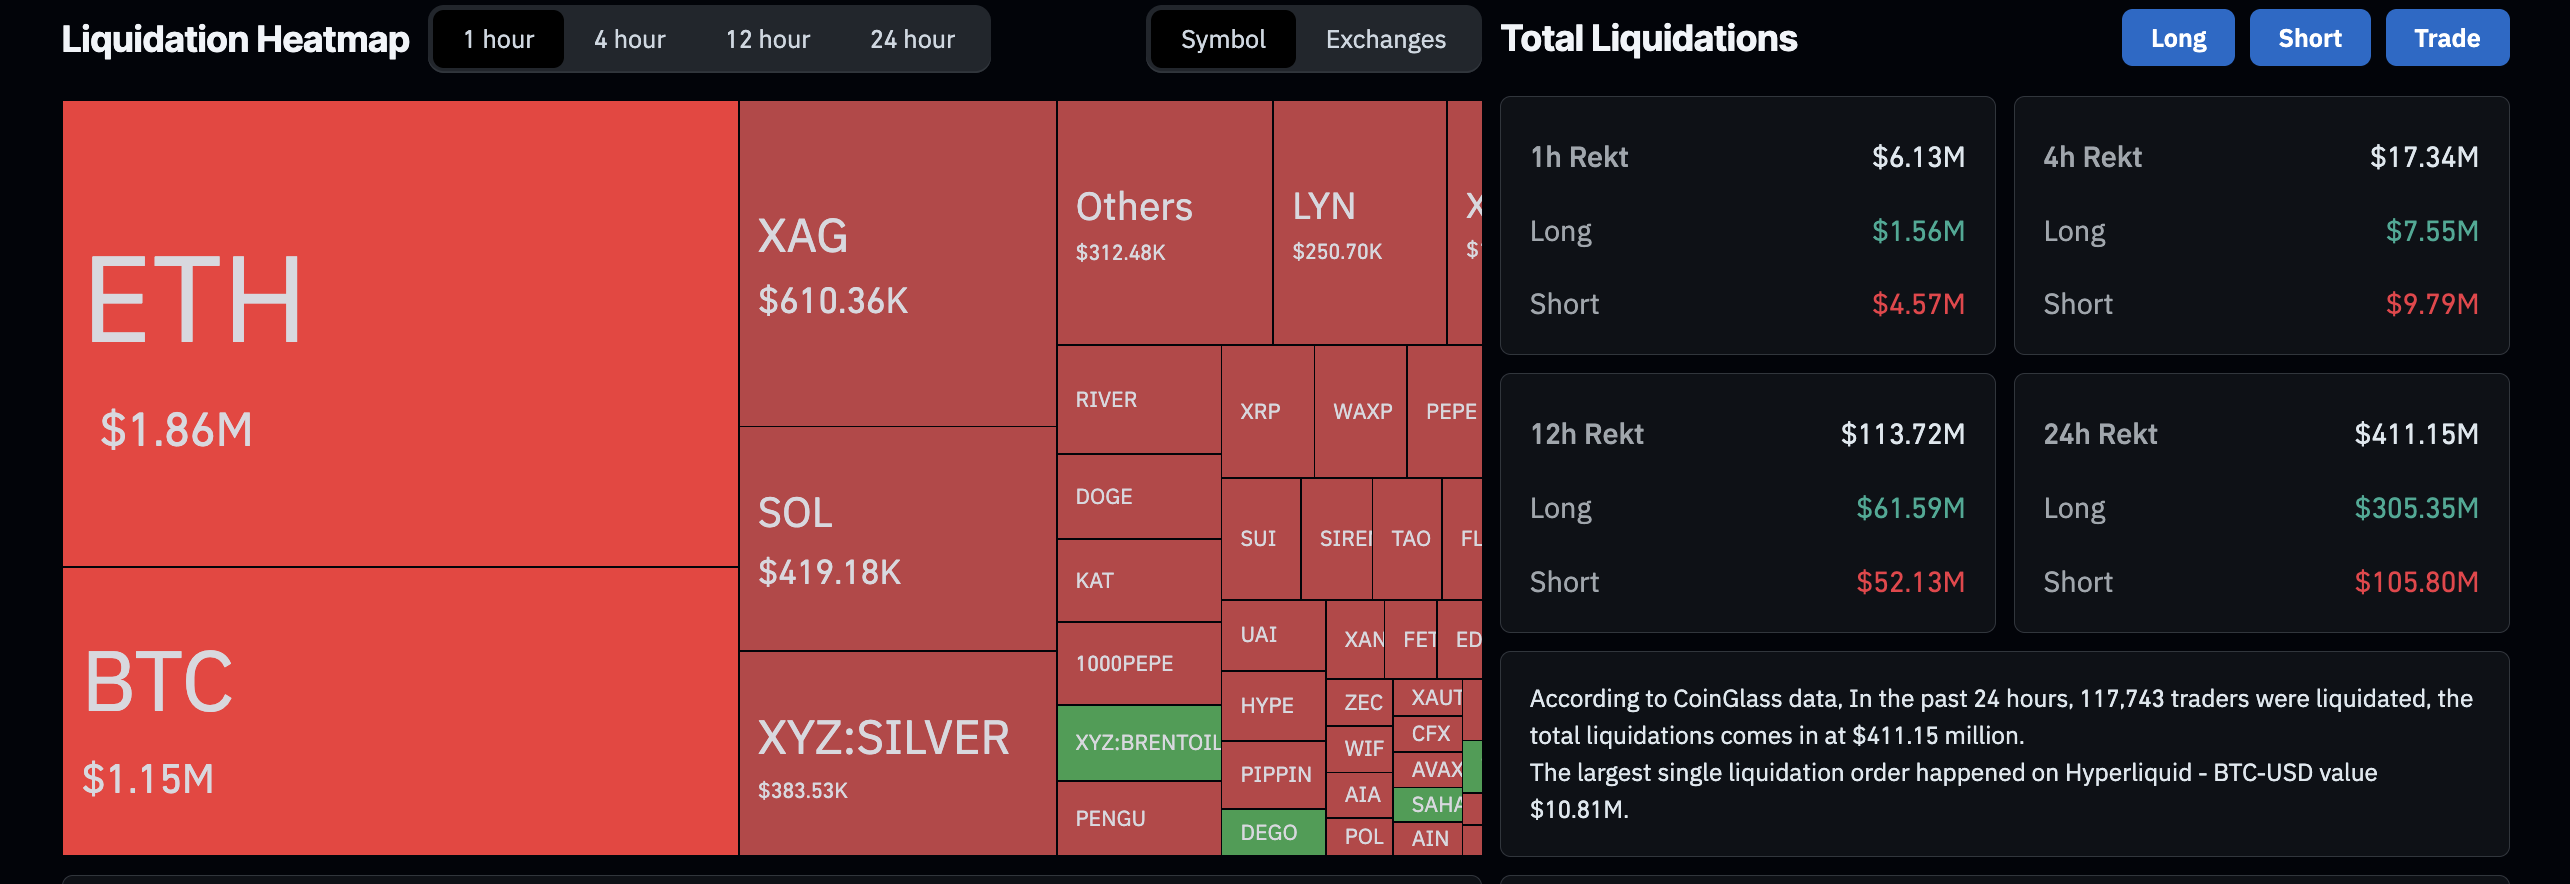
The broader cryptocurrency market sentiment has dropped with Bitcoin retracing to $70,000 on Friday. CoinMarketCap’s Fear and Greed Index is at 31, suggesting that investors are gripped by fear. Additionally, the CoinGlass data shows over $411 million wiped out from the market over the last 24 hours, including $305 million of long liquidations, suggesting a bearish bias.
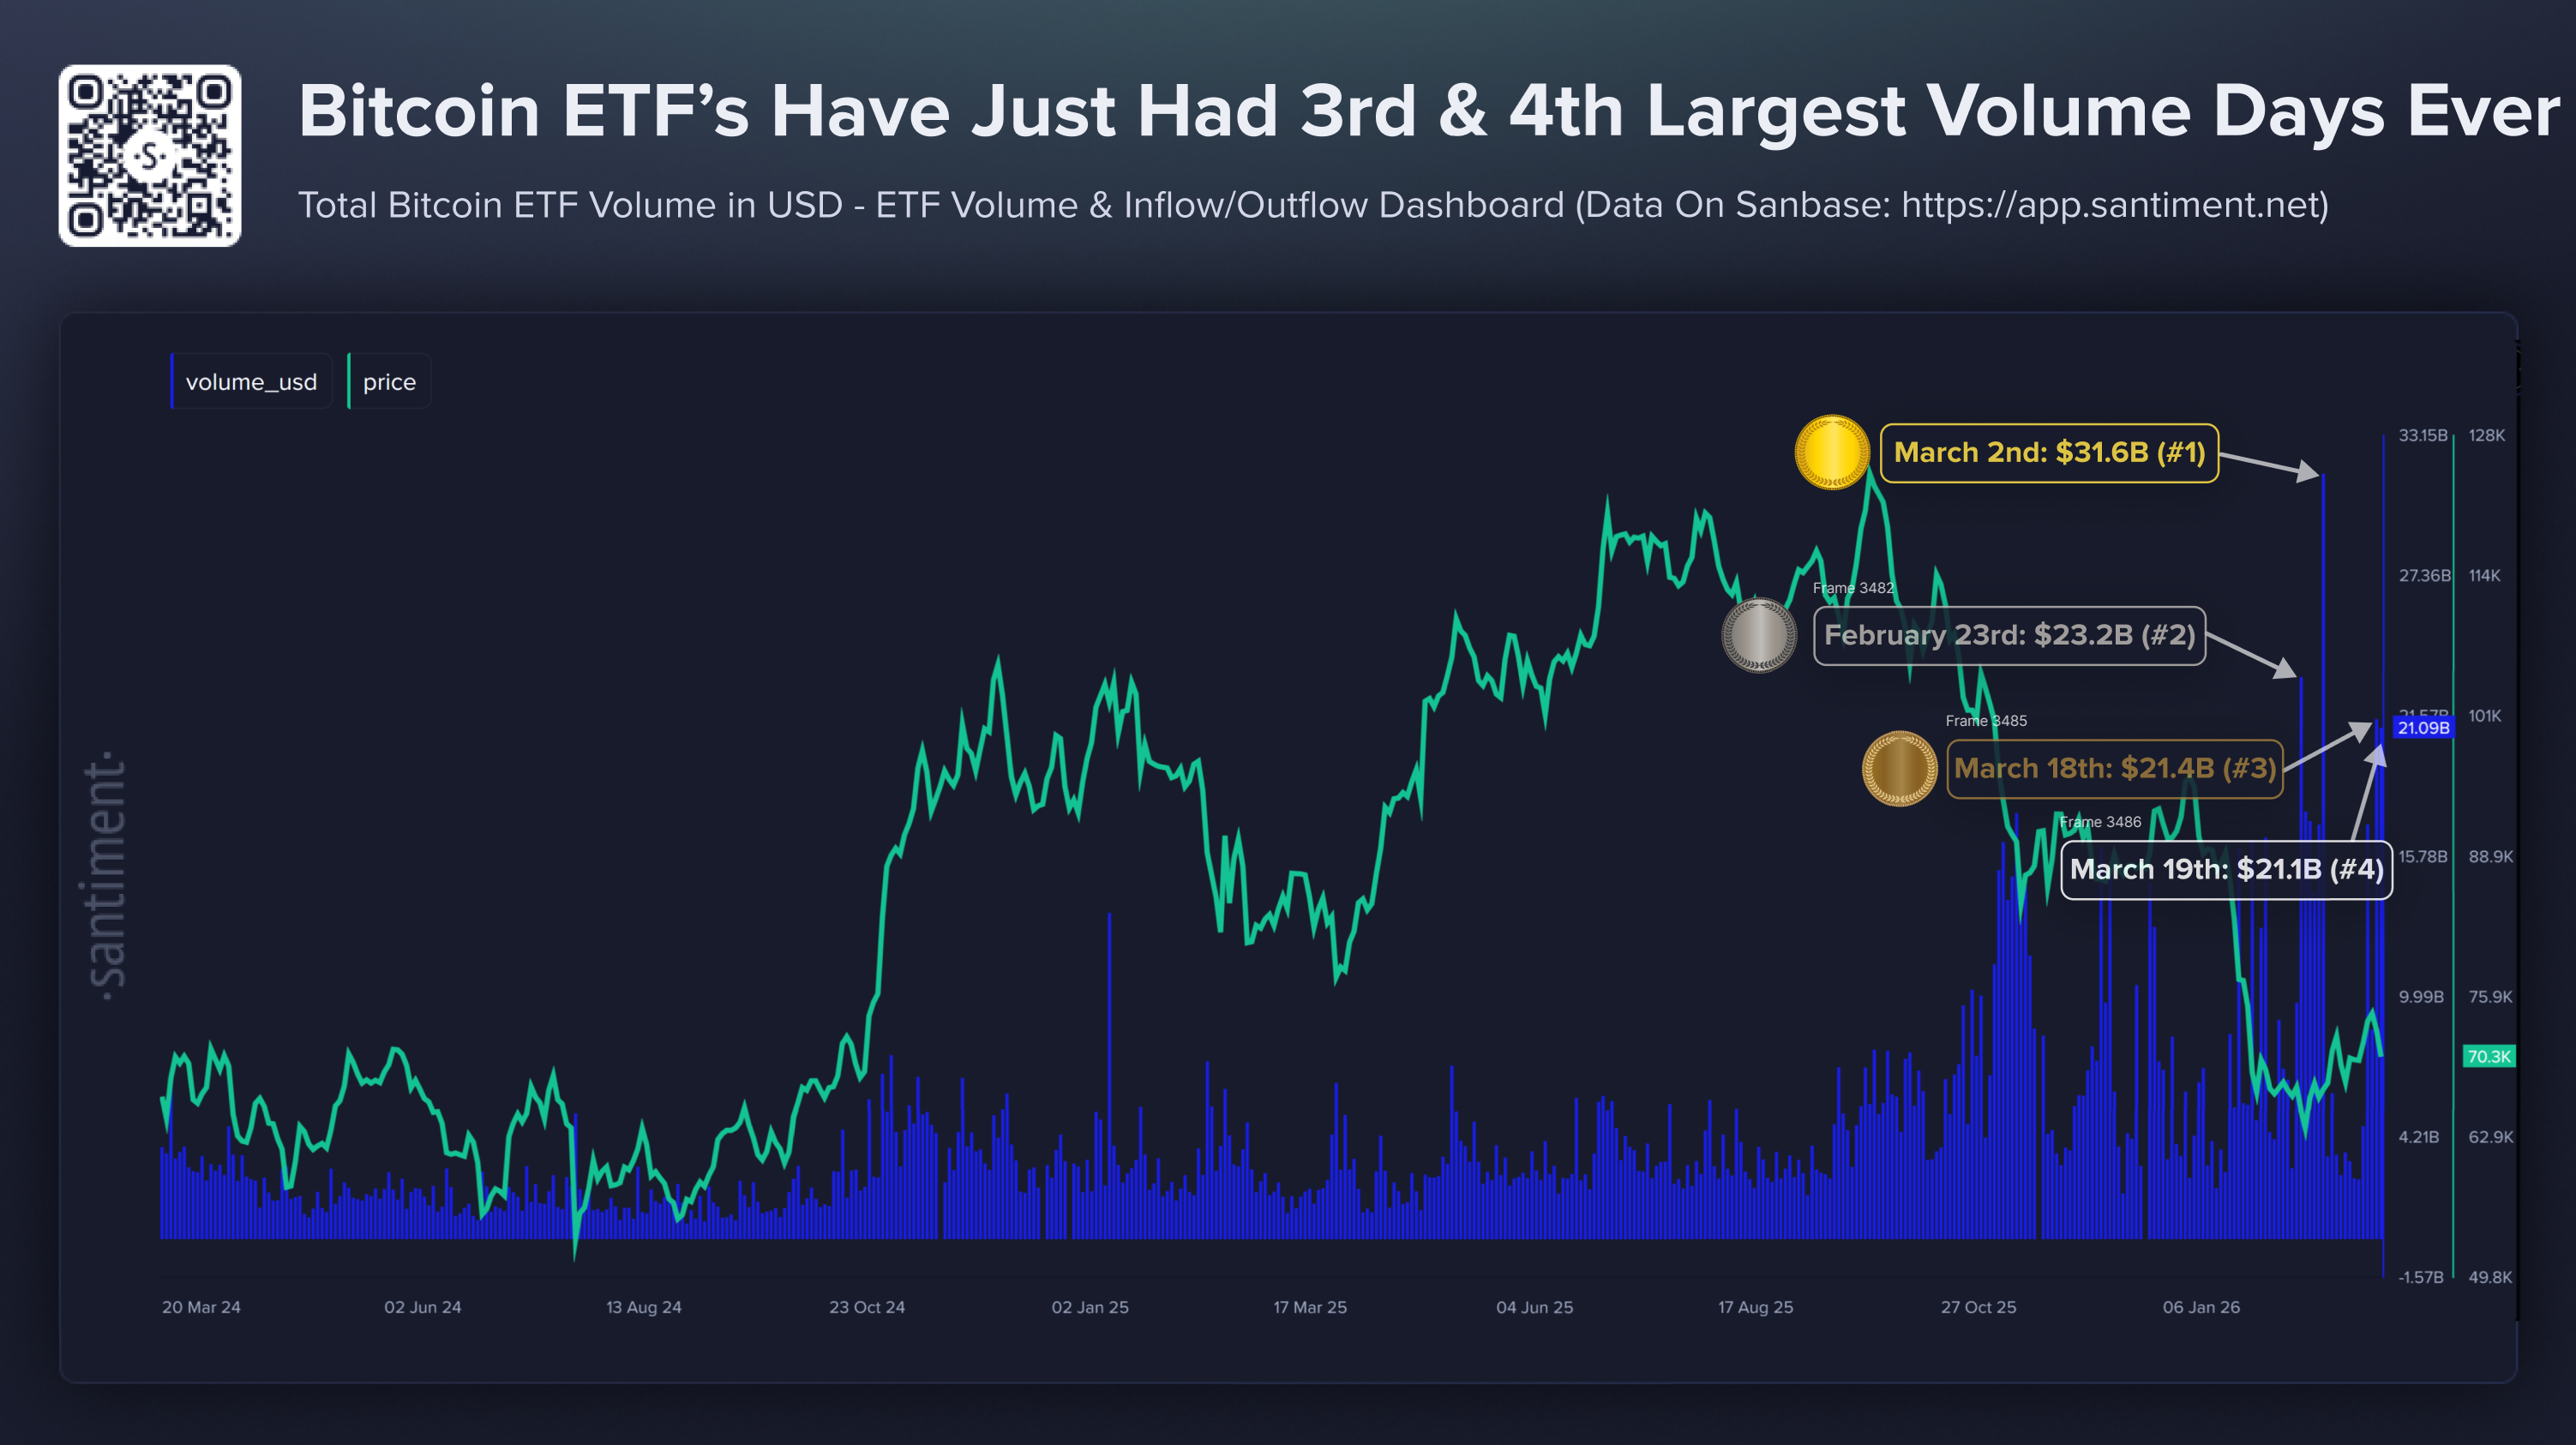
Meanwhile, Bitcoin-focused Exchange-Traded funds (ETFs) have recorded massive volumes over the past week, with daily volumes of $21.4 billion and $21.1 billion over the last two days, marking their third- and fourth-largest volume collections to date. This sudden increase in trading volume aligns with the volatility boost, as the US-Iran war demands active participation from ETFs.
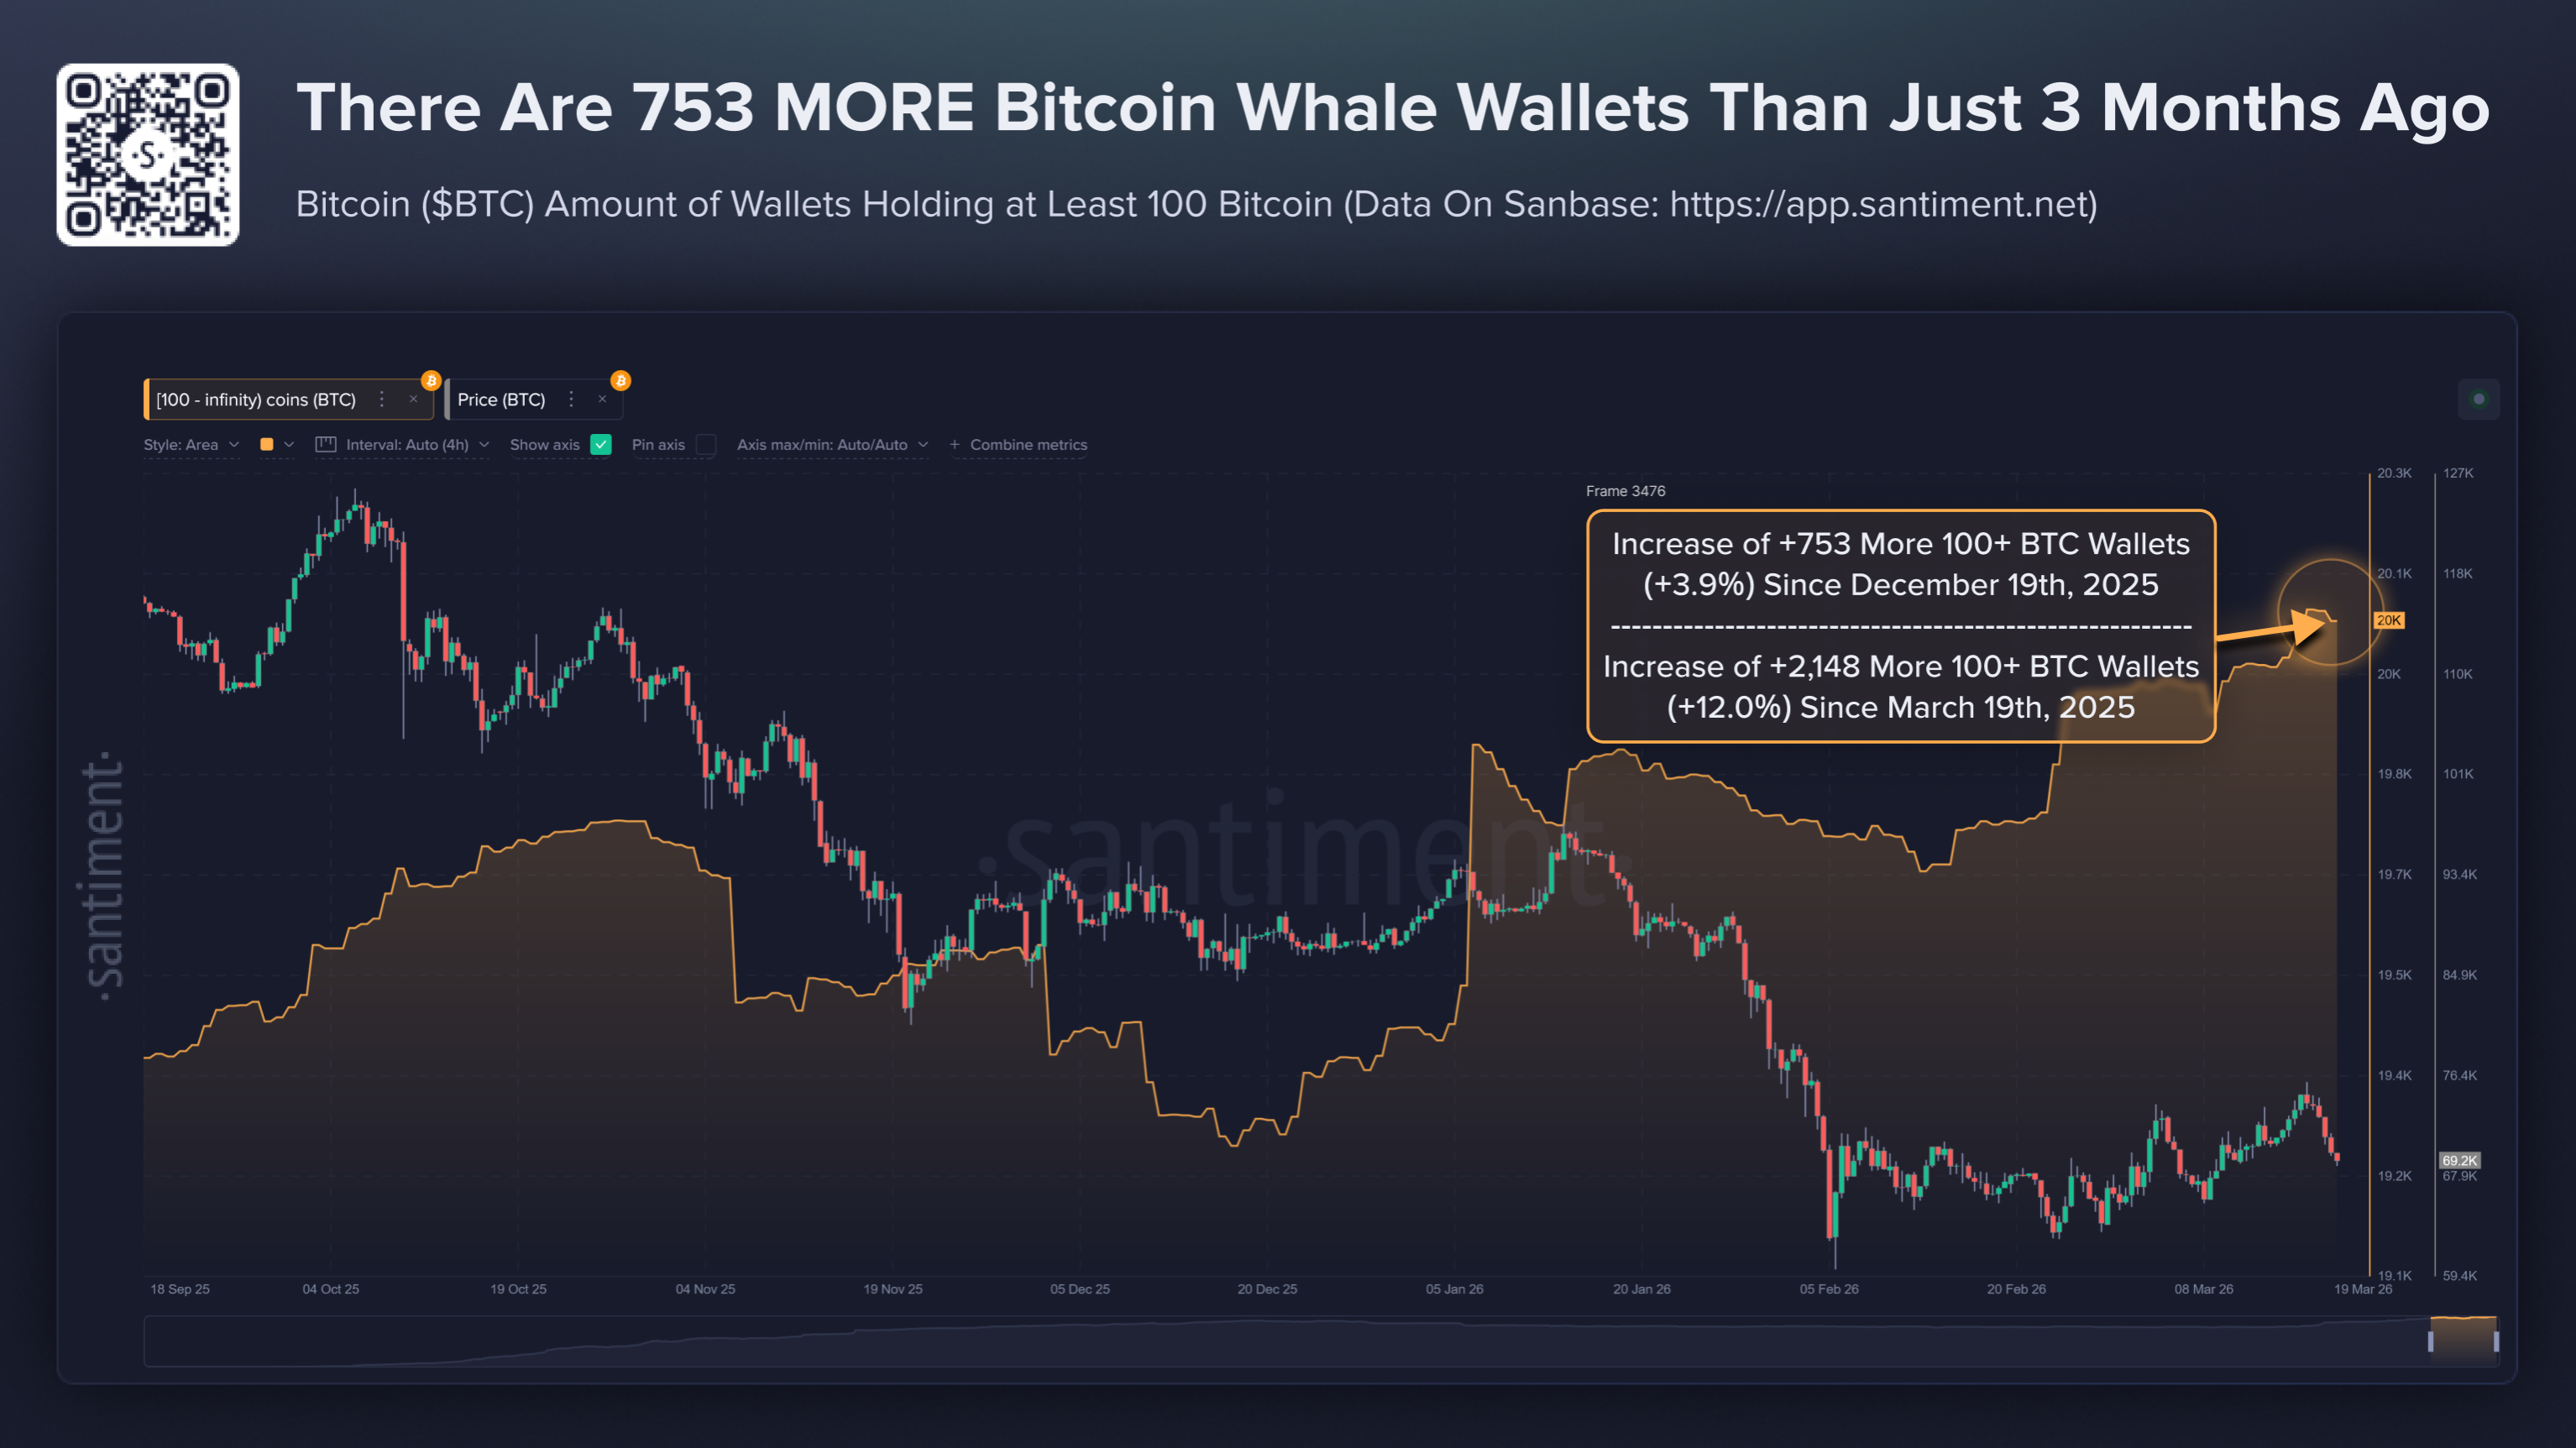
Still, the number of whale wallets holding more than 100 Bitcoin has increased by 3.9% since December 19 and by 12% since March 19, 2025, reflecting strong confidence among diamond hands despite tensions in the Middle East.
Top Crypto Losers: Worldcoin, Zcash, and Toncoin leading losses
Worldcoin is trading below $0.35 at press time on Friday, down 10% from the previous day. The near-term bias is bearish as WLD extends its four-day decline away from the descending 50-day Exponential Moving Average (EMA), which is tracking well below the 200-day EMA and reinforcing a broader downside context.
The latest Moving Average Convergence Divergence (MACD) reading slips further below the zero line with the line under its signal, and the negative histogram expanding, signaling strengthening selling pressure. The Relative Strength Index around 37 stays below its midline, aligning with persistent bearish momentum rather than an oversold inflection.
If WLD slips below the S1 Pivot Point at $0.32, it could extend its decline below $0.30, targeting the S2 Pivot Point at $0.24.
Immediate resistance emerges near the $0.37–$0.40 zone, where recent swing highs cluster just beneath the 50-day EMA, and a recovery above this band would be needed to ease the current downside grip.
Zcash extends its reversal from the 200-day EMA below $250 at the time of writing on Friday. The near-term bias is neutral, with a slight bullish tilt, after ZEC rebounded from the recent $187 trough and now holds above the broken descending resistance line, which was breached near $230 and now underpins the idea of an early trend transition rather than a completed reversal.
Momentum has cooled after the late spike, with the RSI at 48, down from over 60, while the MACD remains above its signal line, suggesting underlying bullish momentum persists despite the pullback.
Initial support is seen around $230, where the trendline break area converges with recent reaction lows, followed by stronger support near $187, which defines the lower boundary of the current recovery.
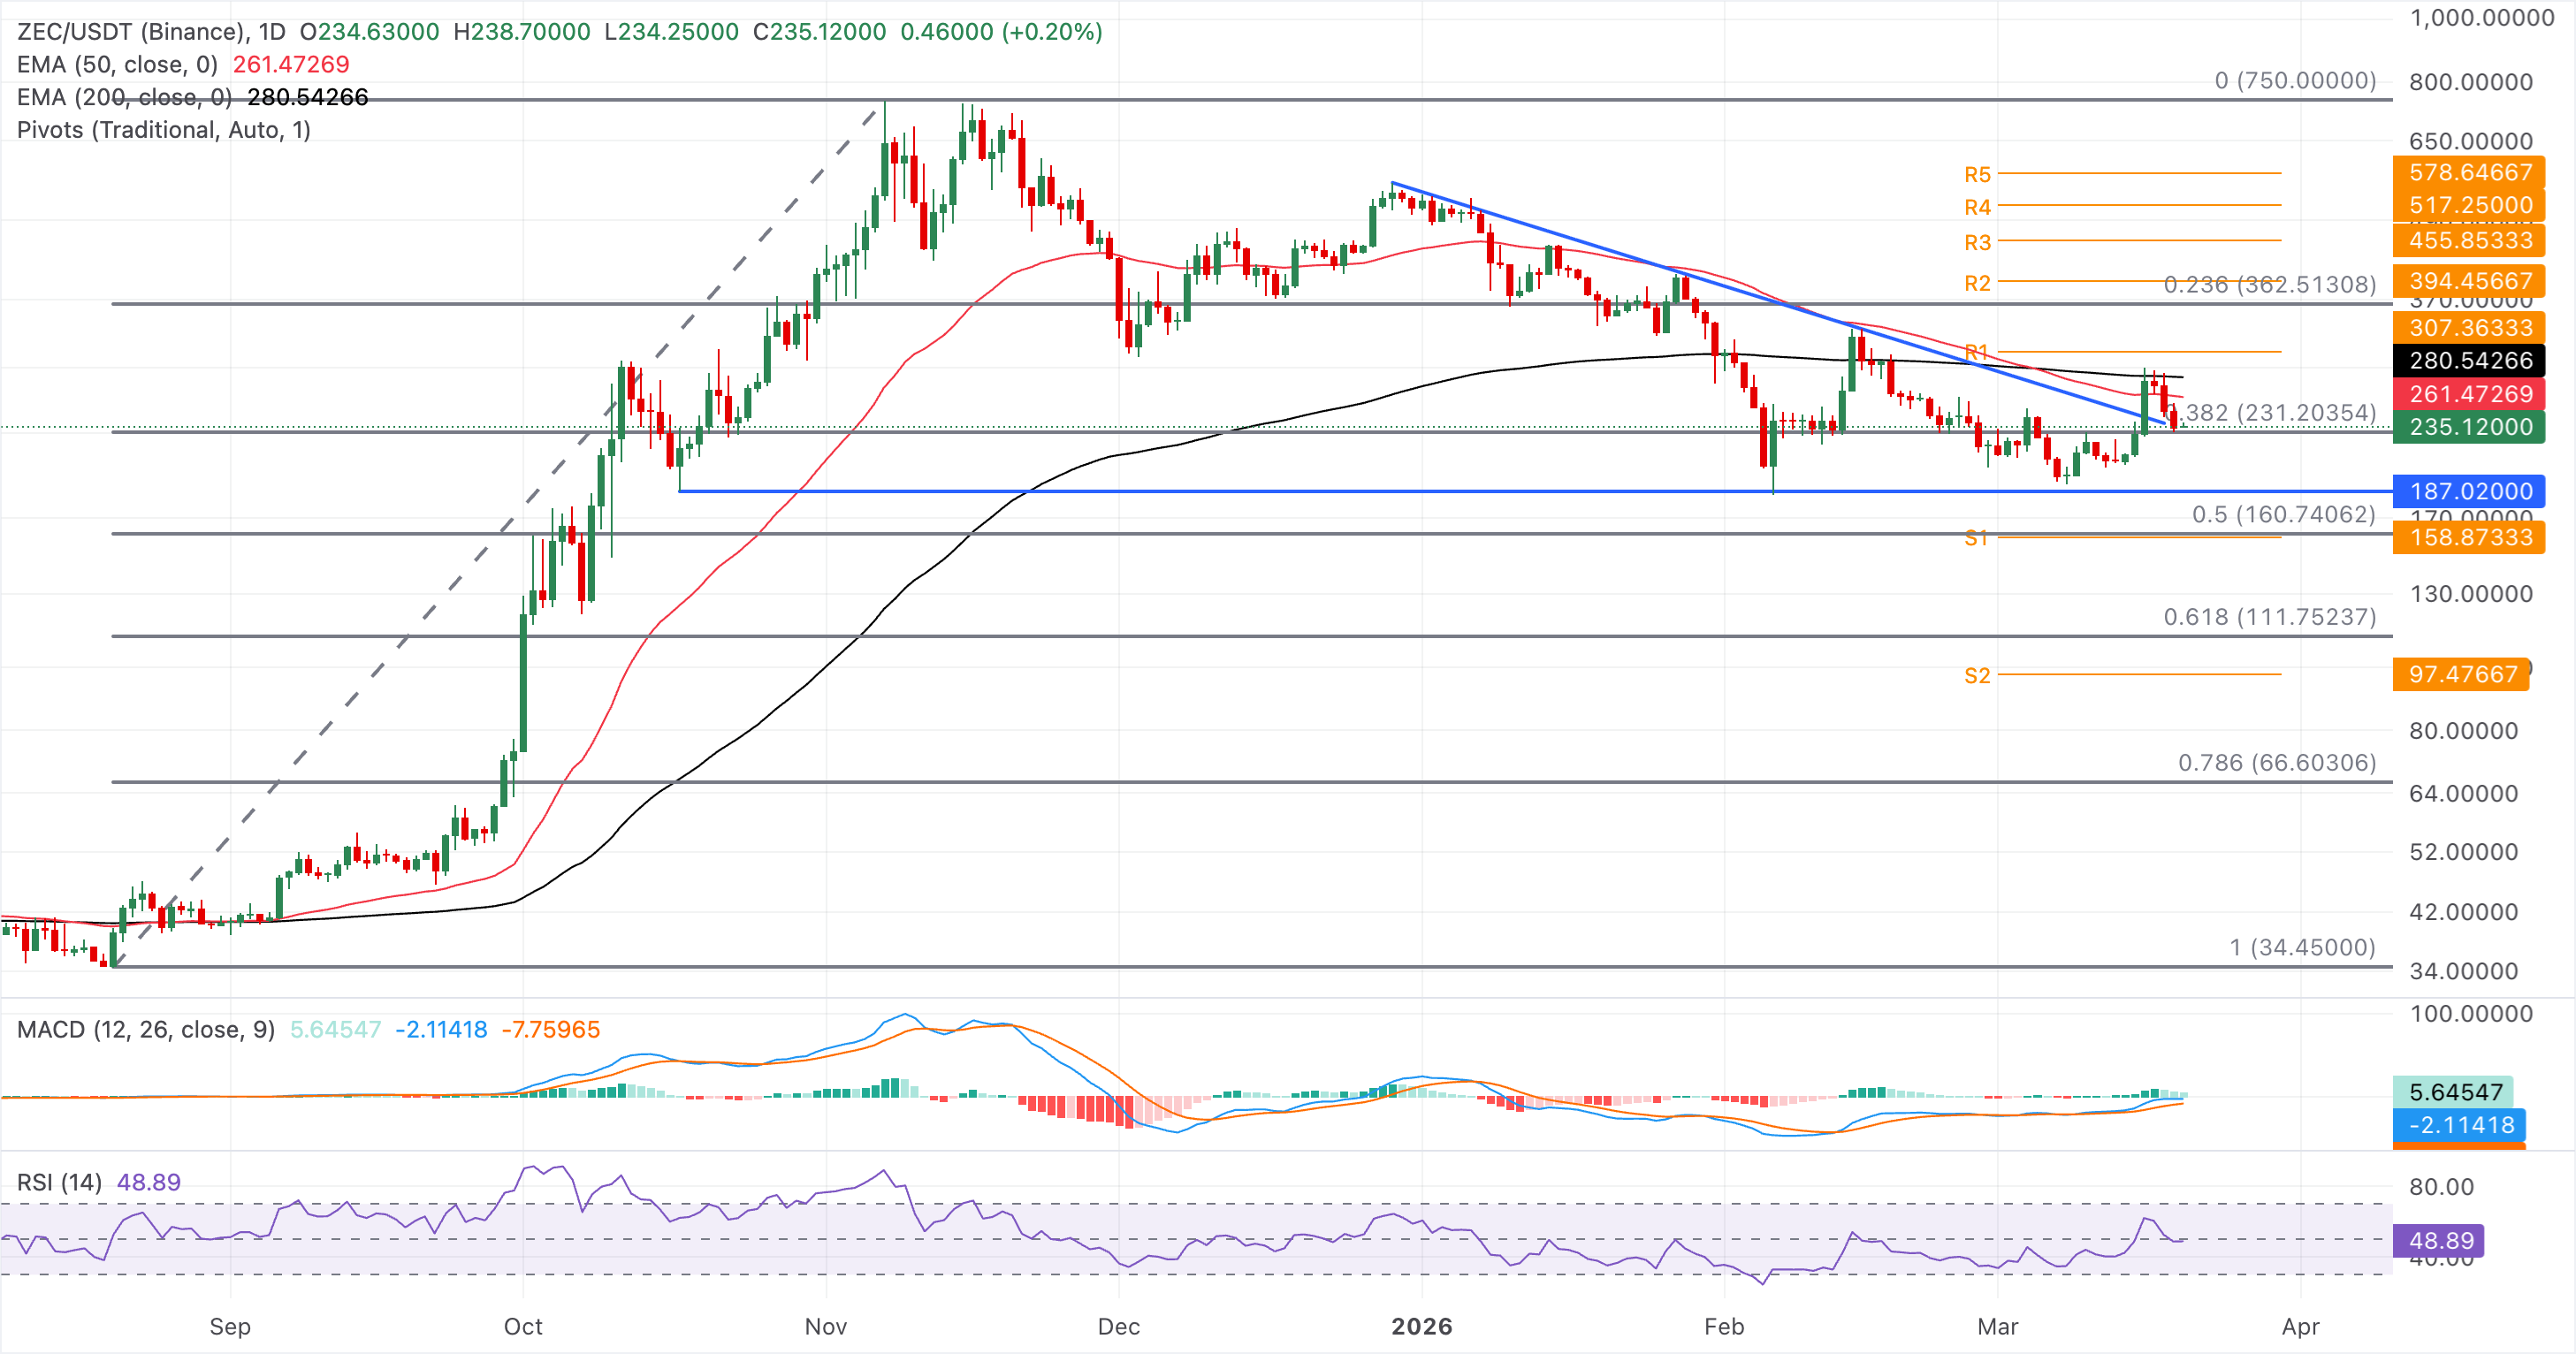
On the topside, immediate resistance aligns with the cluster of recent highs around $275, ahead of the 50‑day EMA at $261.
In the daily chart, TON/USDT trades near $1.20 at press time on Friday. The near-term bias is mildly bearish as price extends its decline beneath the 50-day exponential moving average, while the 200-day average remains well above the market and reinforces a broader downtrend context.
The MACD has slipped back into negative territory with the MACD line below the signal line and a widening negative histogram, indicating strengthening downside momentum. The RSI at 35 signals weak momentum near the lower band of neutral, suggesting sellers retain the initiative without yet reaching oversold conditions.
On the downside, the latest swing low around $1.20 marks immediate support, and a break below this floor would expose the next bearish objective near $1.15, where the pair could search for fresh demand.
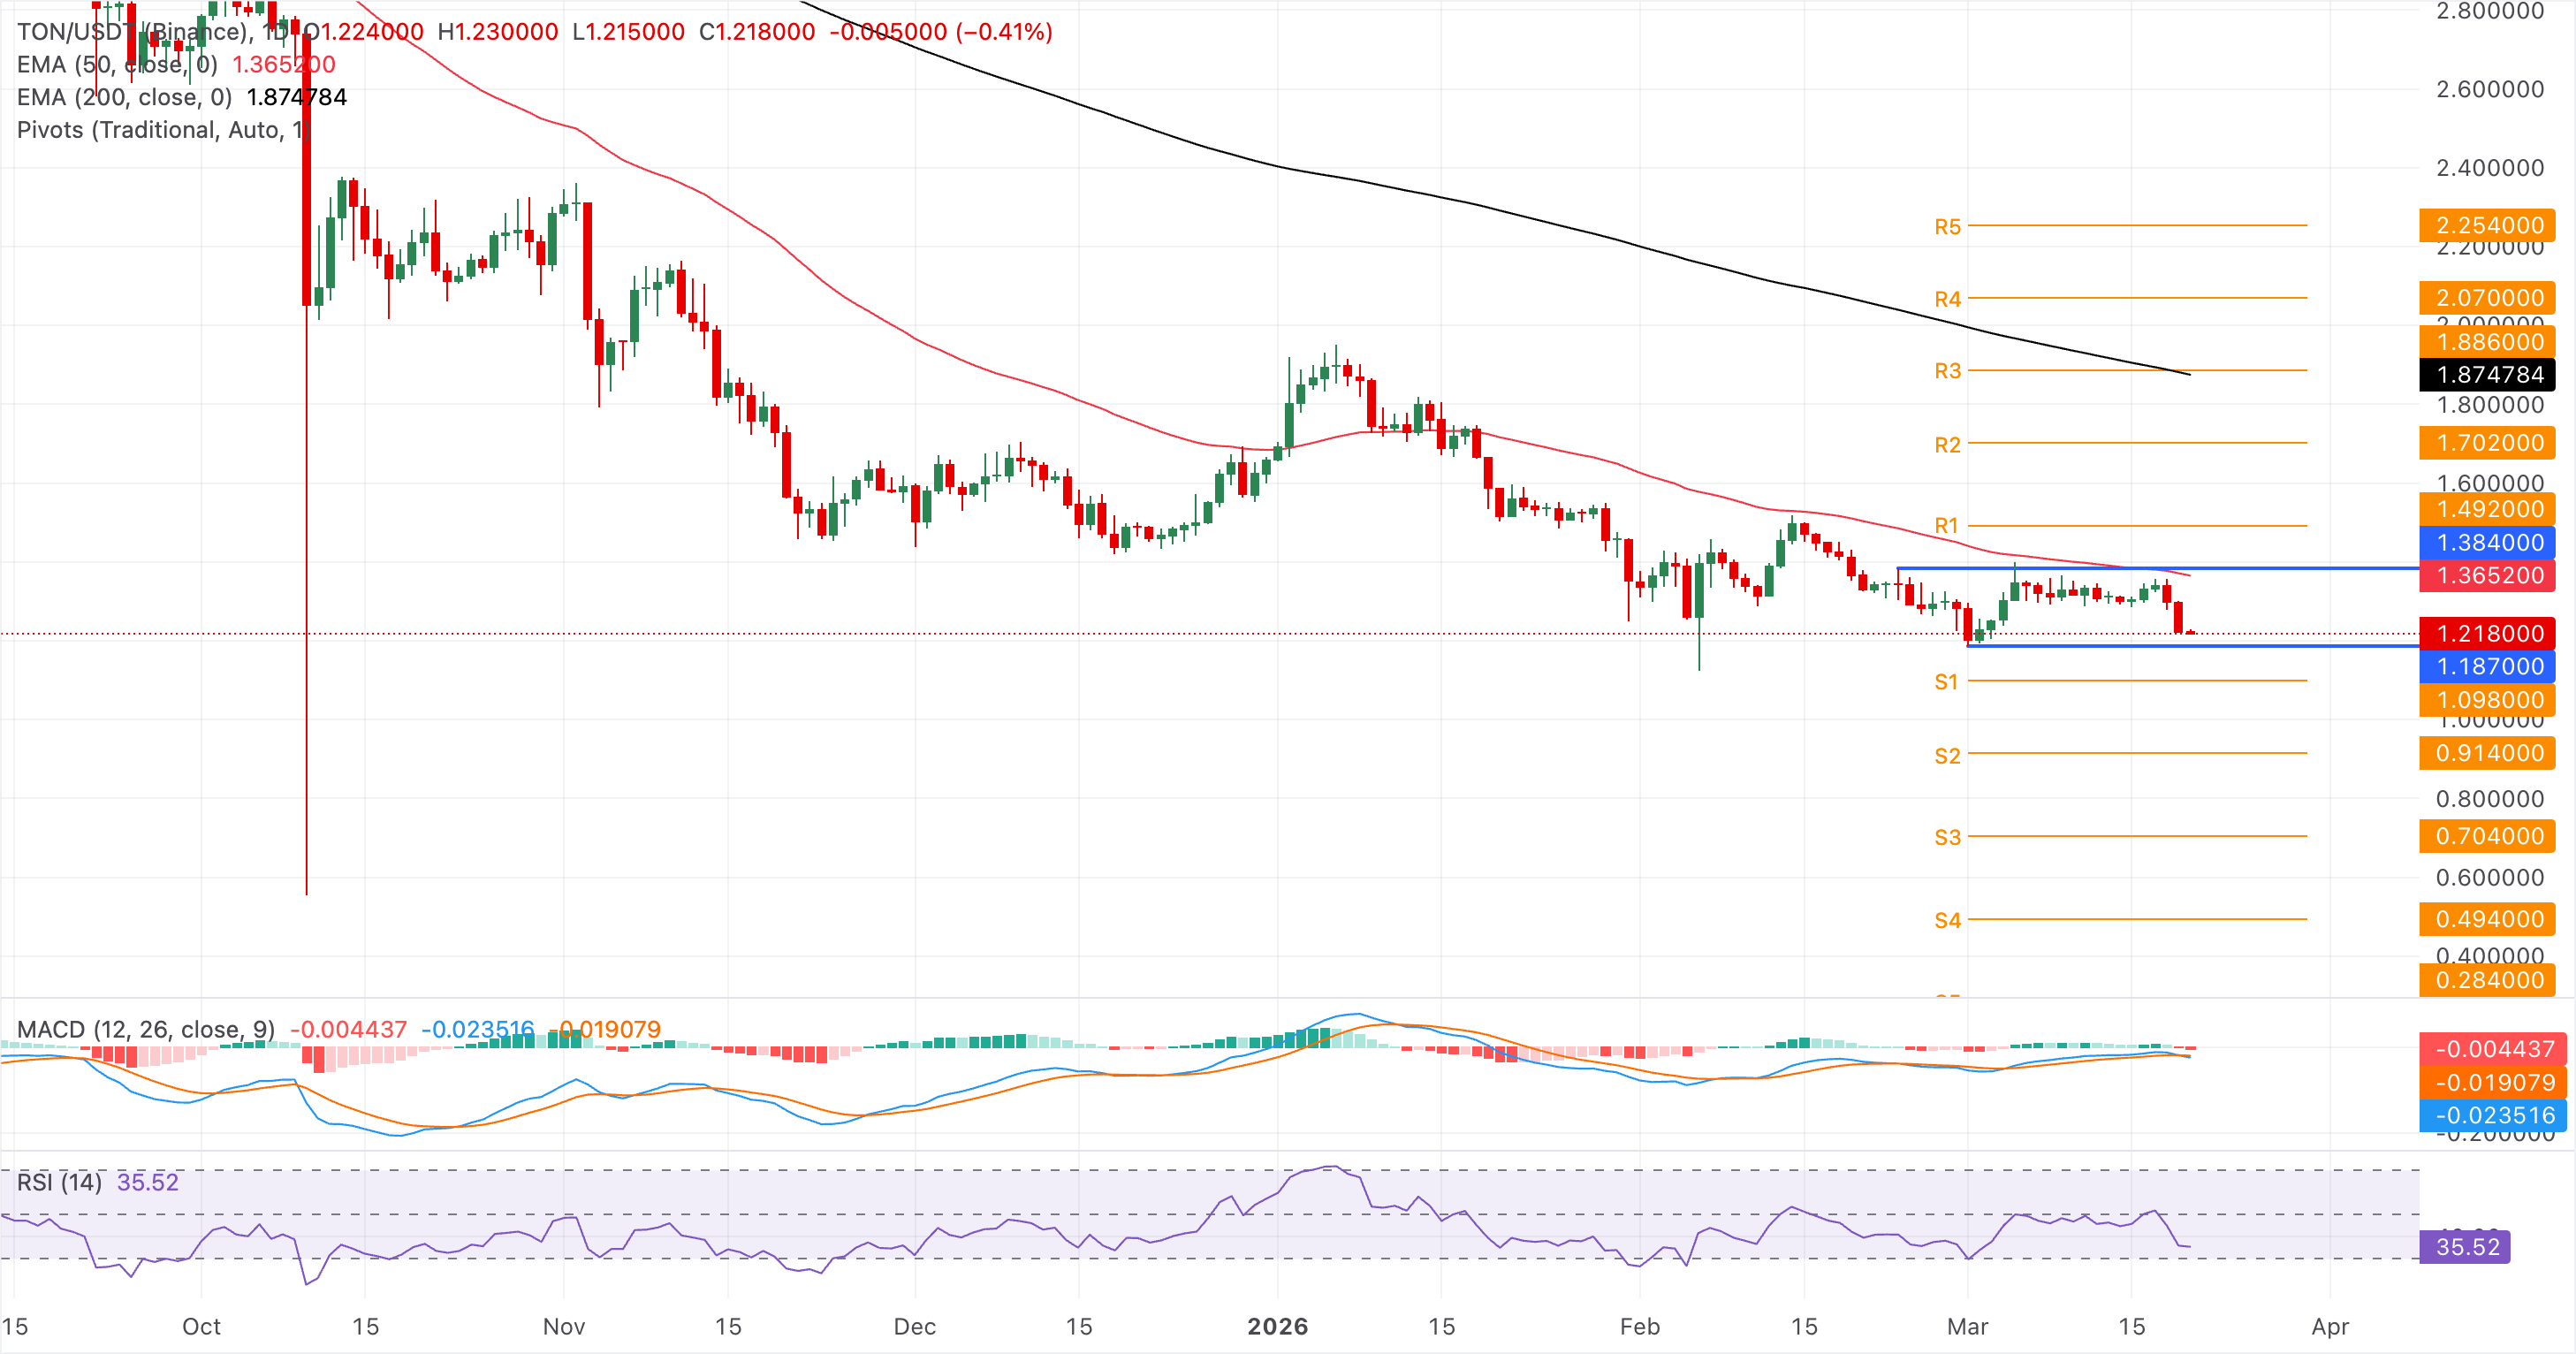
Initial resistance aligns with the recent consolidation area around $1.30, where prior highs cluster ahead of the descending 50-day EMA near $1.36, which caps any rebound within the broader bearish structure. A daily close above $1.36 would be needed to ease immediate pressure and open the way toward the $1.45 zone.
(The technical analysis of this story was written with the help of an AI tool.)

100만 명이 넘는 사용자가 FXStreet를 통해 실시간 시장 데이터, 차트 도구, 전문가 인사이트, 포렉스 뉴스를 이용합니다. 포괄적인 경제 캘린더와 교육 웨비나는 트레이더가 정보를 유지하고 신중한 결정을 내리도록 돕습니다. FXStreet는 바르셀로나 본사와 전 세계 지역에 걸쳐 약 60명의 팀으로 구성되어 있습니다.
더 읽기


