
Crypto Market Overview: Bitcoin nears $73,000 breakout – River, LayerZero, Zcash lead gains
작성자 Vishal Dixit
게시일: 16 Mar 2026 | 수정일: 16 Mar 2026


인기 기사

The cryptocurrency market extends its recovery this week, with Bitcoin (BTC) closing toward $73,000 for a breakout rally, while Ethereum (ETH) and Ripple (XRP) inch closer to $2,200 and $1.50, respectively.
- Bitcoin nears $73,000, Ethereum close to $2,200, and XRP inches toward $1.50 as market sentiment recovers.
- Drop in Gold and Oil prices amid efforts to reopen the Strait of Hormuz reflects an ease in downside pressure.
- River, LayerZero, and Zcash lead the market gains over the last 24 hours.
The cryptocurrency market extends its recovery this week, with Bitcoin (BTC) closing toward $73,000 for a breakout rally, while Ethereum (ETH) and Ripple (XRP) inch closer to $2,200 and $1.50, respectively. A decline in Gold and Oil prices amid the global efforts to reduce tensions in the Middle East and reopen commerce through the Strait of Hormuz, reflecting reduced downside pressure.
Altcoins such as River (RIVER), LayerZero (ZRO), and Zcash (ZEC) are leading the cryptocurrency market recovery over the last 24 hours.
Bitcoin shows signs of recovery
Bitcoin trades above $72,000 at press time on Monday, holding steady after a 10% rise last week. The Crypto King shows bullish compression under the 50-day Exponential Moving Average (EMA) at $72,804.
A decisive break above this level with a daily close could confirm a breakout rally, targeting the 50% trend-based Fibonacci retracement level at $78,258, measured between the October 6 high of $126,199, November 21 low at $80,600, and the January 14 high at $97,924.
Consistent with last week’s recovery, the Moving Average Convergence Divergence (MACD) shows a steady increase and crosses above the zero line amid rising bullish histograms as upside momentum builds. Additionally, the Relative Strength Index (RSI) at 56 rises above the midline with a similar upward trend, reaffirming the bullish bias in trend momentum.
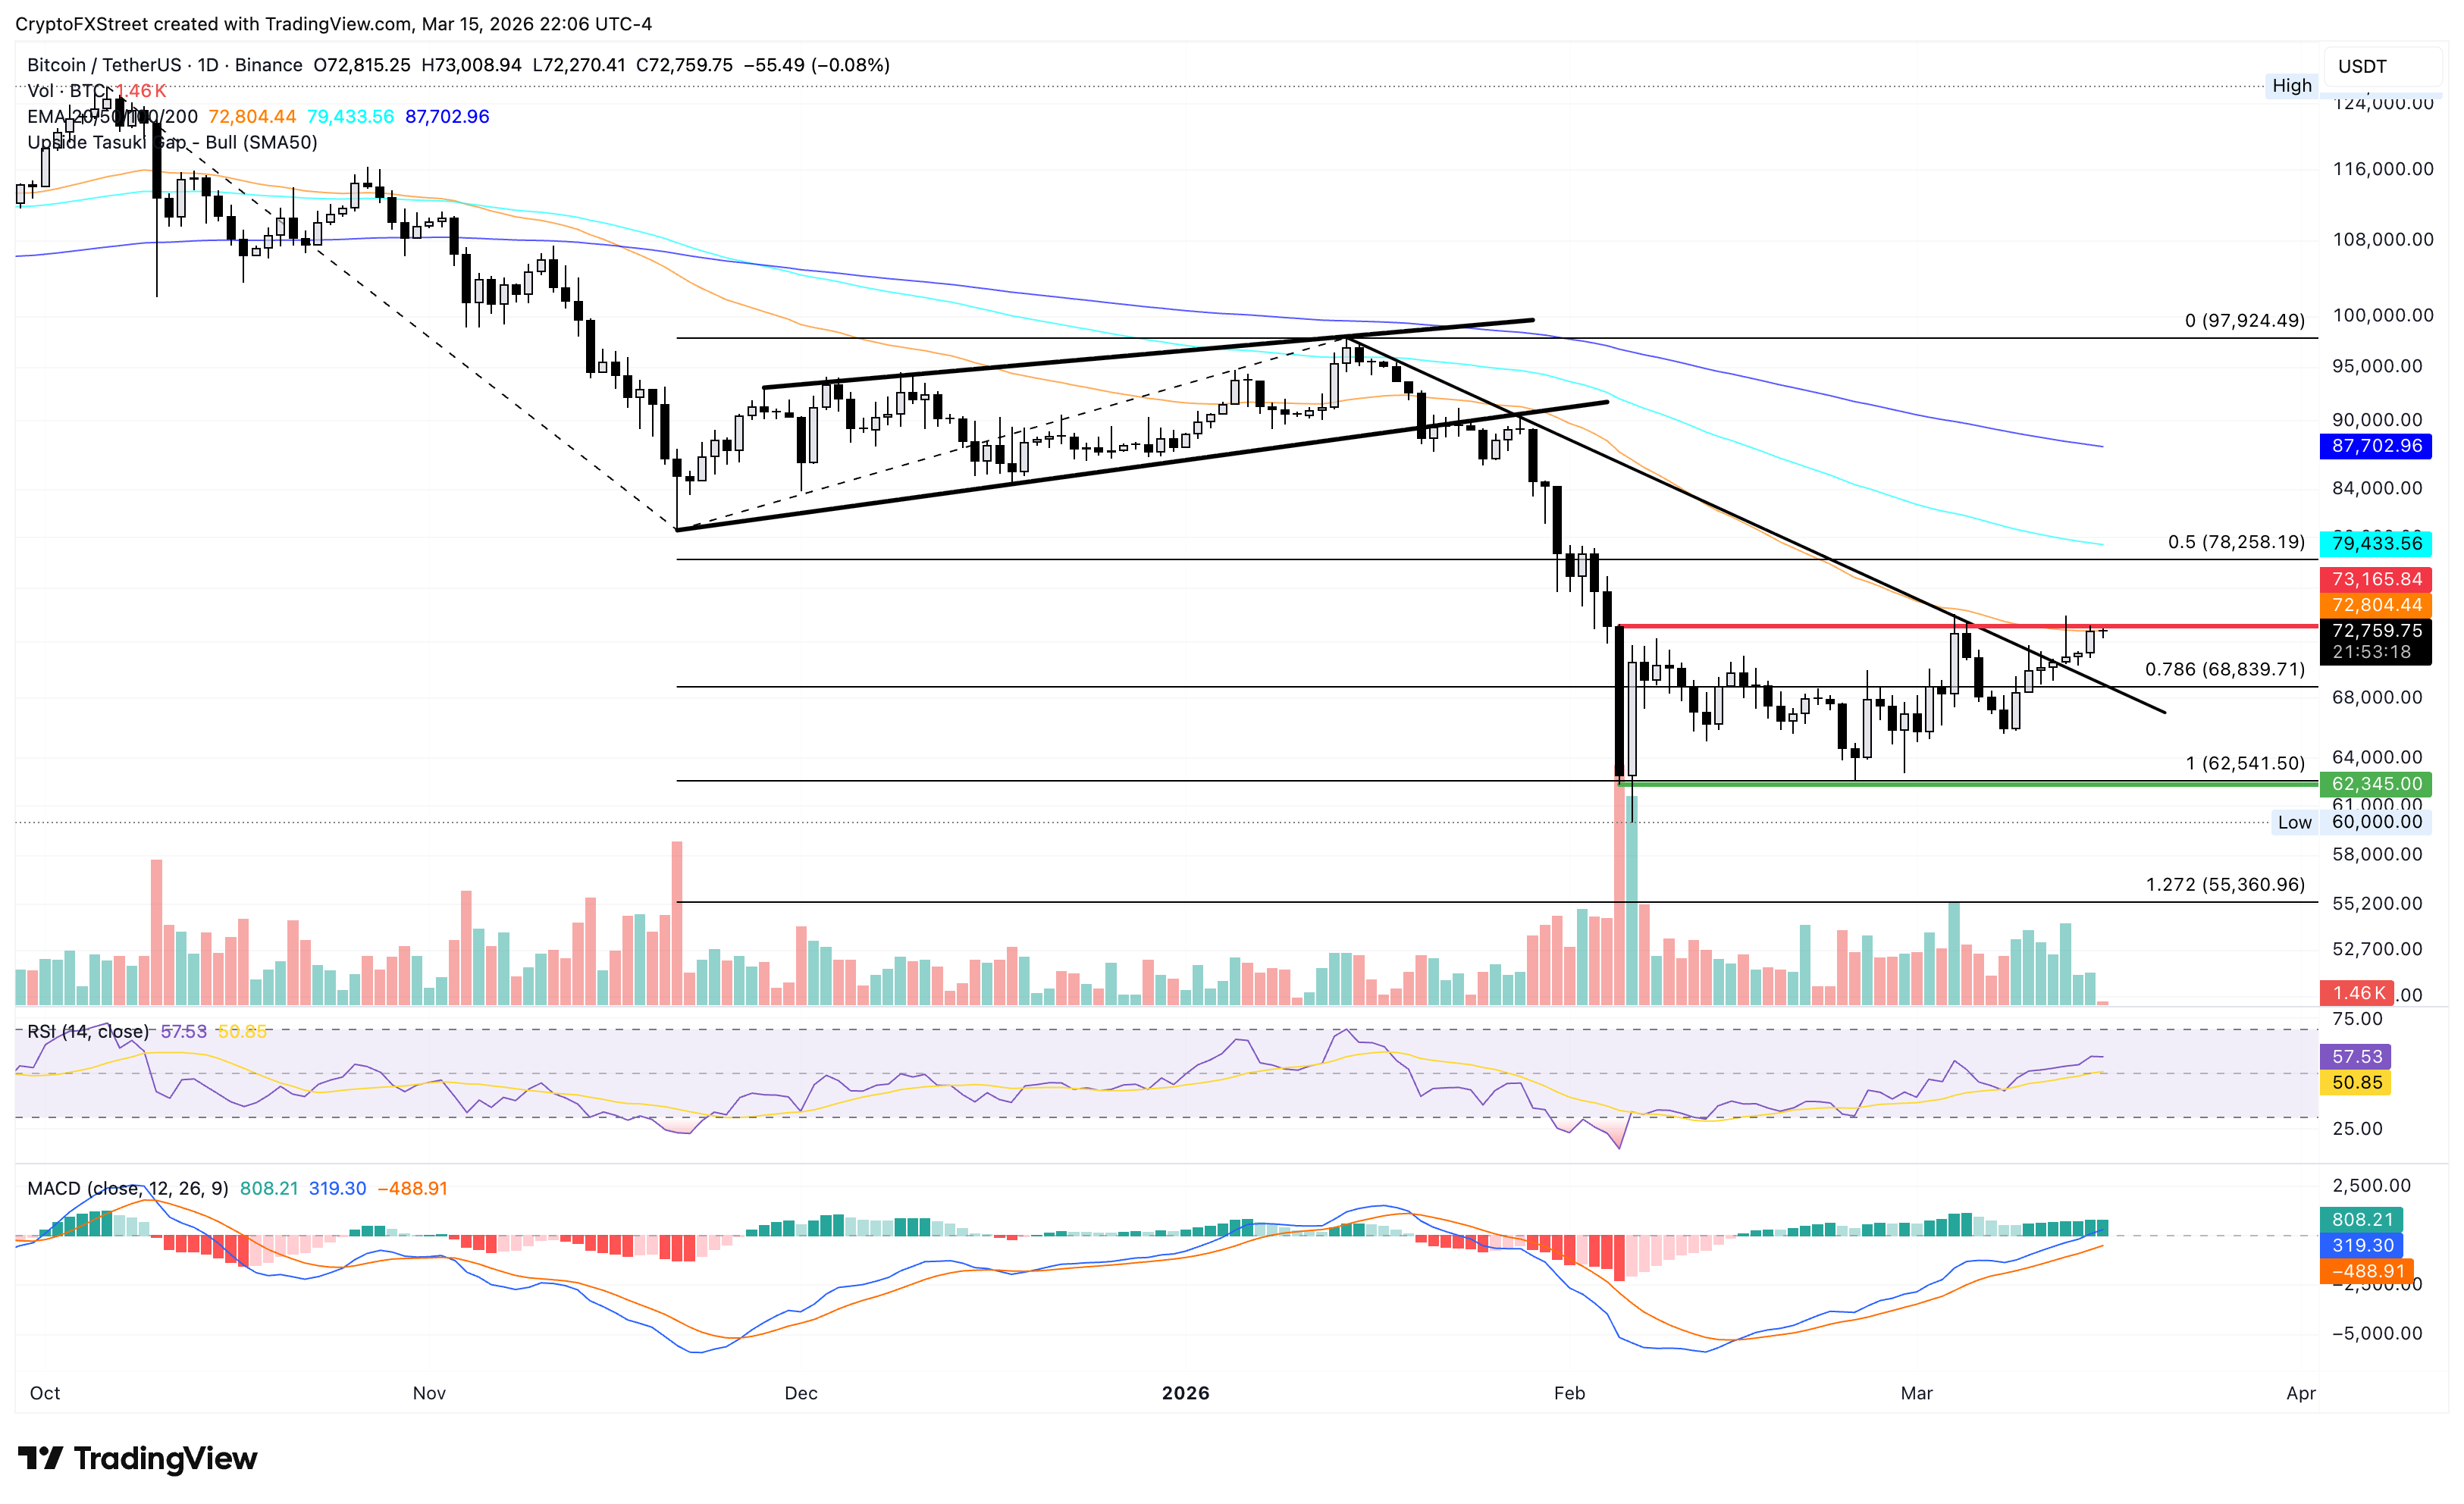
A bearish close to the day would reaffirm downside pressure on Bitcoin, leading to a decline toward the $70,000 round figure.
Crypto market sentiment improves amid consistent ETF flows
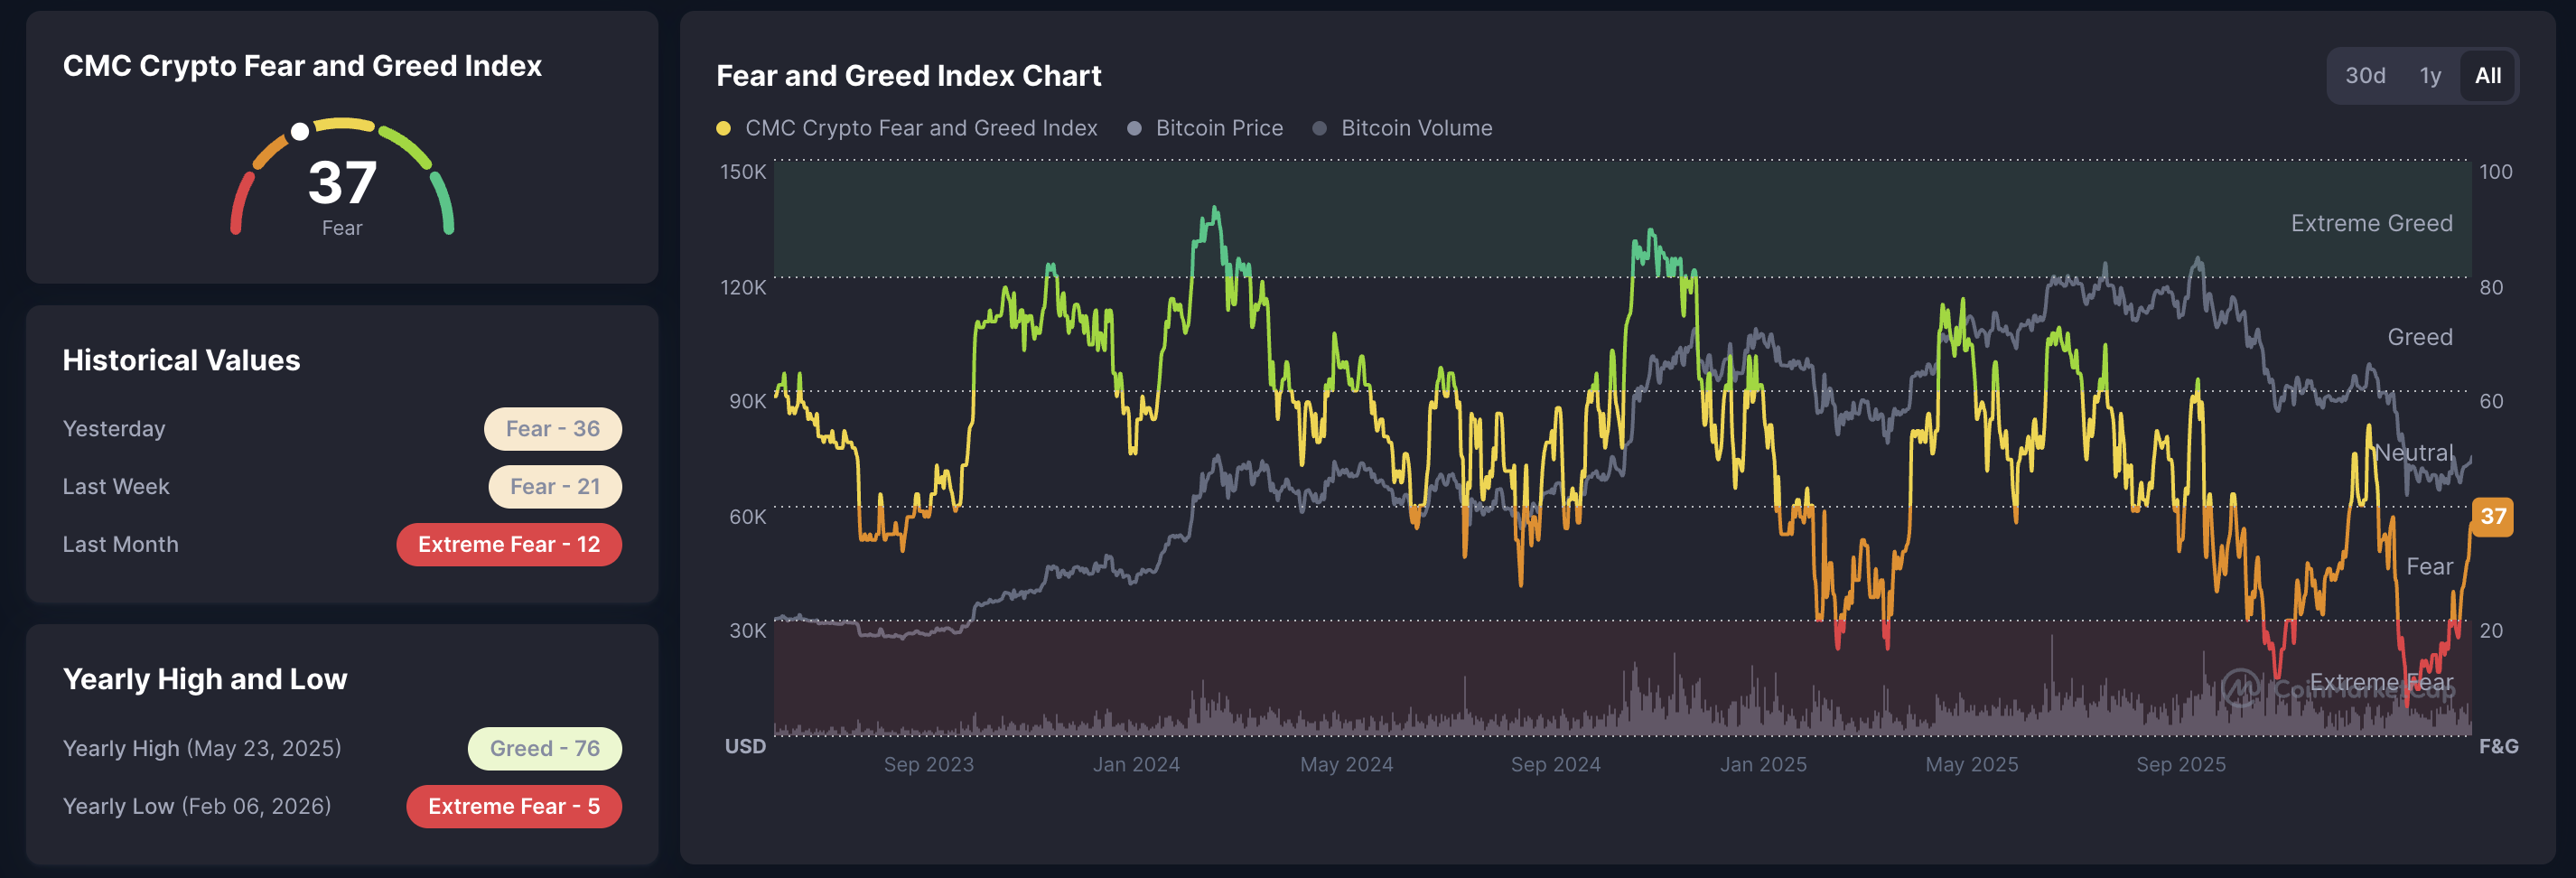
CoinMarketCap’s Fear and Greed Index stands at 37 on Monday, approaching a neutral market sentiment from 16 on March 1, which reflected extreme fear. A steady improvement in crypto market sentiment aligns with broader market hopes for the Strait of Hormuz reopening soon to stabilize the oil supply route.
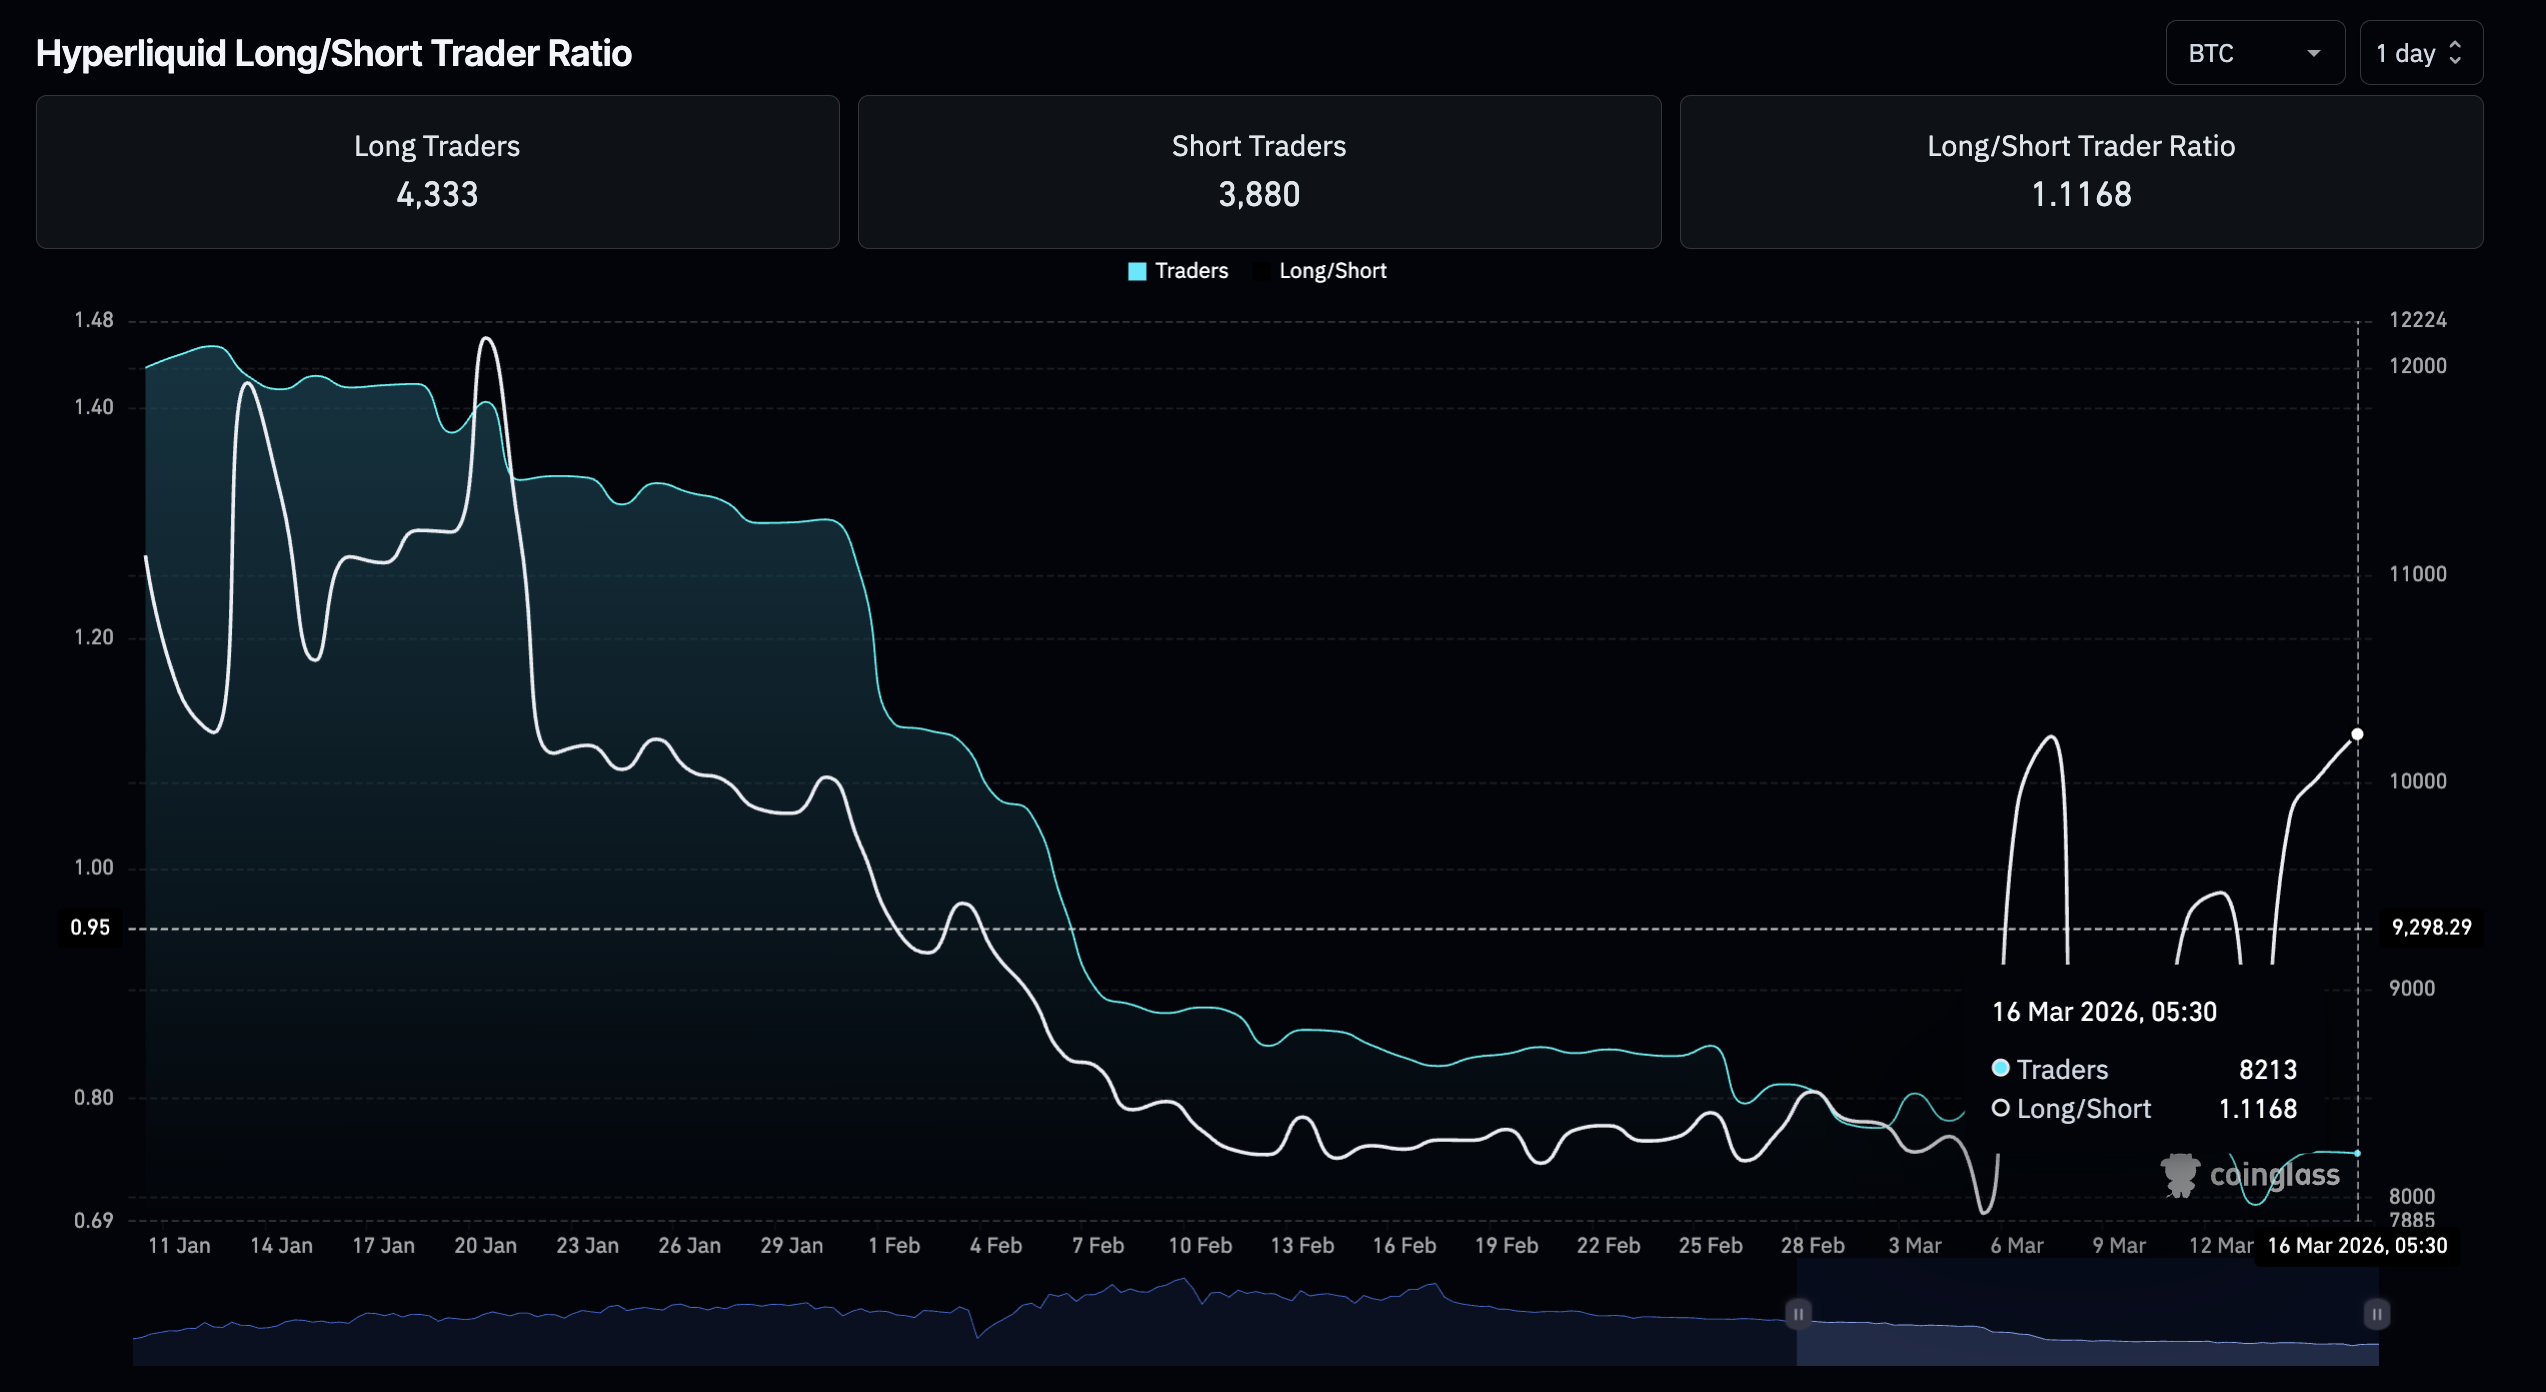
Meanwhile, the traders on Hyperliquid are quite bullish on Bitcoin, anticipating an extended recovery this week. CoinGlass data shows that 82,13 traders are active on Monday, driving the long-to-short ratio to 1.1168 from 1.0847 on Sunday, reflecting a greater number of long positions.
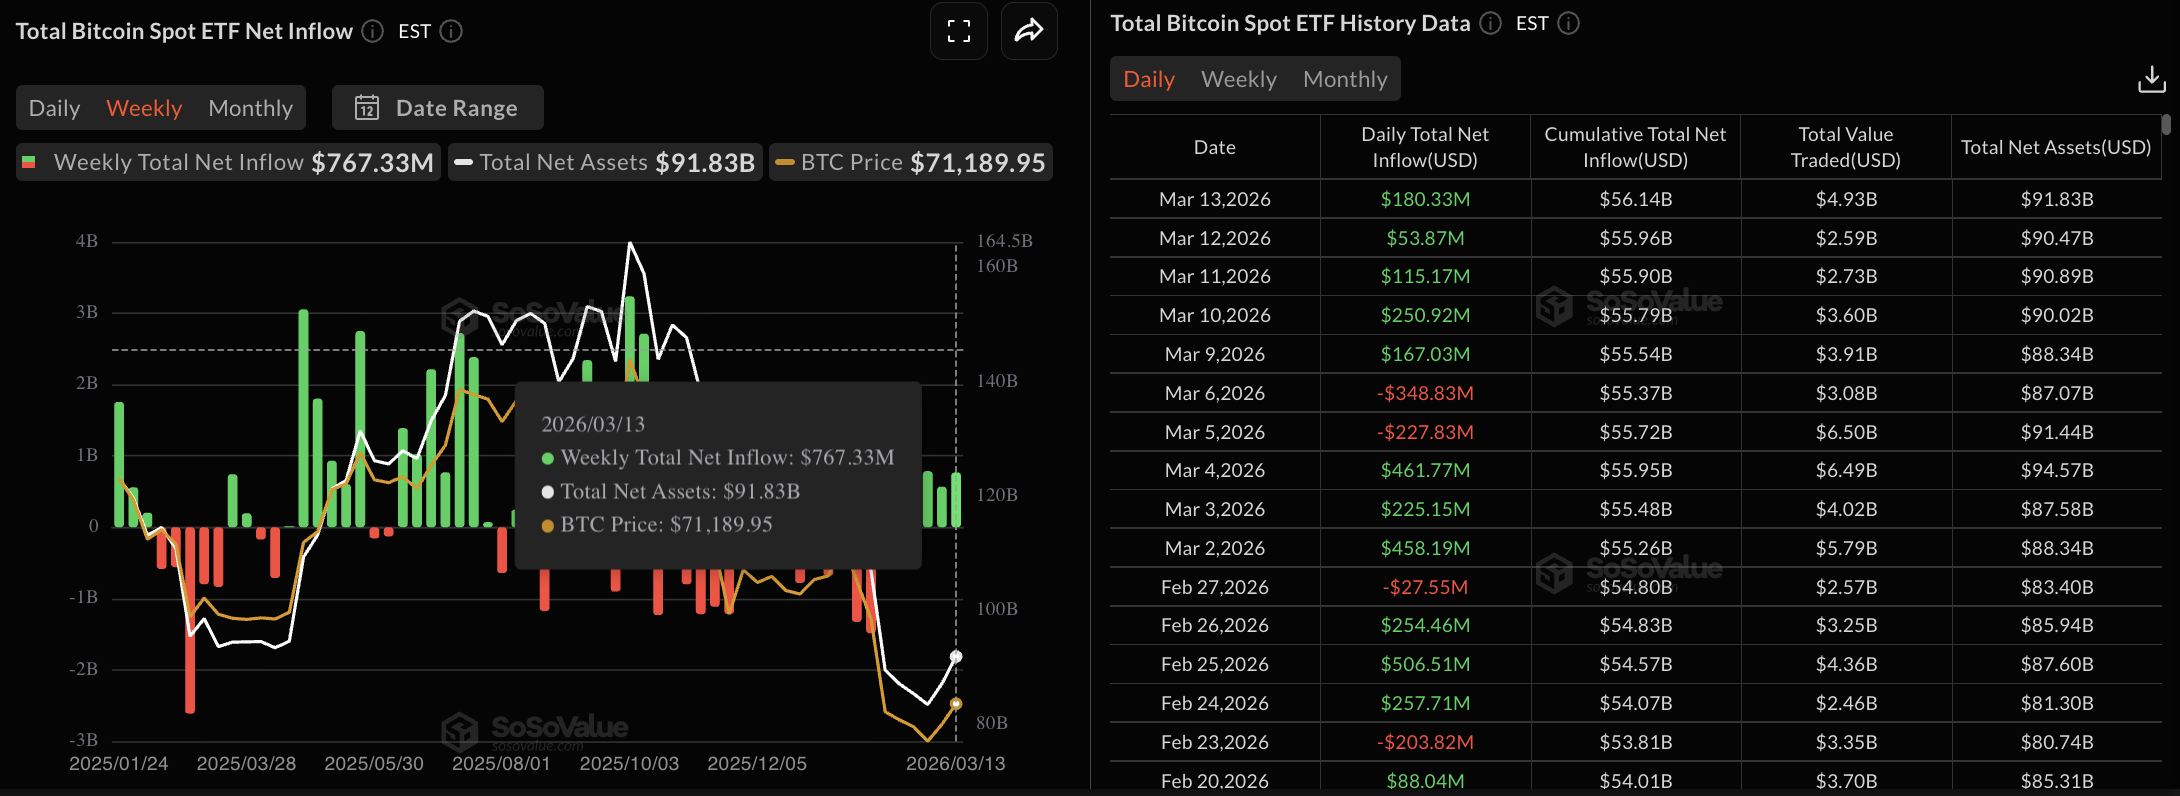
On the other hand, institutional demand for Bitcoin is showing signs of recovery, with five consecutive days of inflows last week totaling $767.33 million. This marks the third consecutive week of inflows, driving the cumulative net inflow to $56.14 billion.
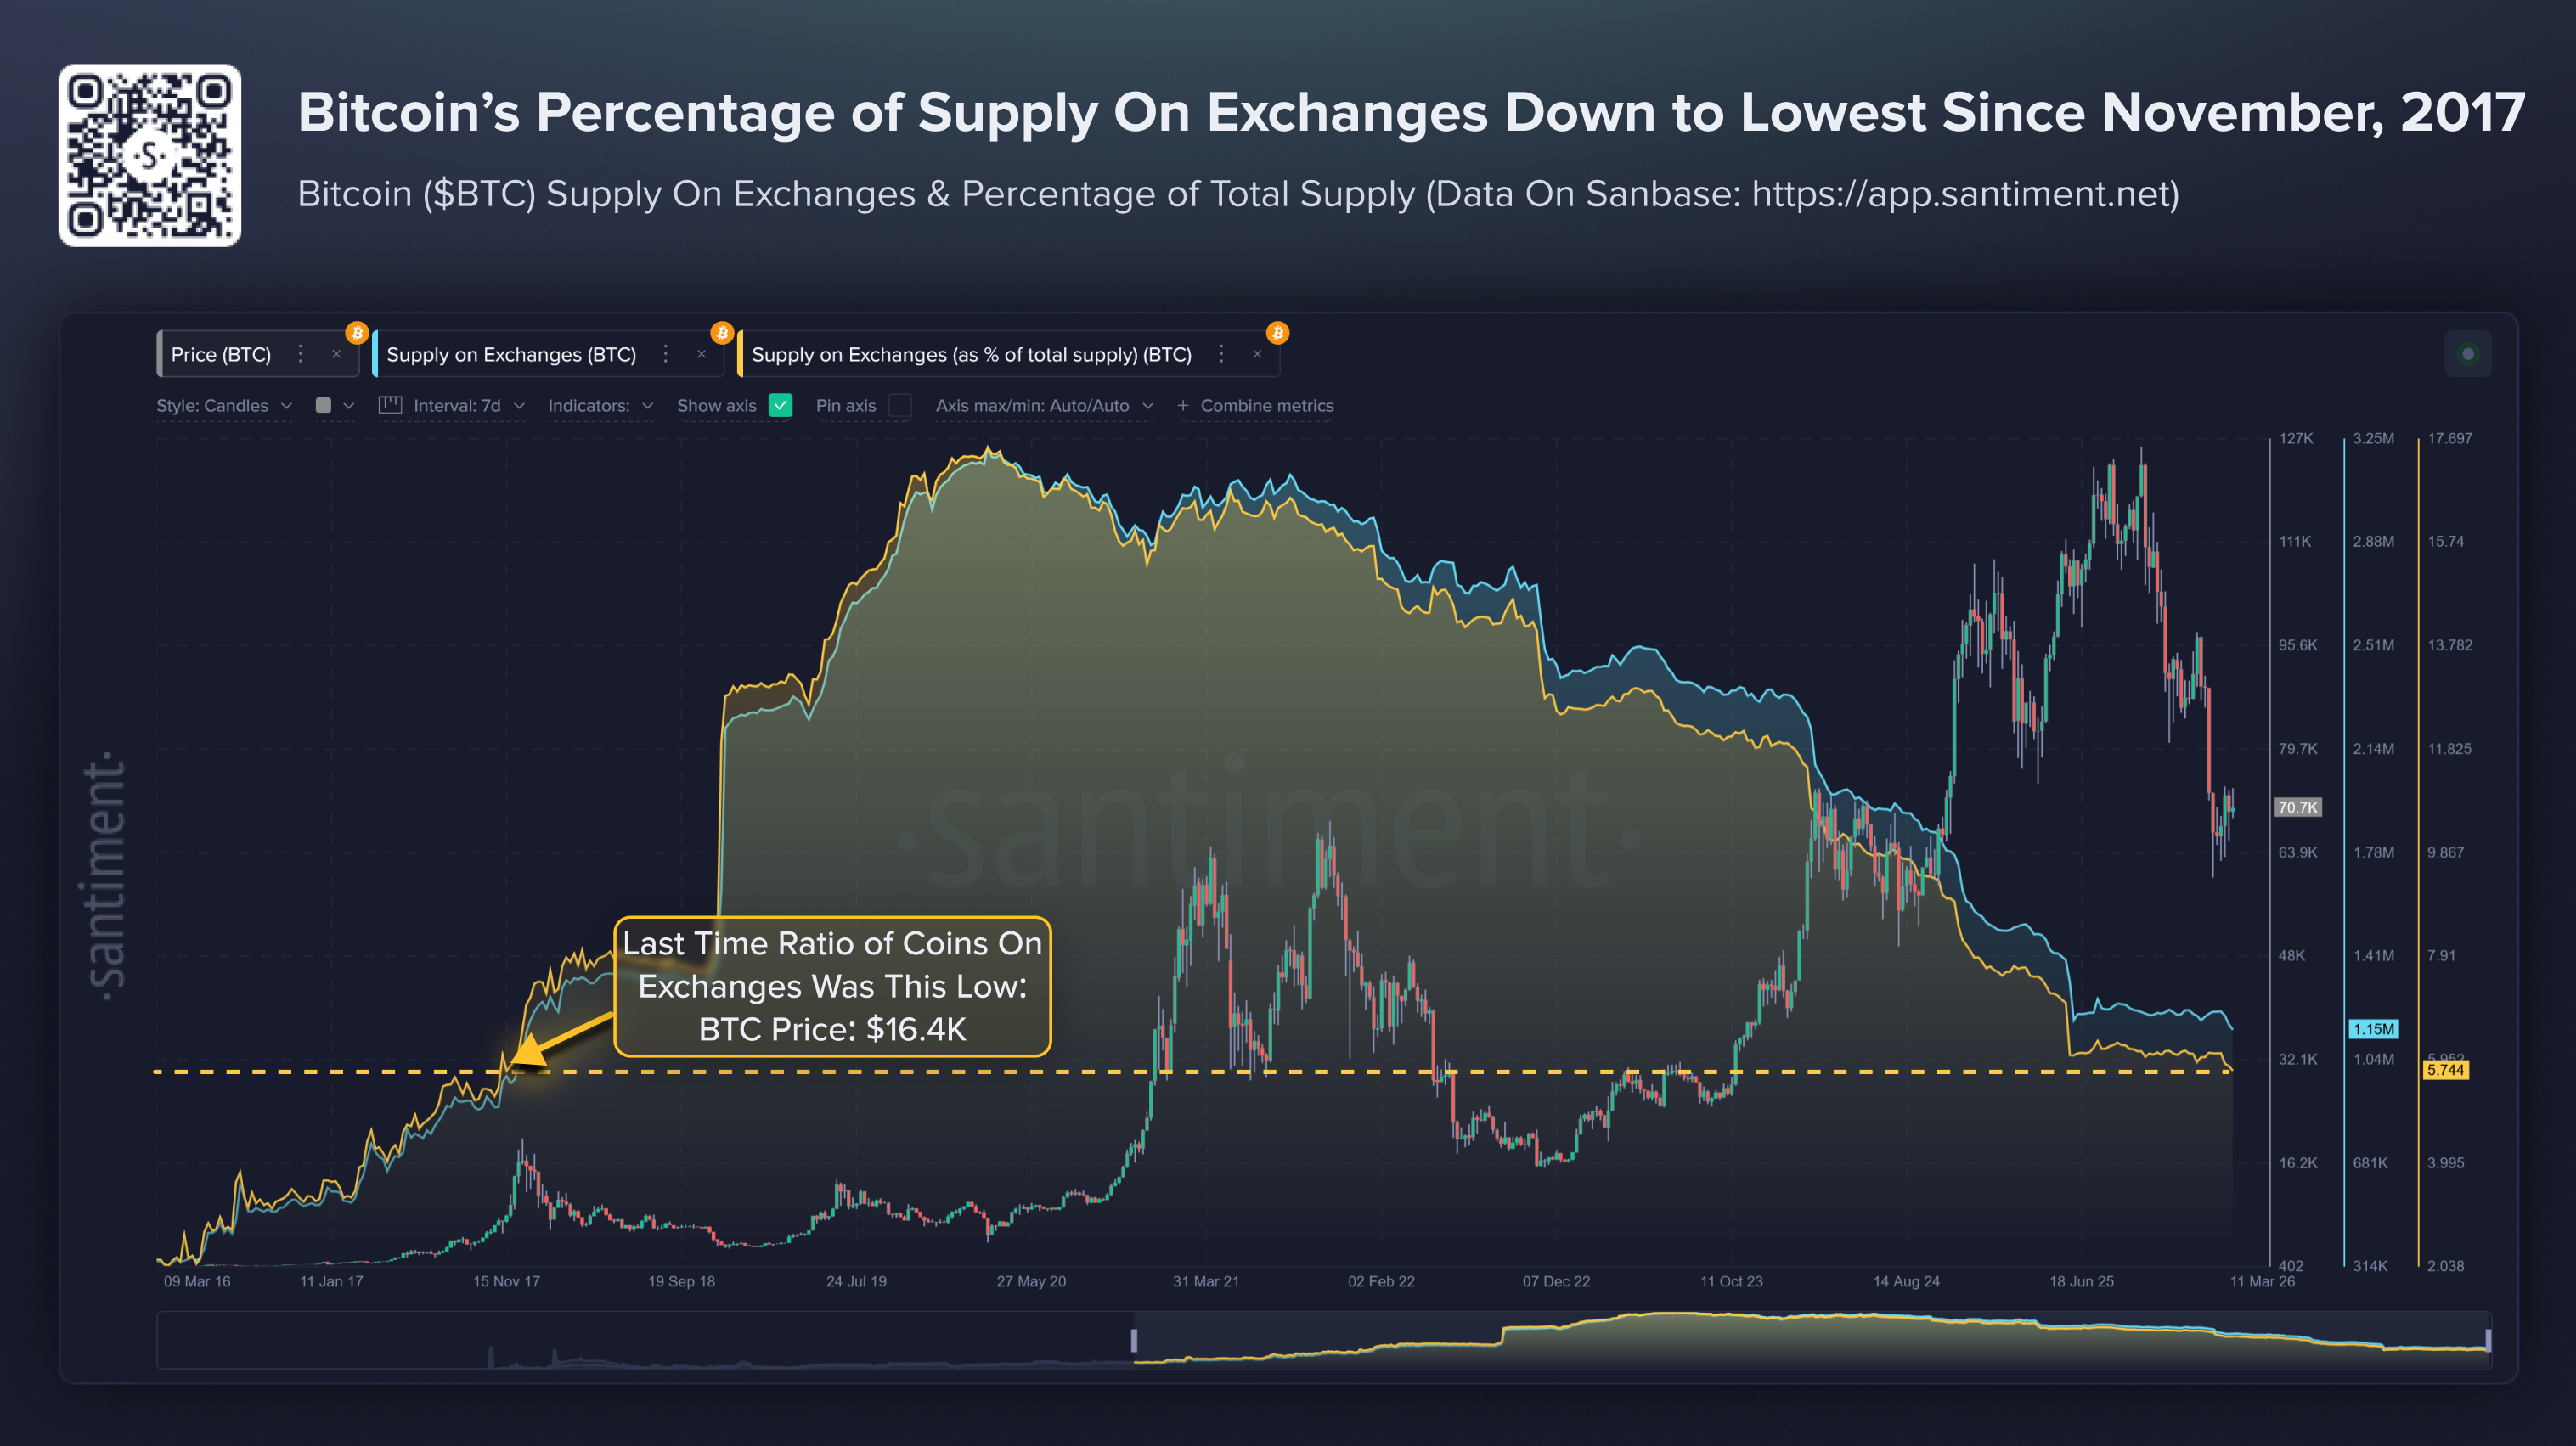
Amid renewed demand, the falling Bitcoin supply on exchanges limits the available selling pressure. Santiment data shows that Bitcoin exchanges' reserves are down to 1.15 million BTC, while the percentage of Bitcoin's total supply is down to 5.744%, the lowest since November 2017. The data suggests that, despite the increase in BTC's available supply, the share of BTC supply on exchanges is decreasing, likely linked to increased institutional interest.
Top Crypto Gainers: River, LayerZero, and Zcash
River extends its recovery above $20 after a 37% rise last week. At the time of writing, RIVER faces downside pressure from the zone near the 50% retracement level at $25.22, measured from the $87.60 high to the $7.26 low.
A daily close above this level would strengthen the upward bias, exposing the 78.6% Fibonacci retracement level at $51.41.
The MACD stays in positive territory with the MACD line above its signal line and a modest positive histogram, suggesting sustained upside momentum, though without strong acceleration. The RSI at 62 leans toward the upper half of its range but stops short of overbought territory, indicating buyers retain control yet still have room before momentum appears stretched.
However, a bearish close to the day could flip the recovery for a retest of the 50-day EMA at $17.09.
Meanwhile, LayerZero is holding steady above $2.00 after a 9% jump on Sunday. At the time of writing, ZRO is trading above $2.15, with the path of least resistance pointing to the February 11 high at $2.59.
The 50-day EMA extends above the 200-day EMA, flashing a Golden Cross pattern, reflecting an improving medium-term bullish structure. The MACD holds in positive territory with the line above its signal and a modest positive histogram, suggesting sustained but moderate upside momentum. The RSI near 65 stays below overbought territory, indicating buyers remain in control without signs of exhaustion.
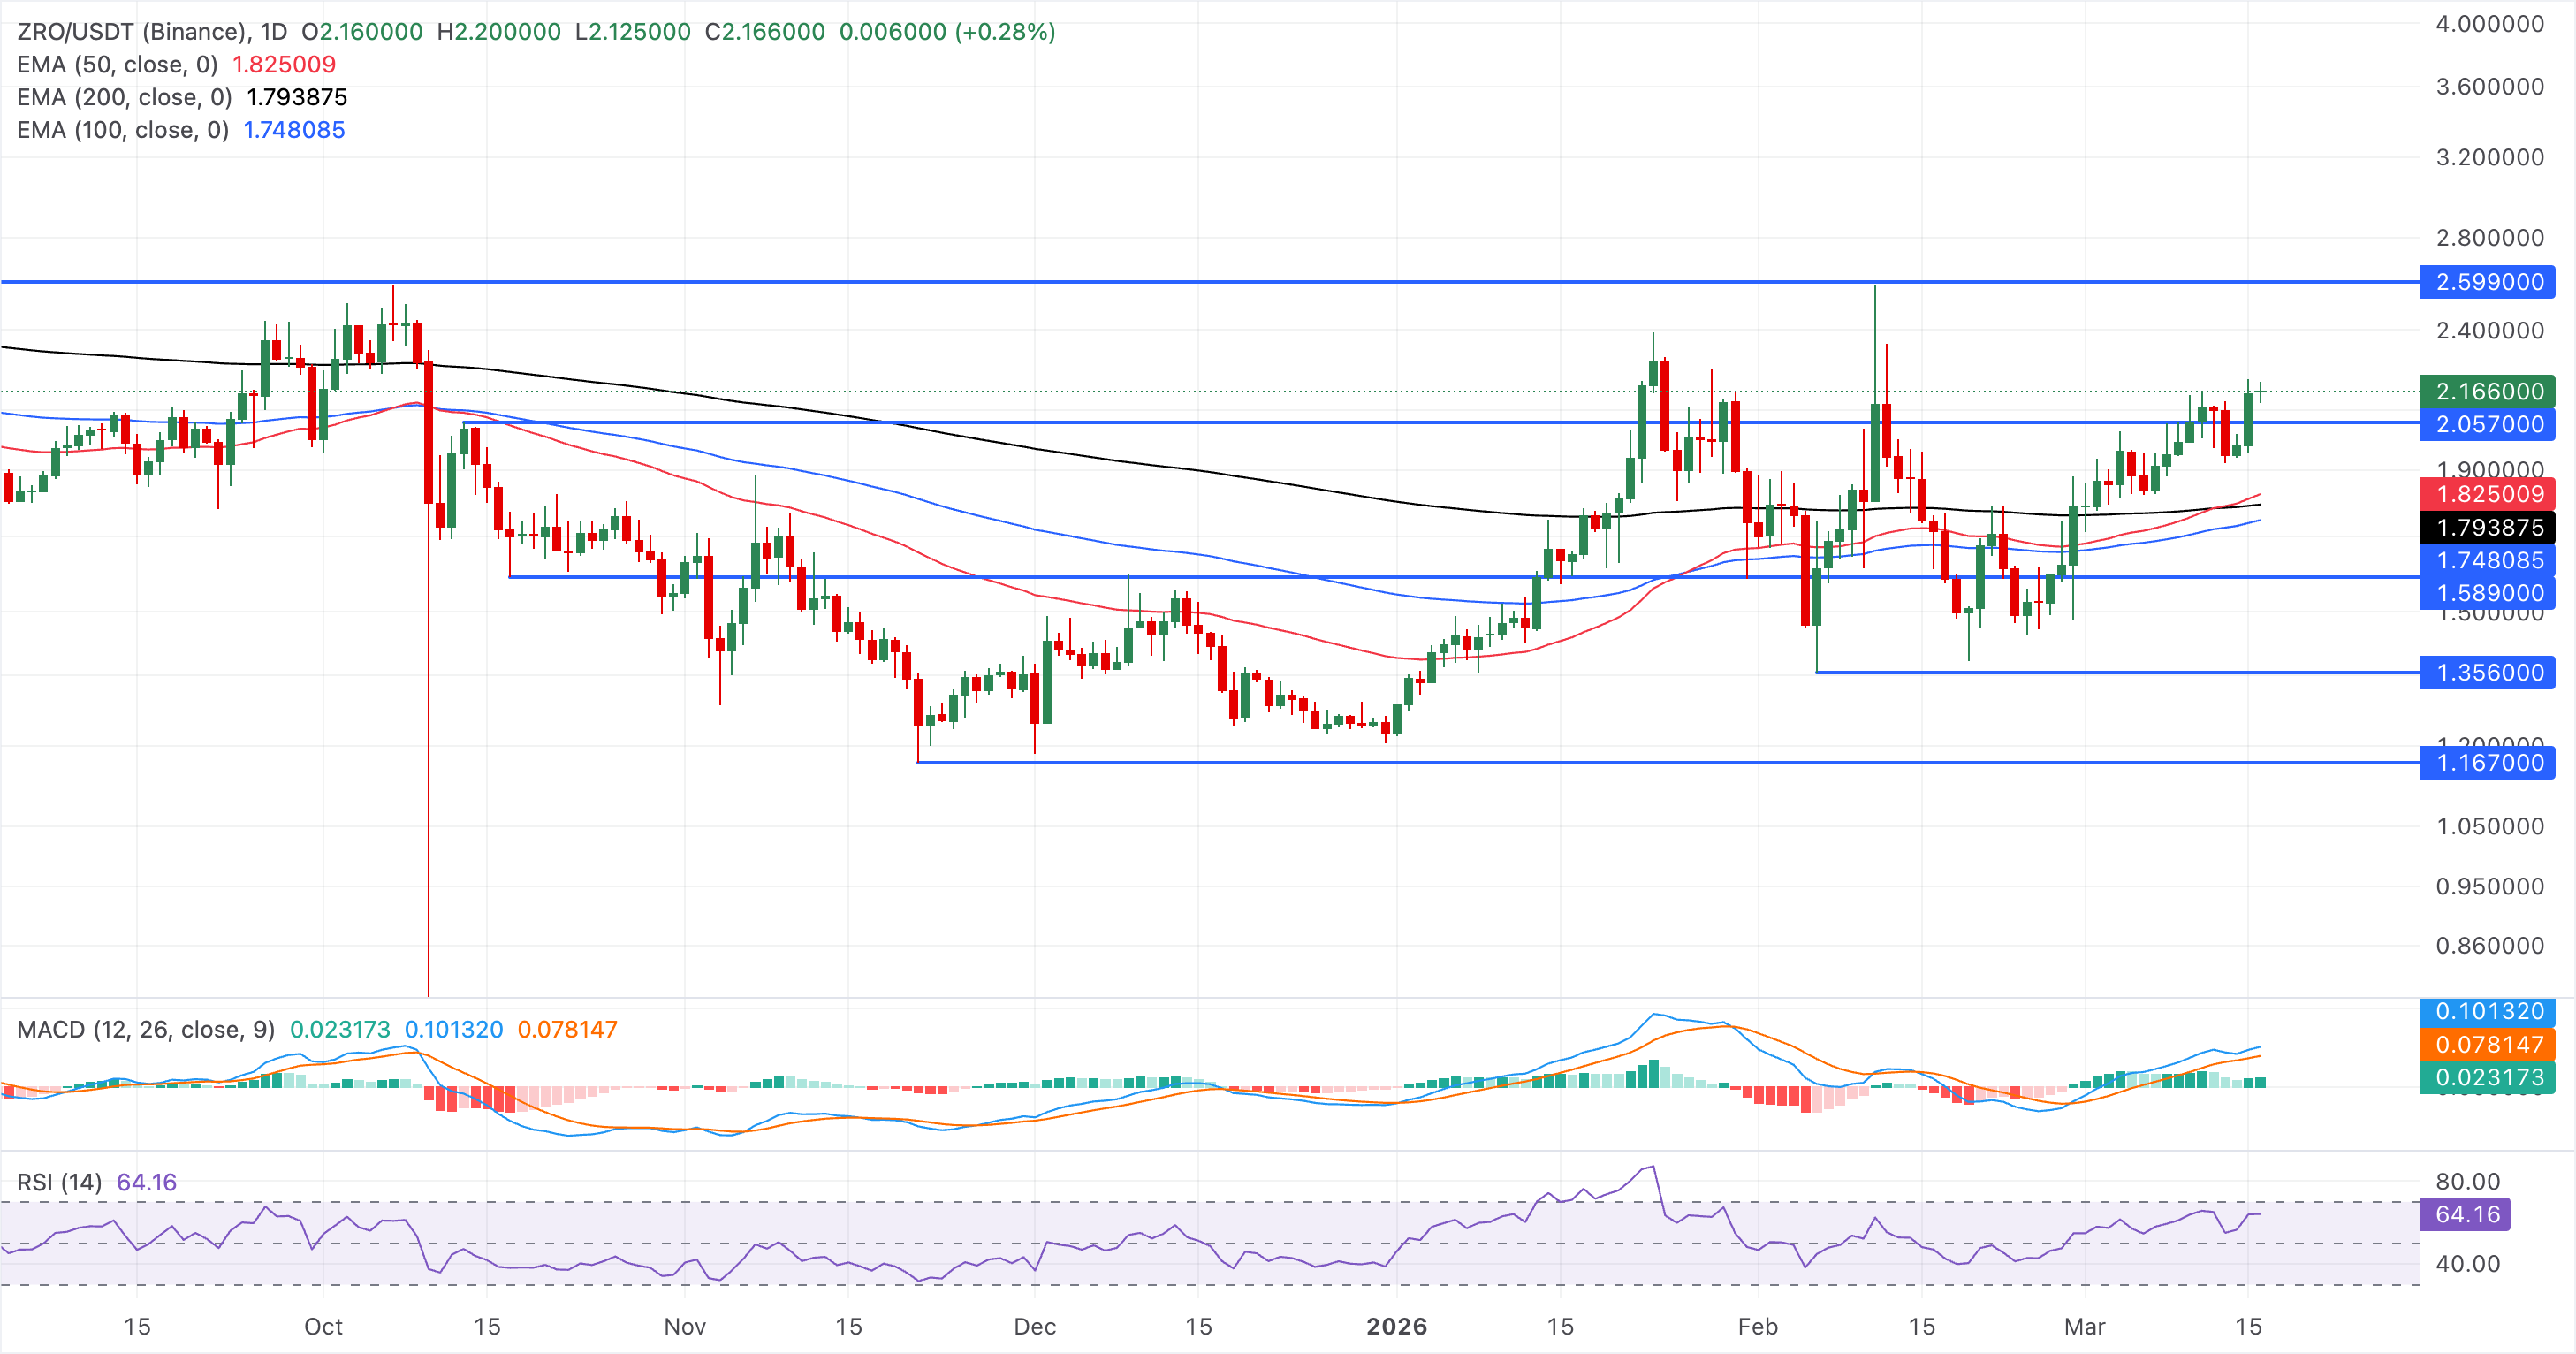
Looking down, the initial support emerges at the $2.00 round figure.
Finally, the privacy coin Zcash shows early signals of a rebound. Zcash holds steady around $230 at press time on Monday, after a 7% surge the previous day, extending the bounce back from $190.
The near-term bias stays cautiously bearish while ZEC holds under the descending trend line and the 50-day EMA at $262, while the 100- and 200-day EMAs are stacked higher at $297 and $281, respectively, maintaining downside pressure.
The MACD has turned higher above its signal line but remains close to the zero mark, hinting at only modest recovery momentum, while the RSI near 49 sits just below the neutral band, consistent with a fragile tone after the recent bounce from the lows.
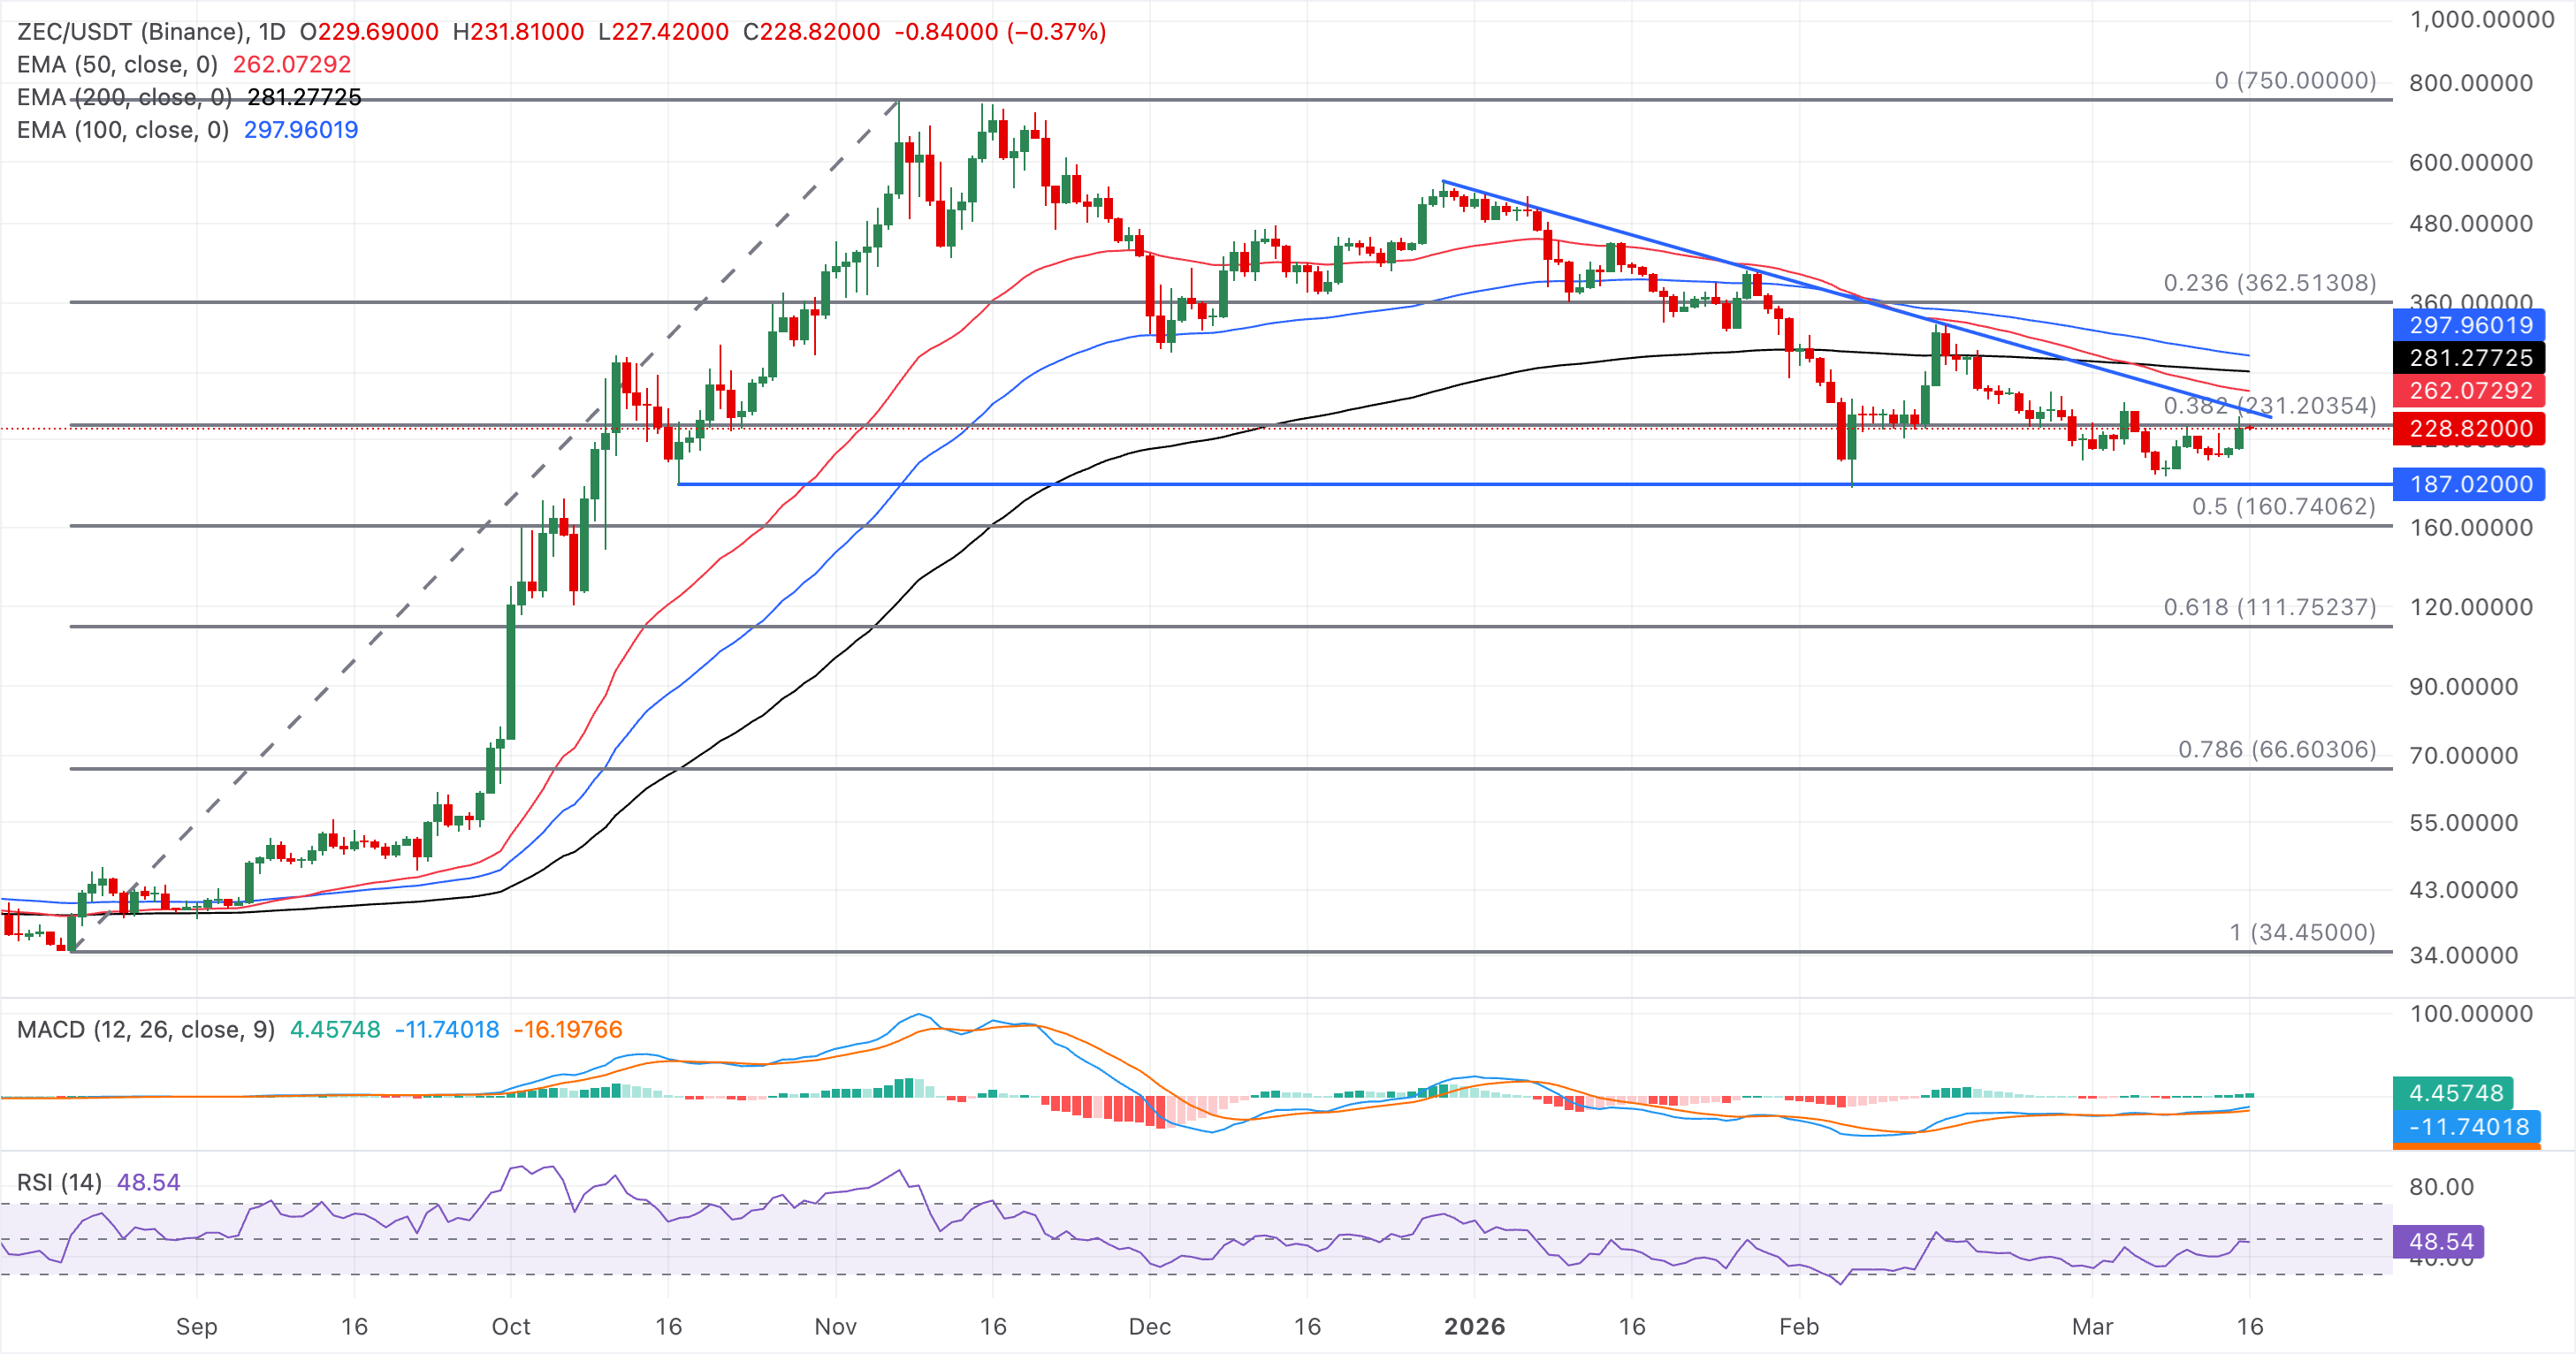
On the downside, initial support remains at the $187 floor, previously tested on February 6.
(The technical analysis of this story was written with the help of an AI tool.)

100만 명이 넘는 사용자가 FXStreet를 통해 실시간 시장 데이터, 차트 도구, 전문가 인사이트, 포렉스 뉴스를 이용합니다. 포괄적인 경제 캘린더와 교육 웨비나는 트레이더가 정보를 유지하고 신중한 결정을 내리도록 돕습니다. FXStreet는 바르셀로나 본사와 전 세계 지역에 걸쳐 약 60명의 팀으로 구성되어 있습니다.
더 읽기


