
Crypto Market Overview: Bitcoin reclaims $70,000 as US-Iran war halts – AI tokens lead gains
작성자 Vishal Dixit
게시일: 24 Mar 2026 | 수정일: 24 Mar 2026


인기 기사

The broader cryptocurrency market recovers with Bitcoin (BTC) scaling above $70,000 at press time on Tuesday as US President Donald Trump halts strikes on Iran’s power plants and energy infrastructure.
- Bitcoin hovers above $70,000 at press time on Tuesday as US President Donald Trump halts the attack on Iran.
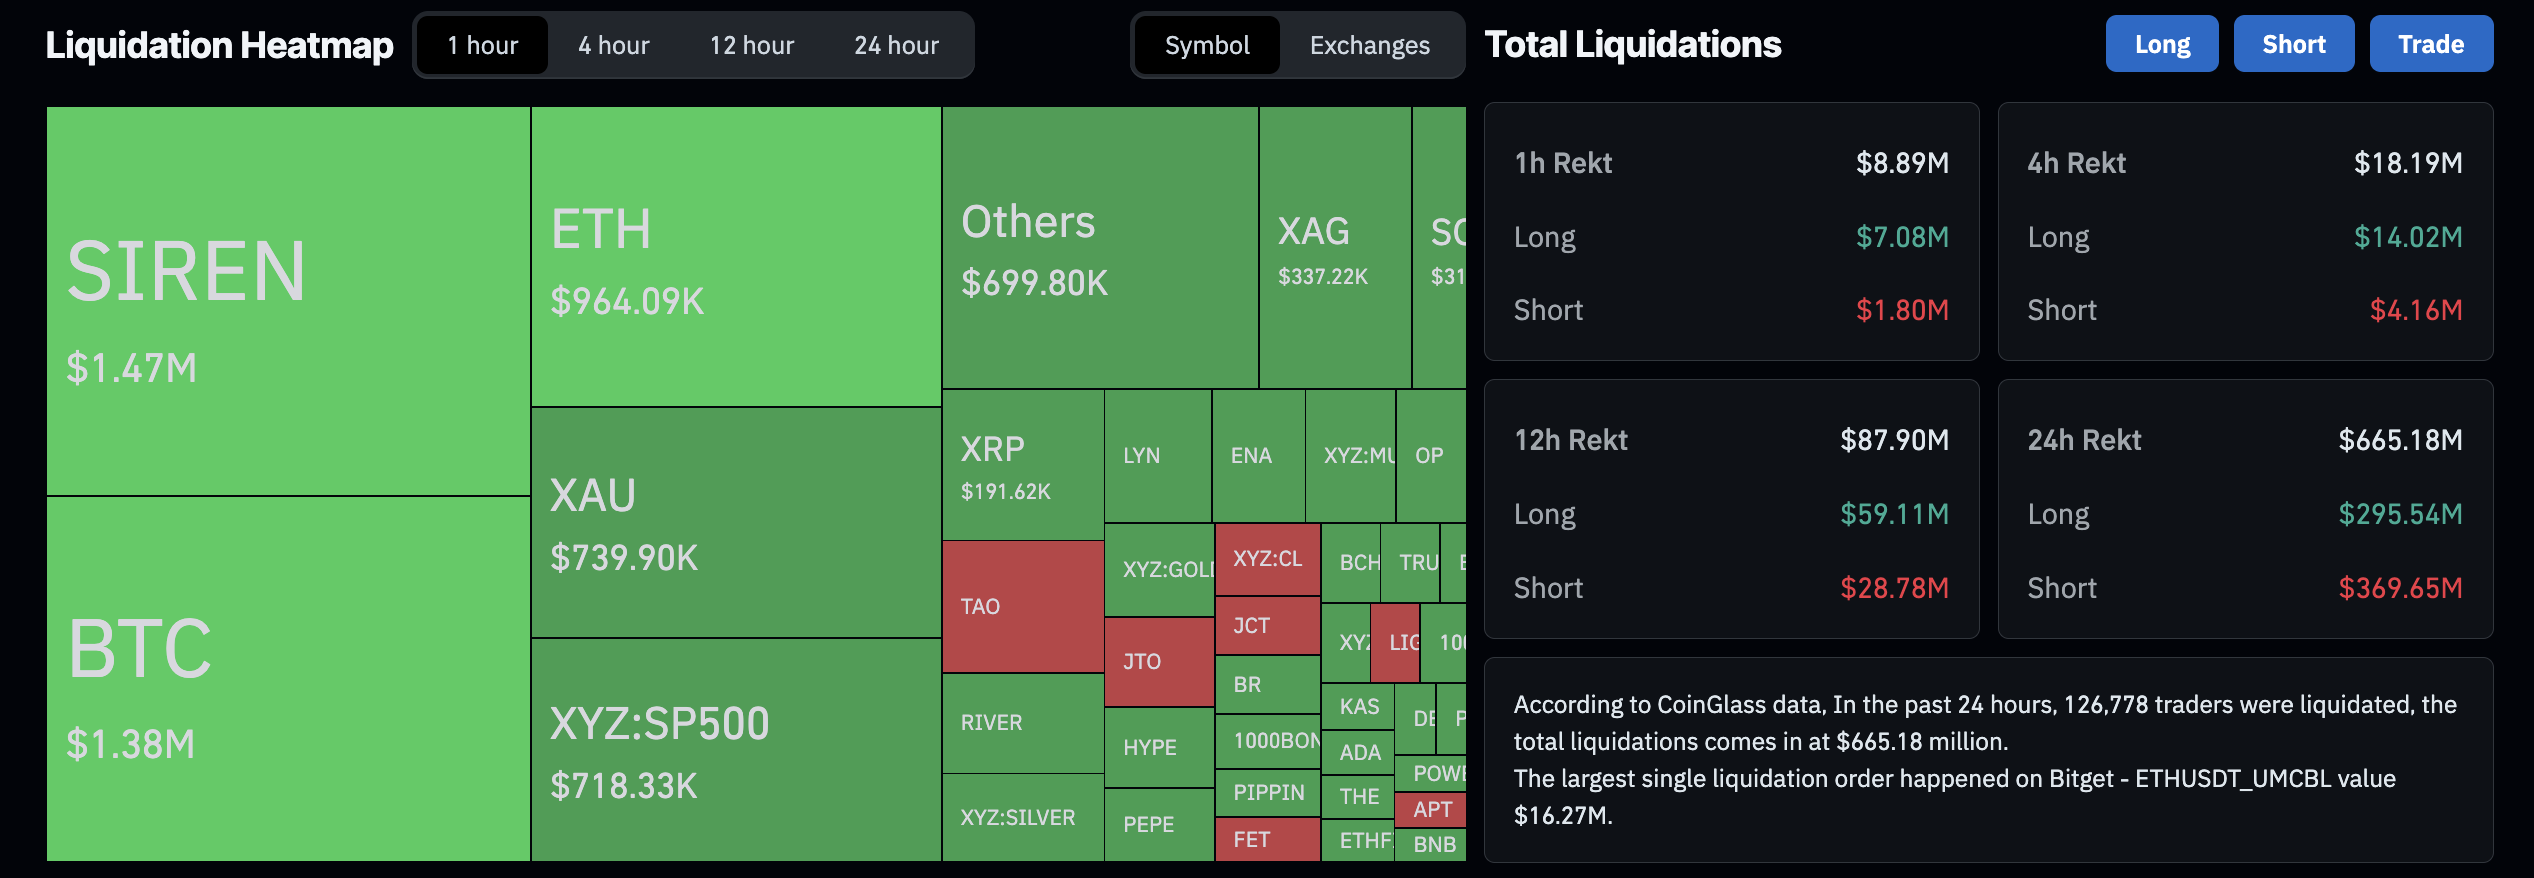
- Total liquidations cross $650 million over the last 24 hours as traders convert to long positions.
- AI crypto tokens such as FET, TAO, and APT have emerged as top gainers over the past 24 hours.
The broader cryptocurrency market recovers with Bitcoin (BTC) scaling above $70,000 at press time on Tuesday as US President Donald Trump halts strikes on Iran’s power plants and energy infrastructure. The crypto derivatives market is seeing a shift toward long Bitcoin positions as short positions are wiped out. Artificial Intelligence (AI) crypto tokens such as Artificial Superintelligence Alliance (FET), Bittensor (TAO), and Aptos (APT) are leading the market recovery over the last 24 hours.
A near-term bullish shift in the crypto market
The announcement that the US has paused Iran-related energy attacks led to a fresh wave of recovery in the cryptocurrency market. CoinGlass data shows over $665 million of total liquidations in the last 24 hours, led by $369 million in short liquidations reflecting a largely bearish wipeout.
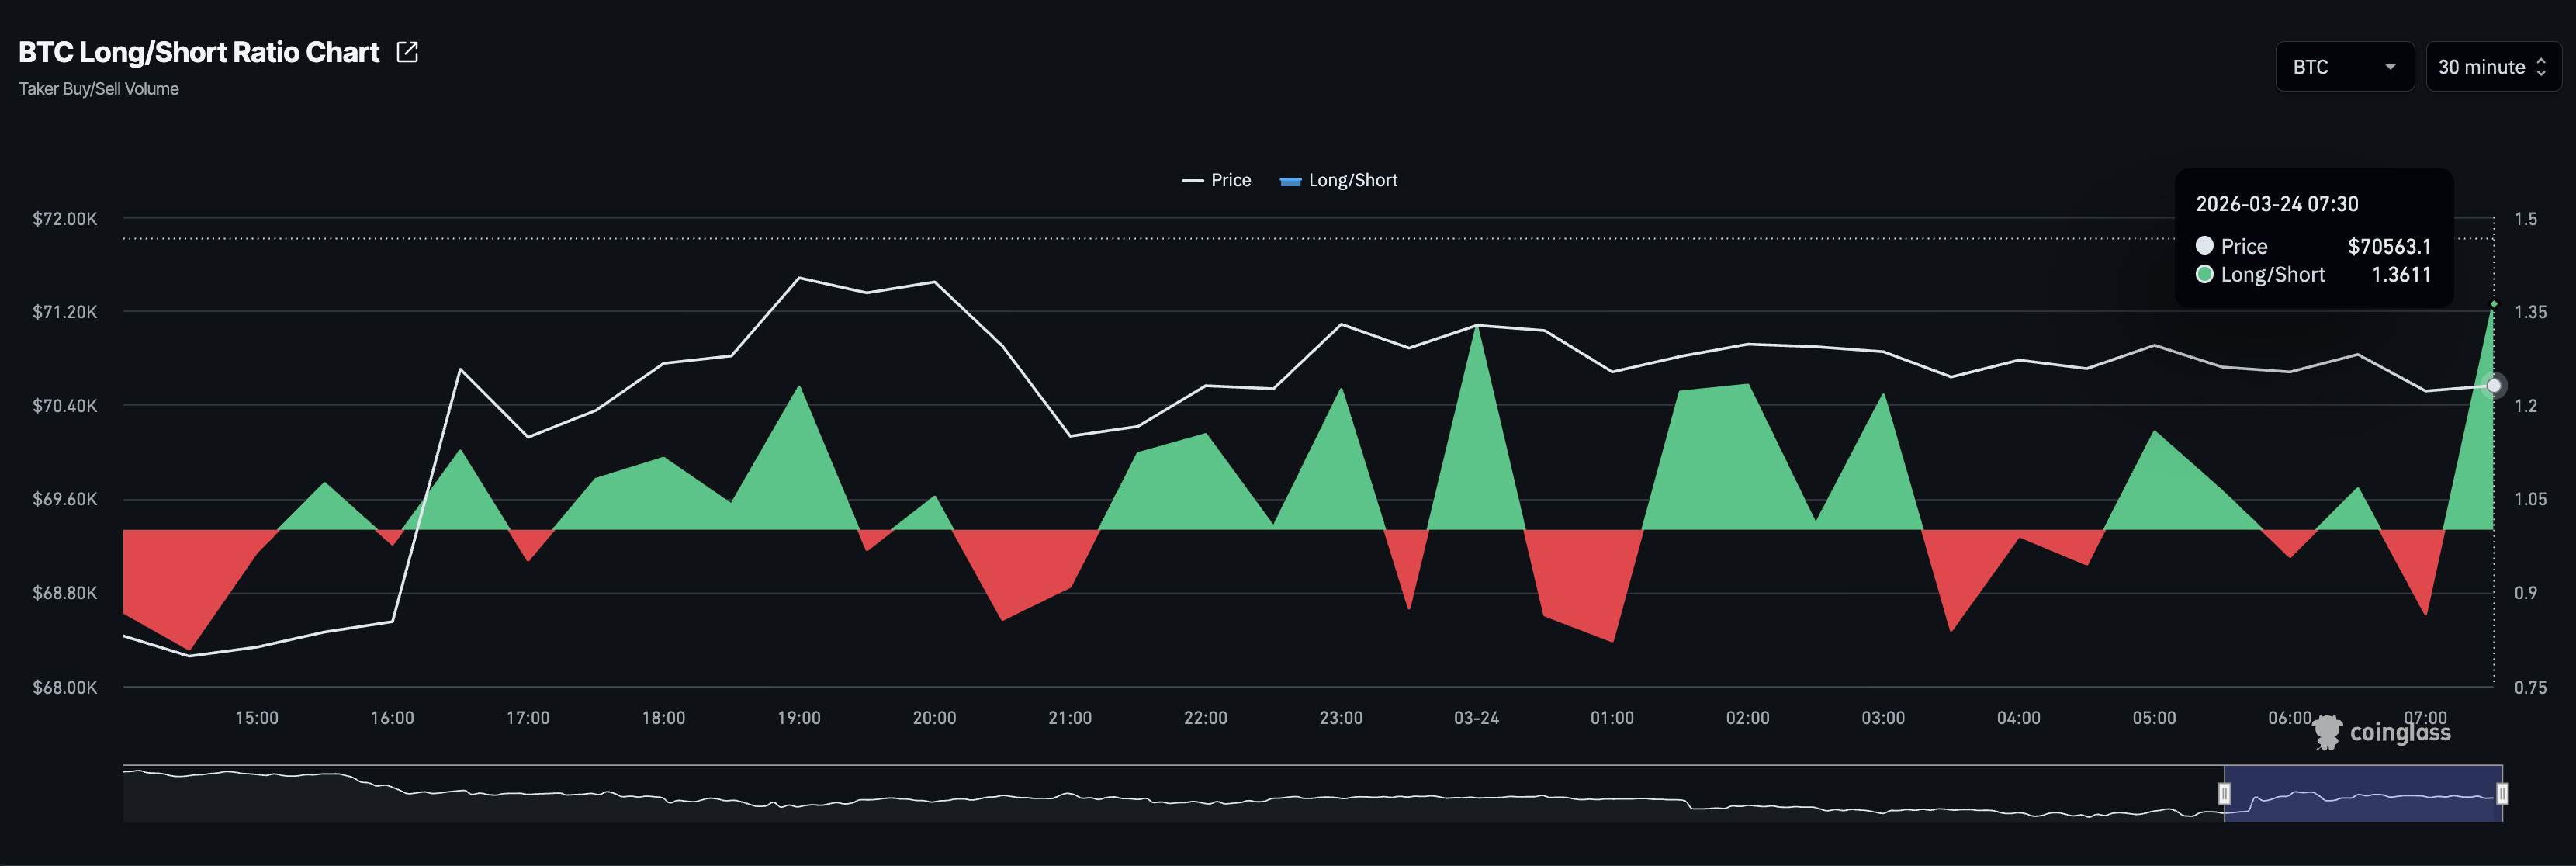
Meanwhile, the long-to-short ratio in Bitcoin futures has risen to 1.3611, suggesting a greater number of active long positions and signaling renewed risk-on sentiment among traders.
Top Crypto Gainers: FET, TAO, and APT rallies approach crucial resistances
Artificial Superintelligence Alliance is up 4% at press time on Tuesday, extending the 10% jump from the previous day. The near-term bias is bullish as FET holds above the 50- and 100-day Exponential Moving Averages (EMAs) but remains well below the 200-day EMA, suggesting a recovery is forming a broader base.
The Moving Average Convergence Divergence (MACD) line is in positive territory above its signal line, albeit with a modest histogram, suggesting improving but not aggressive bullish momentum, while the Relative Strength Index (RSI) at 65 remains below overbought levels and indicates sustained upside pressure after lifting from mid-range readings.
On the topside, initial resistance stands at the 78.6% retracement at $0.2622, measured from the $0.3149 high to the $0.1340 low.
Immediate support emerges at the 100-day EMA at $0.2178, followed by the 50% retracement level at $0.2054.
TAO is trading above $300 at the time of writing on Tuesday, extending the 12% jump from the 200-day EMA on Monday. The near-term bias is bullish as Bittensor extends the breakout rally of a long-running descending channel pattern.
The rising cluster of 50- and 100-day EMAs indicates a high likelihood of a Golden Cross, which would reaffirm the strong near-term upside bias.
The MACD stays above its signal and in positive territory, with the histogram holding positive, suggesting buyers retain momentum even as the recent impulse shows signs of slowing. The RSI at 74 sits in overbought territory, warning that upside progress could face intermittent pullbacks but not yet signaling a clear reversal.
If the breakout rally secures a daily close above $300, it could target the crucial support-turned-resistance level at $369.
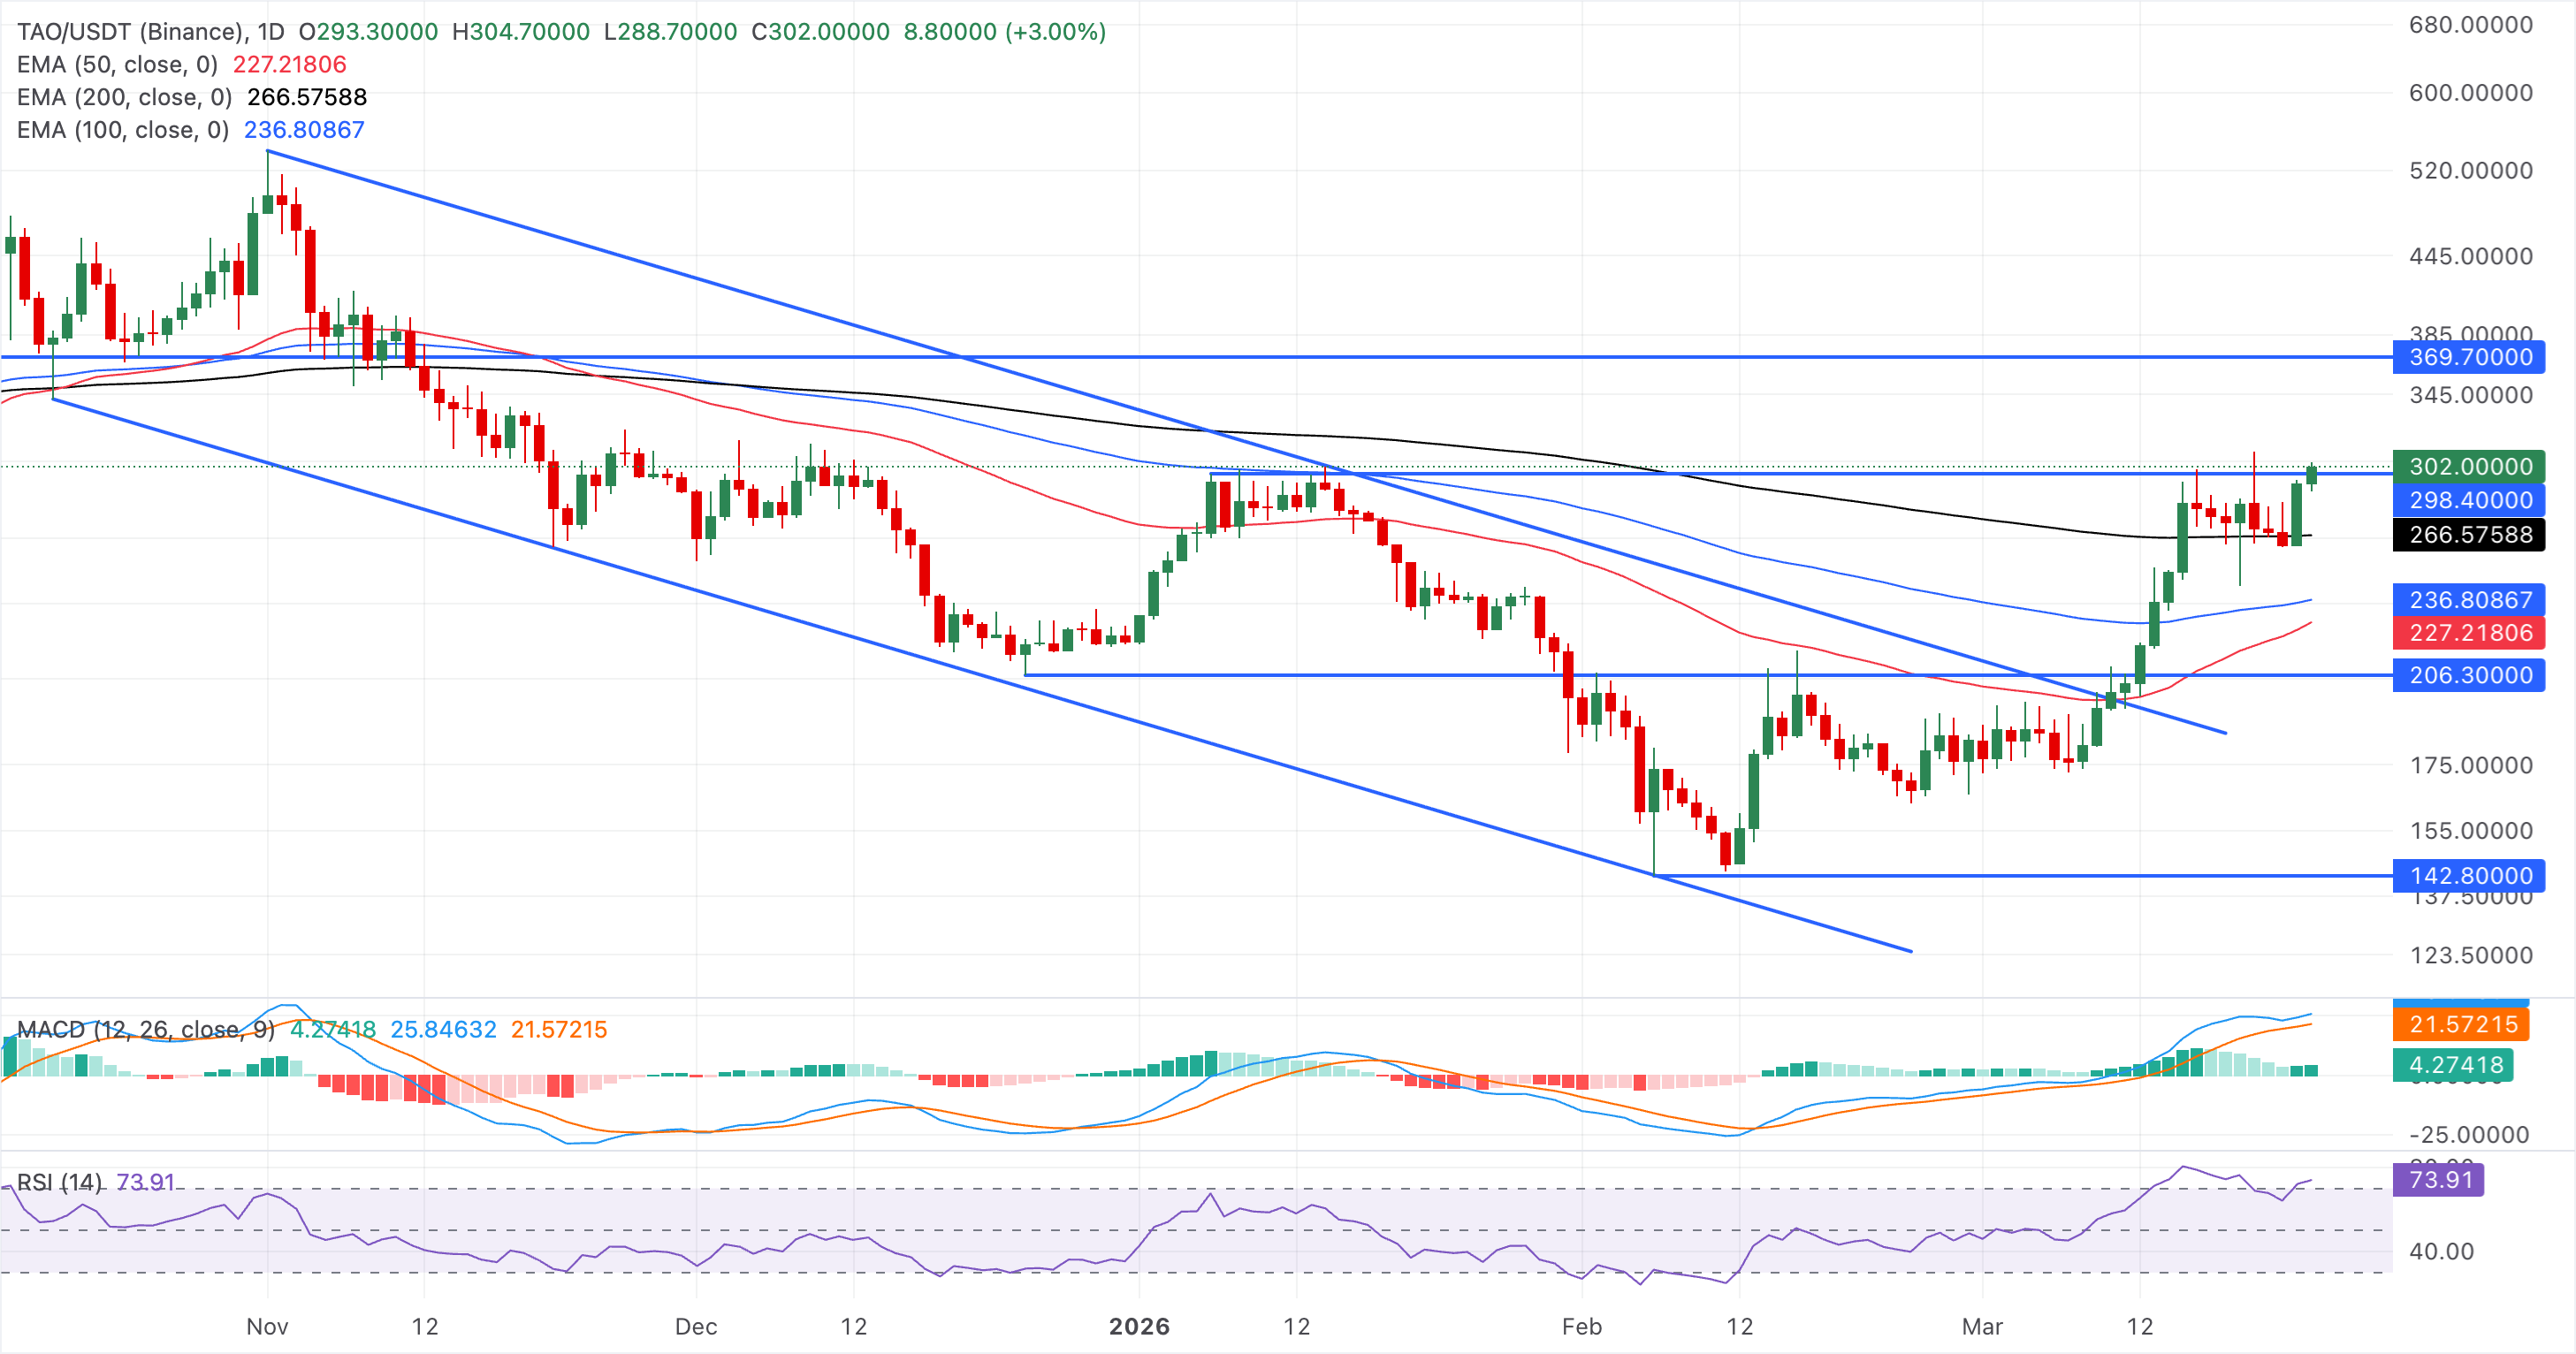
Looking down, the 200- and 100-day EMAs at $266 and $236, respectively, emerge as initial support levels.
Meanwhile, Aptos is trading above $1 at press time on Tuesday, testing the declining 50-day EMA at $1.07. The near-term bias is cautiously bullish, as APT remains below the declining cluster of the 50-, 100-, and 200-day EMAs, which reflects a broader bearish bias.
The RSI at 56 indicates improving but not overstretched bullish momentum while the MACD and its signal line inch closer to the positive territory, with a modest positive histogram that supports a mild upside tone.
If the AI crypto clears the 50-day EMA, the 100-day EMA at $1.41 would be the next likely resistance level targeted by bulls.
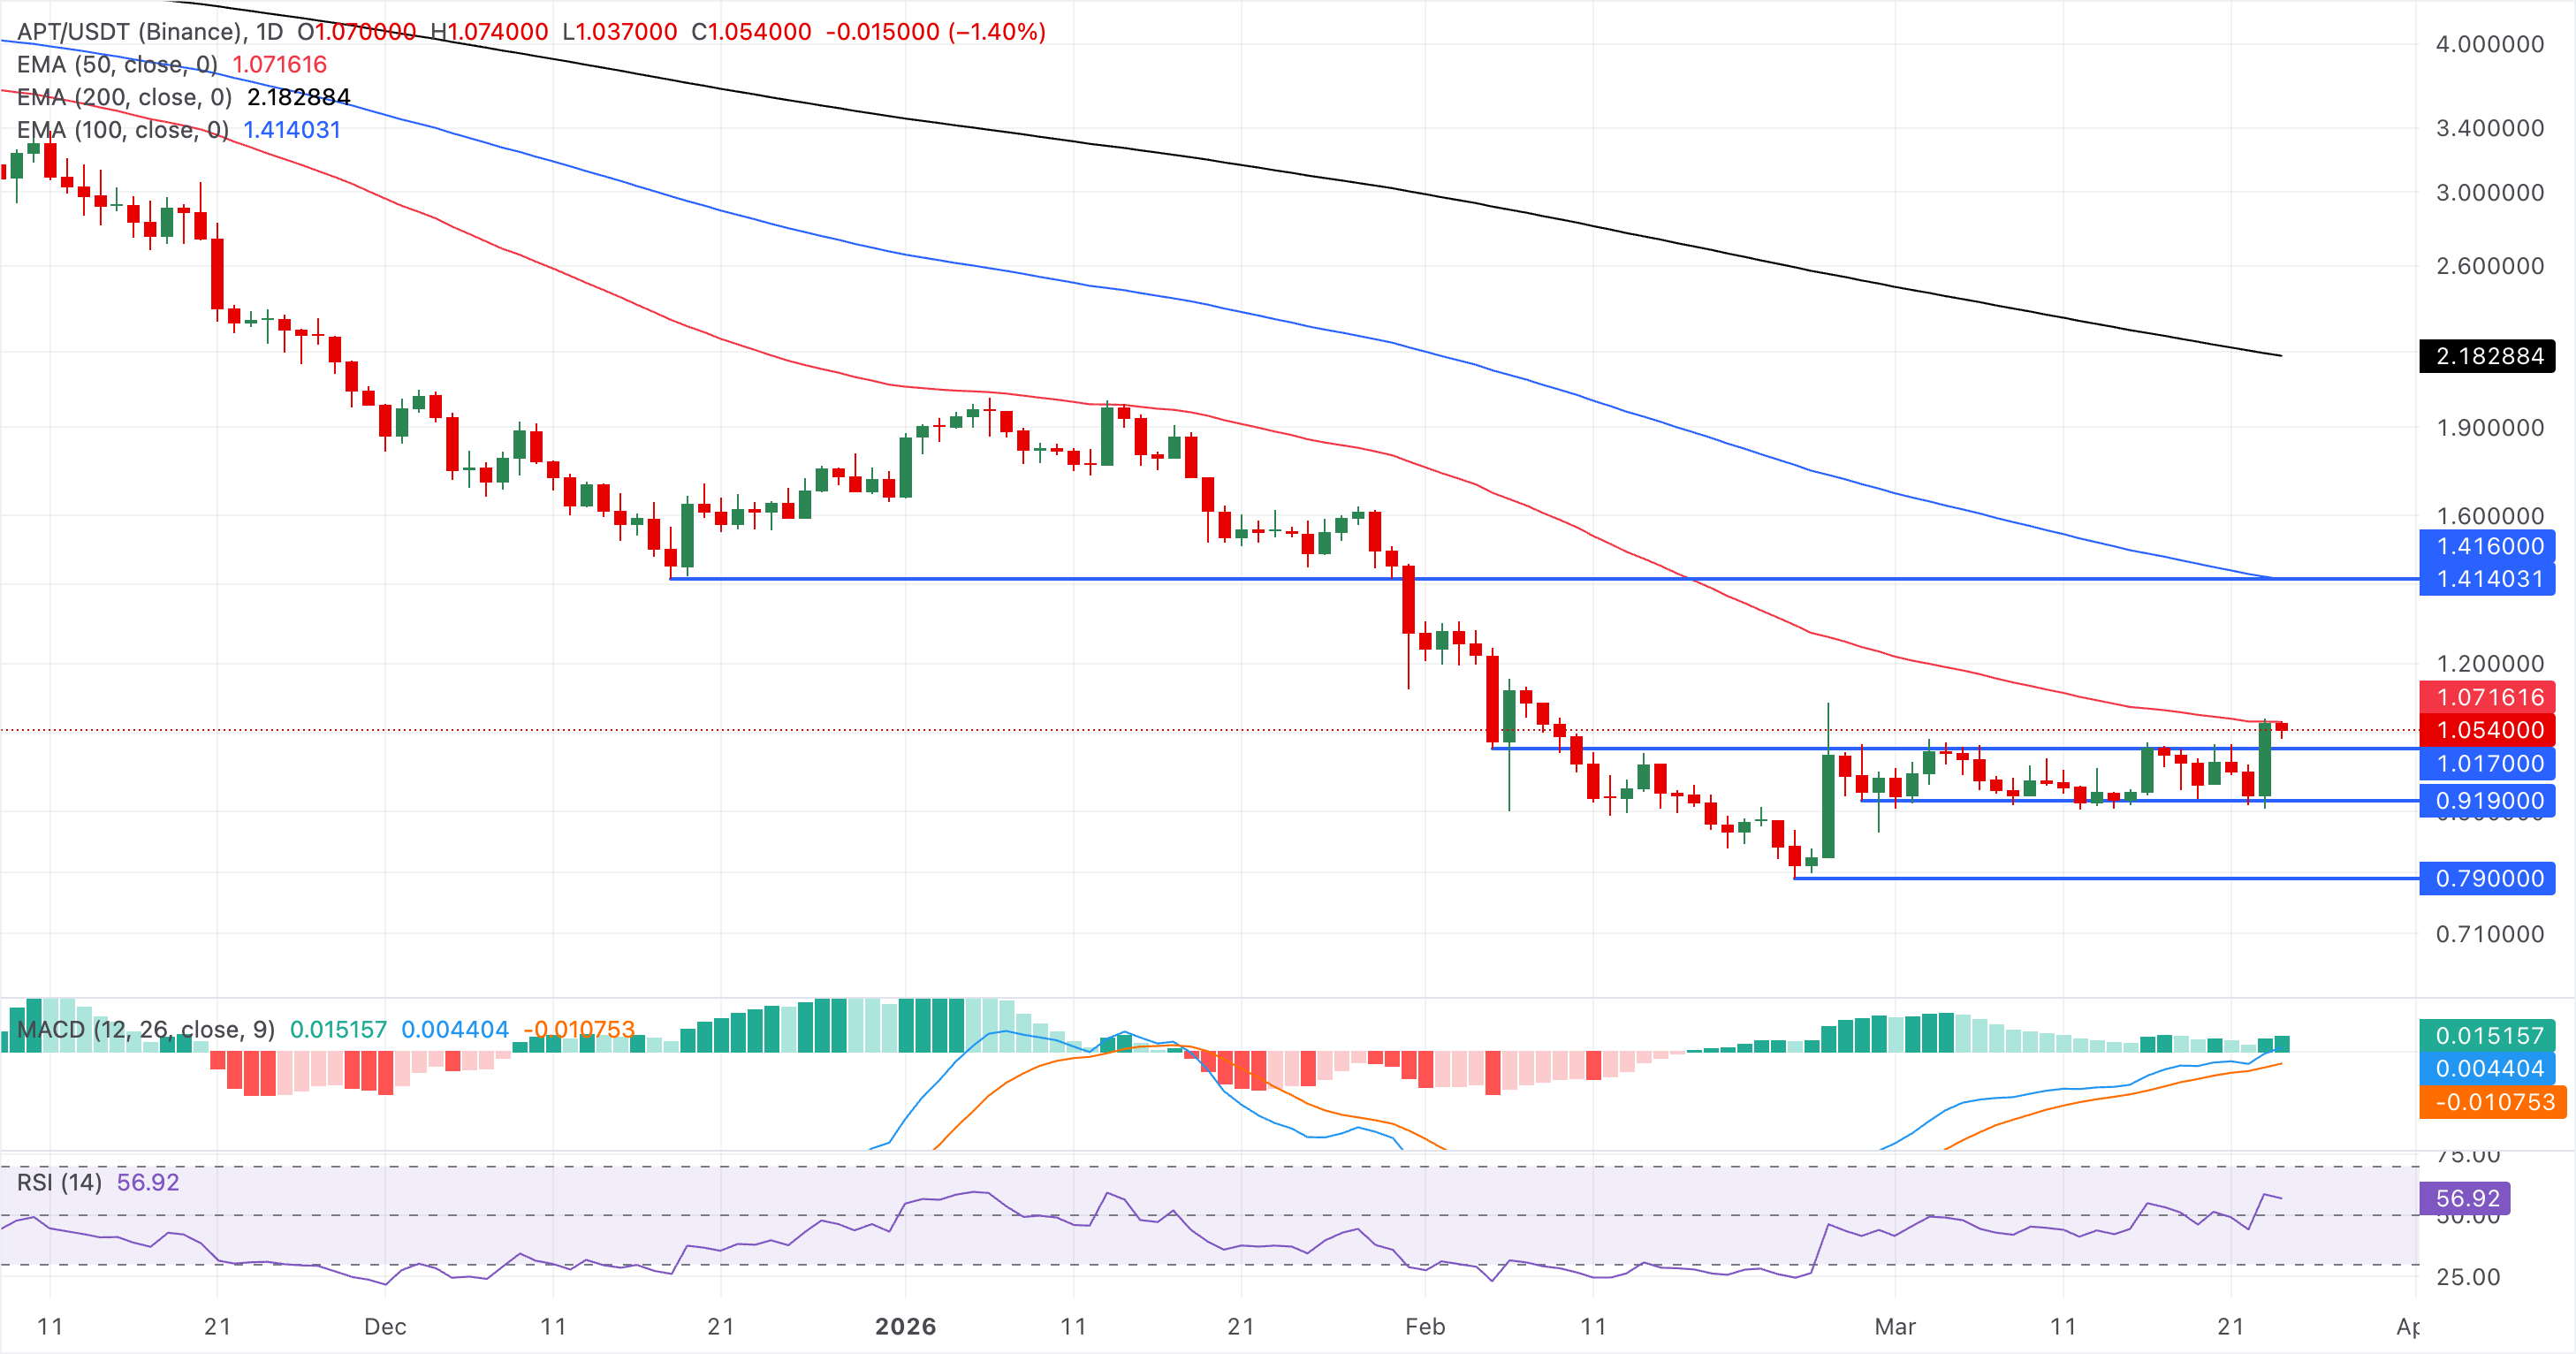
A daily close below would reaffirm the downside pressure on Aptos, risking a pullback to the $0.91 support level.
(The technical analysis of this story was written with the help of an AI tool.)

100만 명이 넘는 사용자가 FXStreet를 통해 실시간 시장 데이터, 차트 도구, 전문가 인사이트, 포렉스 뉴스를 이용합니다. 포괄적인 경제 캘린더와 교육 웨비나는 트레이더가 정보를 유지하고 신중한 결정을 내리도록 돕습니다. FXStreet는 바르셀로나 본사와 전 세계 지역에 걸쳐 약 60명의 팀으로 구성되어 있습니다.
더 읽기


