
Crypto Overview: Bitcoin bets flip bearish while PENGU, PI, and JUP sustain gains
작성자 Vishal Dixit
수정됨: 28 Apr 2026


인기 기사

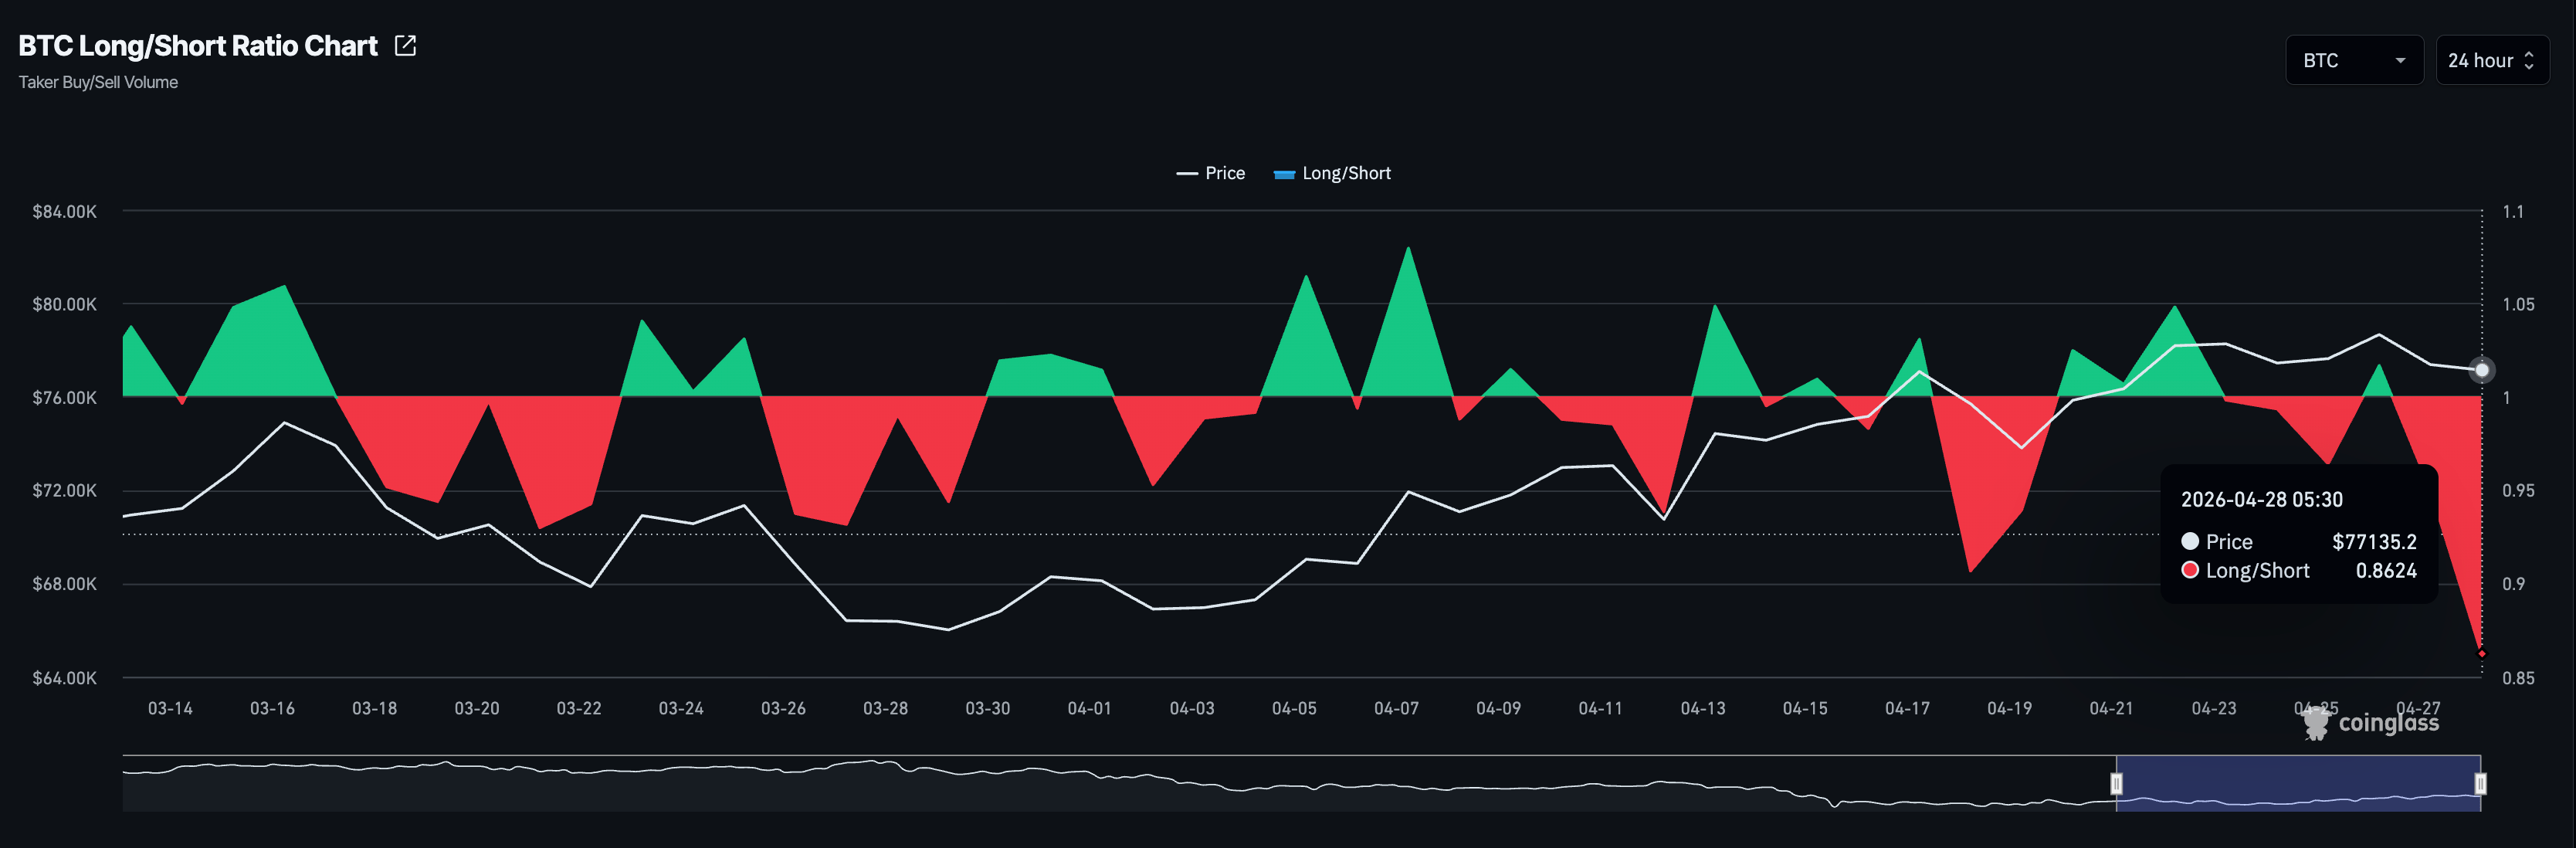
Bitcoin (BTC) trades below $77,000 at press time on Tuesday as the broader market risk-on sentiment eases. The long-to-short ratio in BTC futures drops below 1, signaling a near-term bearish bias among traders.
- Bitcoin drops below $77,000 on Tuesday, risking further decline.
- Derivatives data shows a bearish positional buildup in BTC futures as the market anticipates potential downside.
- Pudgy Penguins, Pi Network, and Jupiter sustain gains over the last 24 hours.
Bitcoin (BTC) trades below $77,000 at press time on Tuesday as the broader market risk-on sentiment eases. The long-to-short ratio in BTC futures drops below 1, signaling a near-term bearish bias among traders. Meanwhile, Pudgy Penguins (PENGU), Pi Network (PI), and Jupiter (JUP) sustain gains over the last 24 hours.
Bitcoin hovers on thin ice
Bitcoin extends losses below $77,000 at press time on Tuesday, risking a pullback toward $75,000. The derivatives market is quick to place bets on this potential downside, leading to leverage-driven downside pressure. CoinGlass data shows the long-to-short ratio is down to 0.8624, suggesting that the active short positions outnumber long positions.
Technical outlook: Will PENGU, PI, and JUP sustain gains?
Pudgy Penguins trades near the $0.0100 psychological level at press time on Tuesday, holding a constructive bullish bias as it remains above the 50-day Exponential Moving Average (EMA) at $0.0076 while still trading below the longer-term 200-day EMA around $0.0112.
The meme coin hovers below the 200-day EMA at $0.0112, close to the 78.6% retracement at $0.0120, measured over the downswing from $0.0179 to $0.0052, suggesting near-term upside pressure. A break above this level would pave the path to the 100% Fibonacci level at $0.0138.
The Relative Strength Index (RSI) is at 74 in the overbought territory on the daily chart, while the Moving Average Convergence Divergence (MACD) rises above its signal line, hinting at a strengthening bullish drive.
On the downside, immediate support emerges at the 50% retracement near $0.0095, with further cushions at the 38.2% level around $0.0085 and the 50-day EMA close to $0.0076.
Pi Network shows a constructive near-term bias as it extends gains above $0.1800 at the time of writing on Tuesday. The intraday gains test grounds above the descending trendline around $0.1837, and a decisive close could target the 200-day EMA at $0.2315.
The MACD line holds above the signal line with a positive, expanding histogram, while the RSI is at 64, hinting that bullish pressure is firming but edging toward overbought territory.
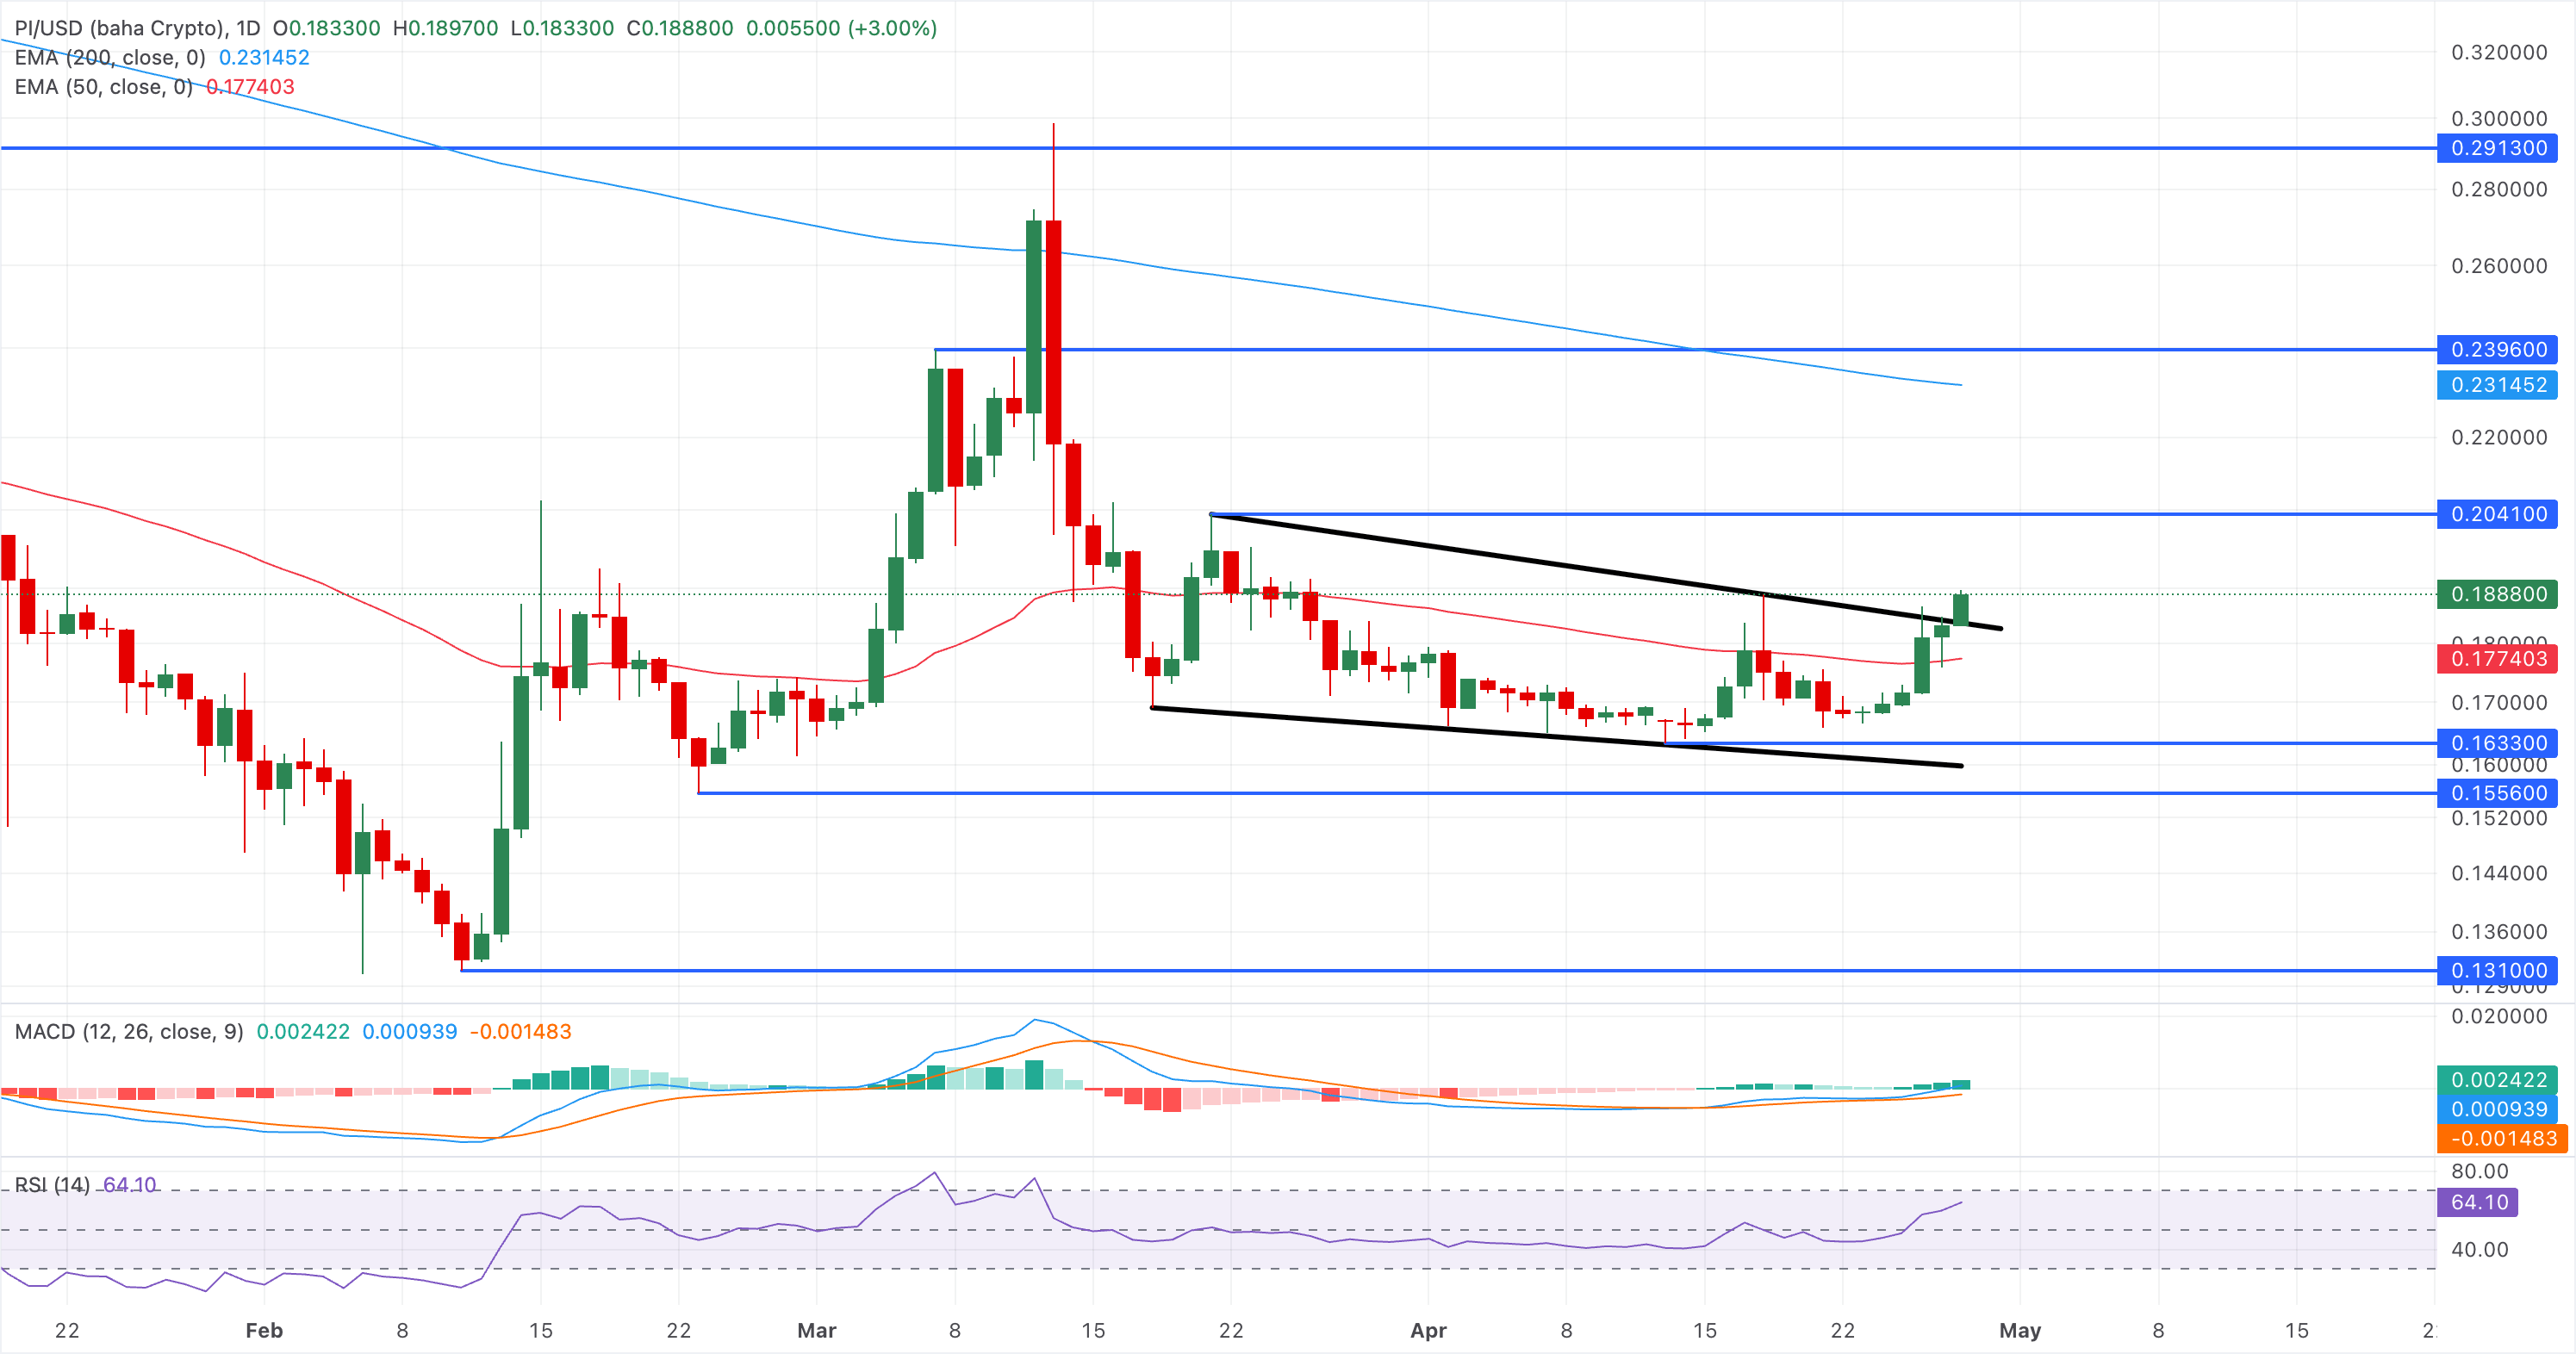
The initial support lies at the reclaimed trendline near $0.1837, with the 50-day EMA at $0.1774 providing a deeper technical floor if sellers gain traction.
Jupiter edges lower at press time on Tuesday after two consecutive days of roughly 6% gains. The pair maintains a constructive bullish bias as it holds above the 50-day EMA at $0.1700 and has reclaimed the 50% retracement near $0.1817.
Momentum is supportive, with the RSI hovering at 65 and the MACD line above its signal line, suggesting buyers still retain short-term control despite approaching overhead levels.
On the topside, immediate resistance emerges at the 61.8% Fibonacci retracement around $0.1949, followed by the 78.6% retracement near $0.2153.
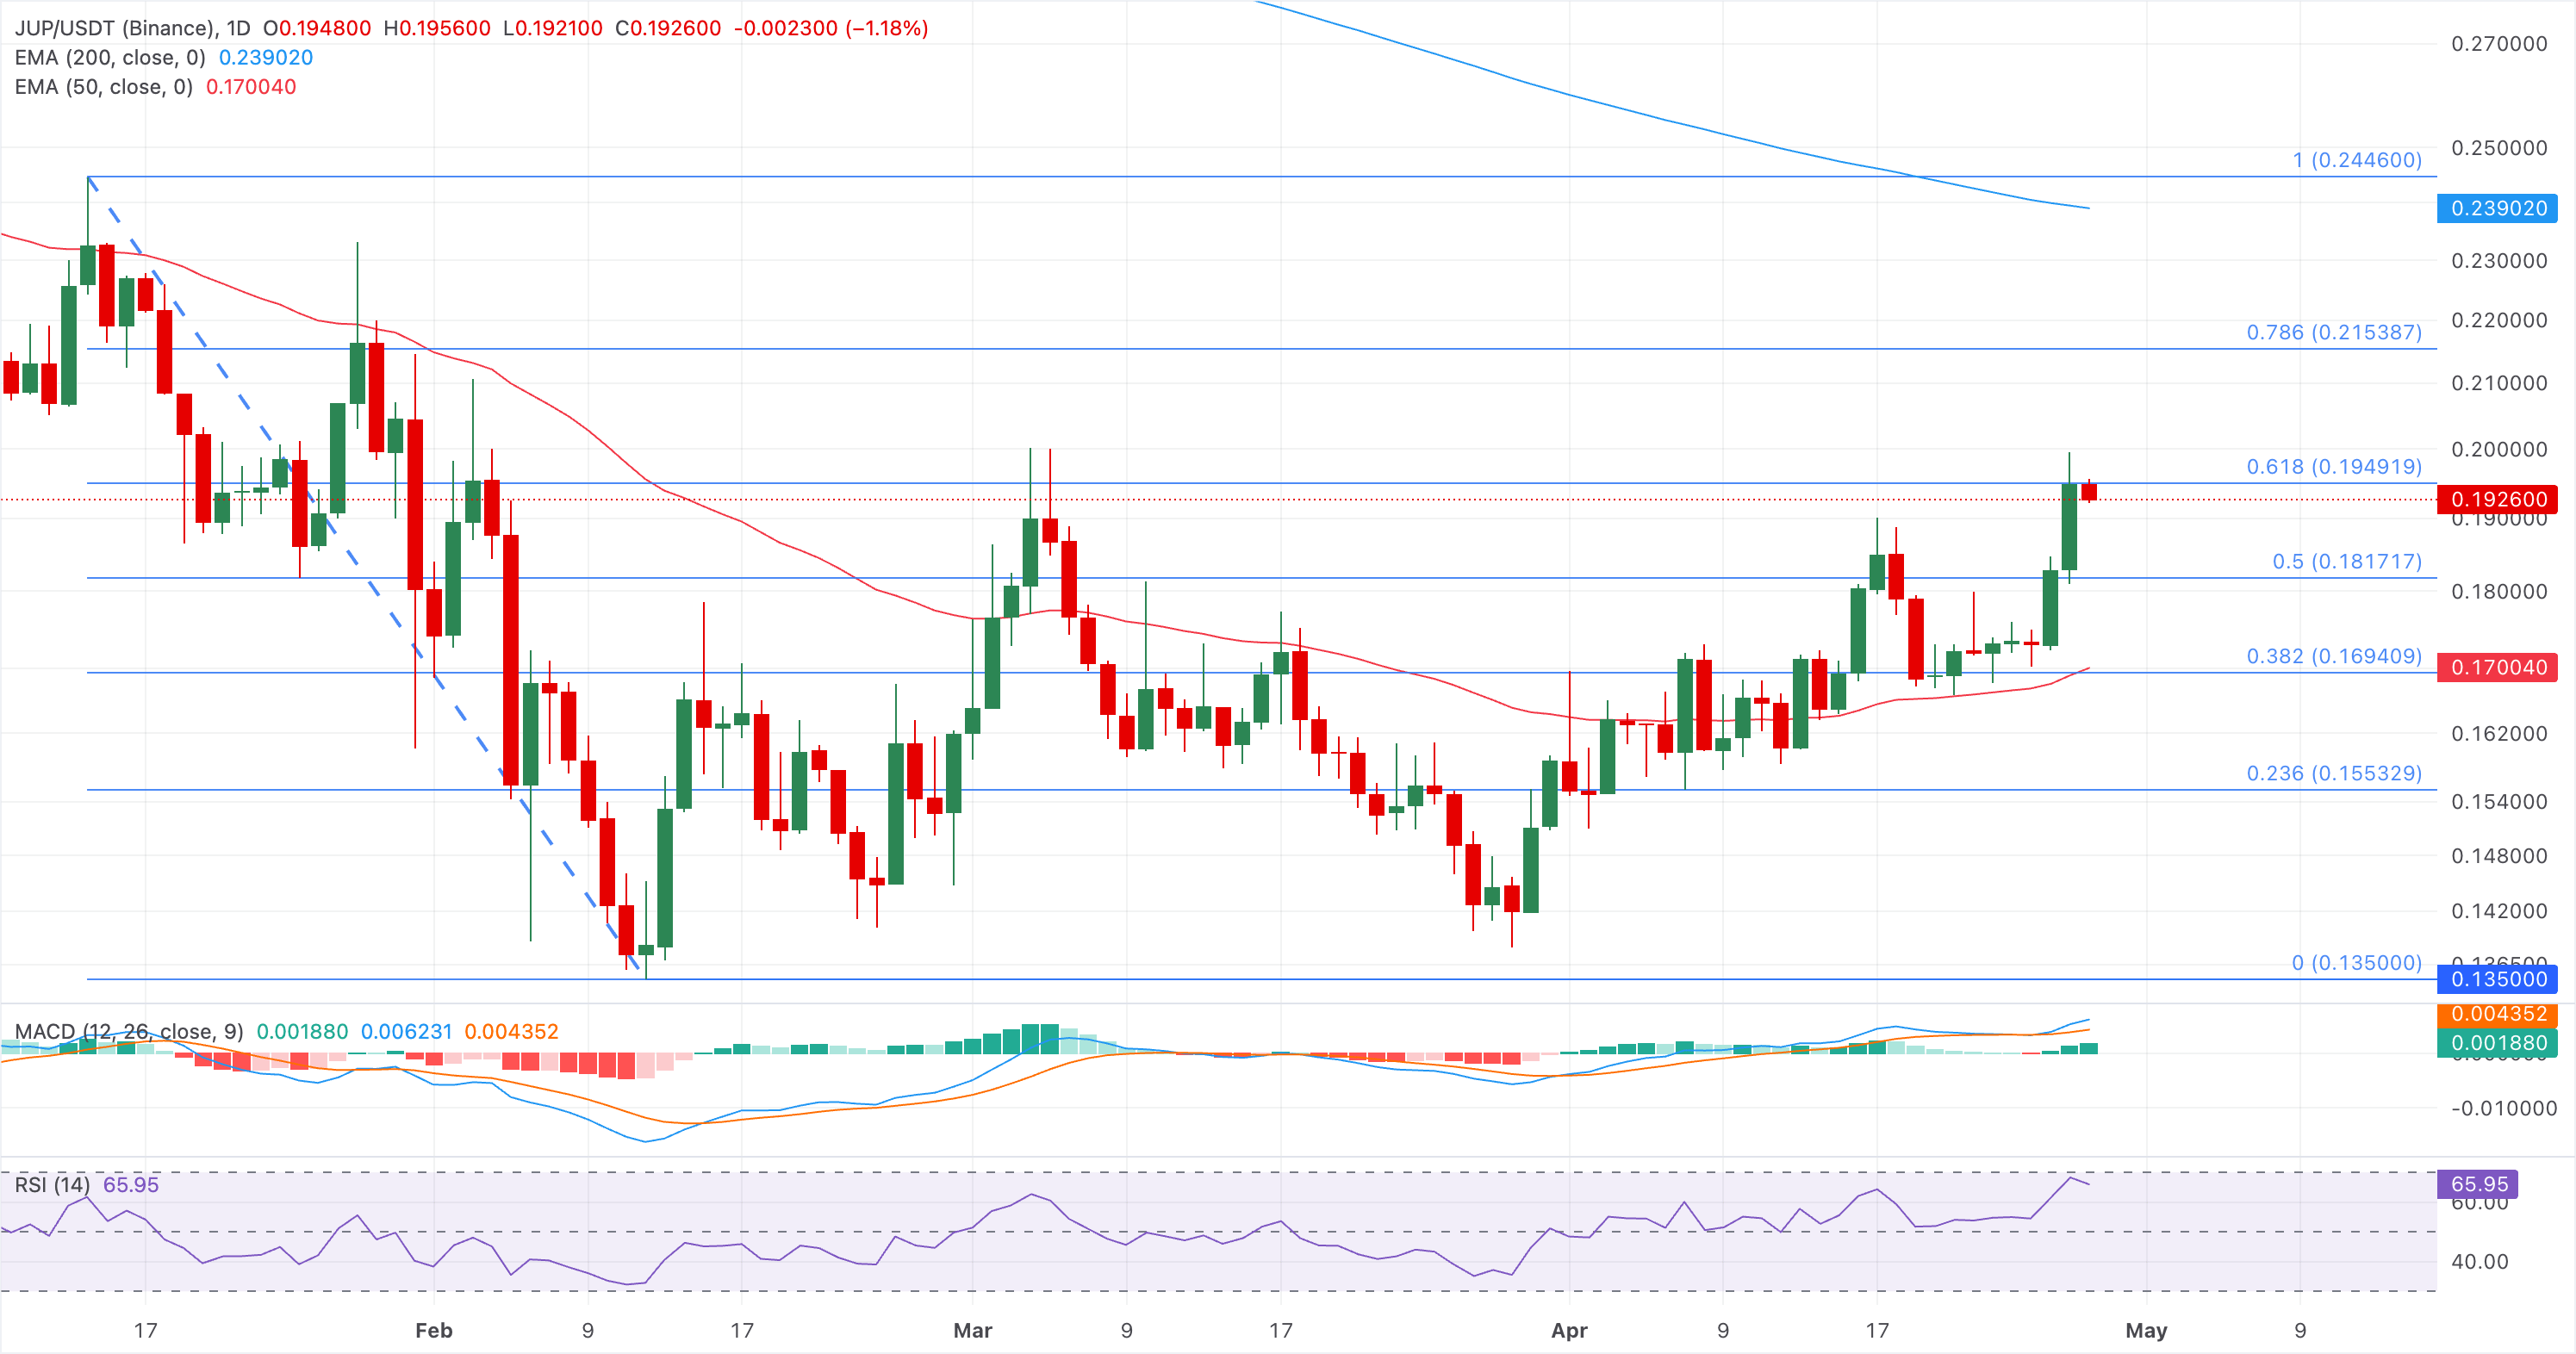
On the downside, initial support is seen at the reclaimed 50% retracement around $0.1817, with further cushions at the 38.2% Fibonacci retracement level near $0.1694, close to the 50-day EMA at $0.17.
(The technical analysis of this story was written with the help of an AI tool.)

100만 명이 넘는 사용자가 FXStreet를 통해 실시간 시장 데이터, 차트 도구, 전문가 인사이트, 포렉스 뉴스를 이용합니다. 포괄적인 경제 캘린더와 교육 웨비나는 트레이더가 정보를 유지하고 신중한 결정을 내리도록 돕습니다. FXStreet는 바르셀로나 본사와 전 세계 지역에 걸쳐 약 60명의 팀으로 구성되어 있습니다.
더 읽기


