
Crypto Overview: Bitcoin loses $65,000 while Ethena and Stellar advance
작성자 Vishal Dixit
수정됨: 18 Jun 2026


인기 기사

The broader cryptocurrency market remains divided with Bitcoin (BTC) slipping below $65,000 on Thursday after Kevin Warsh’s hawkish speech the previous day, while altcoins like Ethena (ENA) and Stellar (XLM) advance upwards.
- Bitcoin hovers below $65,000 on Thursday, following the new Fed Chair Kevin Warsh’s hawkish speech on Wednesday.
- Ethena edges higher toward the $0.1000 psychological mark on Thursday following a 10% jump the previous day.
- Stellar is up over 7% on Thursday, extending its V-shaped rebound toward $0.2500.
The broader cryptocurrency market remains divided with Bitcoin (BTC) slipping below $65,000 on Thursday after Kevin Warsh’s hawkish speech the previous day, while altcoins like Ethena (ENA) and Stellar (XLM) advance upwards. Demand for altcoins with real-world utility, linked to stablecoins or tokenized stocks or bonds, fuels the short-term buying pressure.
Kevin Warsh’s Fed leans hawkish
Kevin Warsh attended his first Federal Open Market Committee (FOMC) meeting on Wednesday as its Chairman, keeping interest rates unchanged at 3.50%-3.75%. The FOMC maintains its key objective of 2% inflation while shifting to shorter policy statements that will exclude the “Forward guidance” section, which is expected to increase market uncertainty. Overall, the hawkish tilt in Warsh’s Fed fueled a mild risk-off sentiment across markets.
Bitcoin could revisit the $60,000 zone
Bitcoin maintains a mild bearish bias in the near-term as it slips below $65,000. At the time of writing, BTC is trading below the 50-, 100-, and 200-day Exponential Moving Averages (EMAs), clustered around $70,067, $72,858, and $78,283, respectively.
The recent rebound has turned the Moving Average Convergence Divergence (MACD) indicator positive, hinting at a corrective recovery, but the Relative Strength Index (RSI) near 39 still reflects weak demand, suggesting rallies are likely to face selling pressure while spot remains capped below these overhead EMAs and the previously broken rising trendline around $72,949.
Immediate support is near a shorter rising trendline near Wednesday's low at $63,915, guarding the downside to a deeper structural floor at $60,000 if selling resumes.
Ethena and Stellar continue to extend gains
Ethena inches closer to $0.1000 at press time on Thursday as price marginally crosses above the 50-day EMA at $0.0961, while remaining well below the 100-day EMA at $0.1106 and the 200-day EMA at $0.1573. The longer-term EMAs keep the broader trend capped but allow for a modest recovery bias in the very near term.
The RSI around 55 leans toward the bullish side of neutral, and the MACD is rising above its signal line, hinting that downside momentum has faded and dip-buying interest is starting to emerge above the short-term average.
Looking up, the 100-day EMA at $0.1106 emerges as the key dynamic resistance, having previously capped roughly three bullish attempts. A decisive close above this moving average could open the path toward the February 2 high at $0.1448.
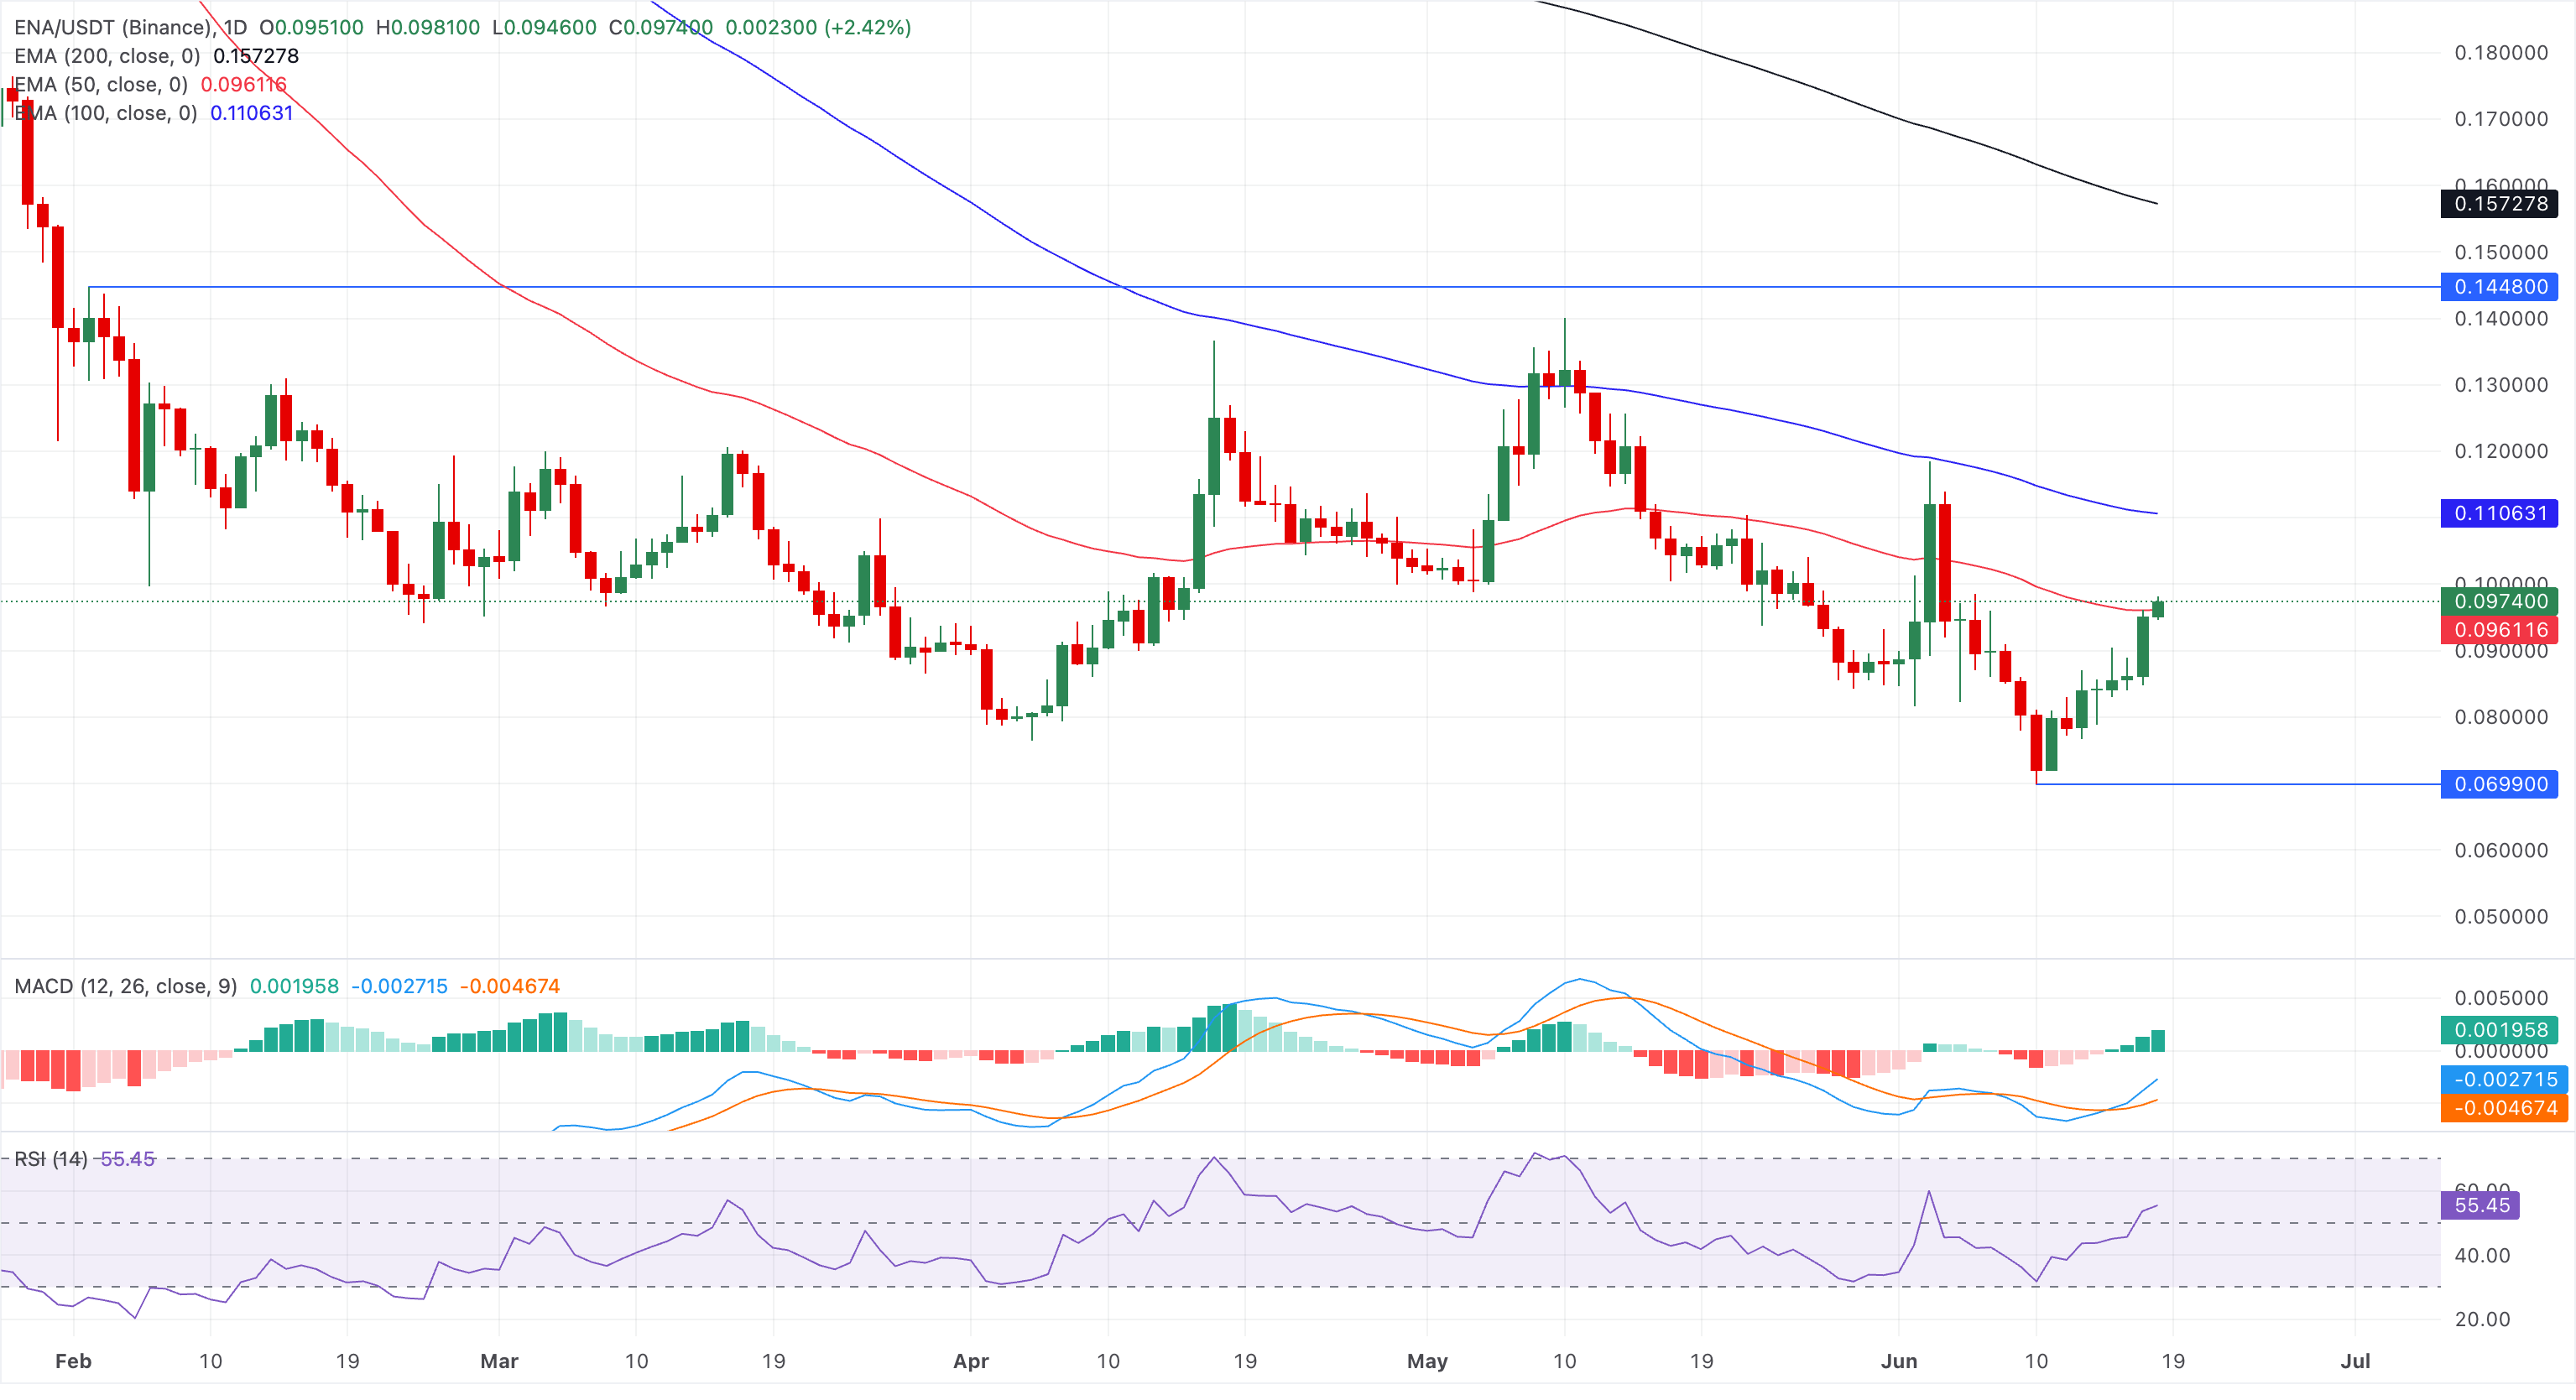
On the downside, the immediate support to monitor is the 50-day EMA at $0.0961; a clear break below this floor would weaken the nascent constructive tone and expose the pair to a deeper pullback.
Stellar trades above $0.2400 at the time of writing, extending a bullish bias trend for the fifth consecutive day. XLM holds well above the 50-, 100-, and 200-day EMAs clustered between roughly $0.18 and $0.20. That said, the rising 50- and 200-day EMAs inch closer to a Golden Cross pattern, which could signal a longer-term upside trend.
The RSI near 66 continues to point to firm positive momentum, while the MACD crossing above its signal line indicates renewed upside momentum, with buyers remaining in control.
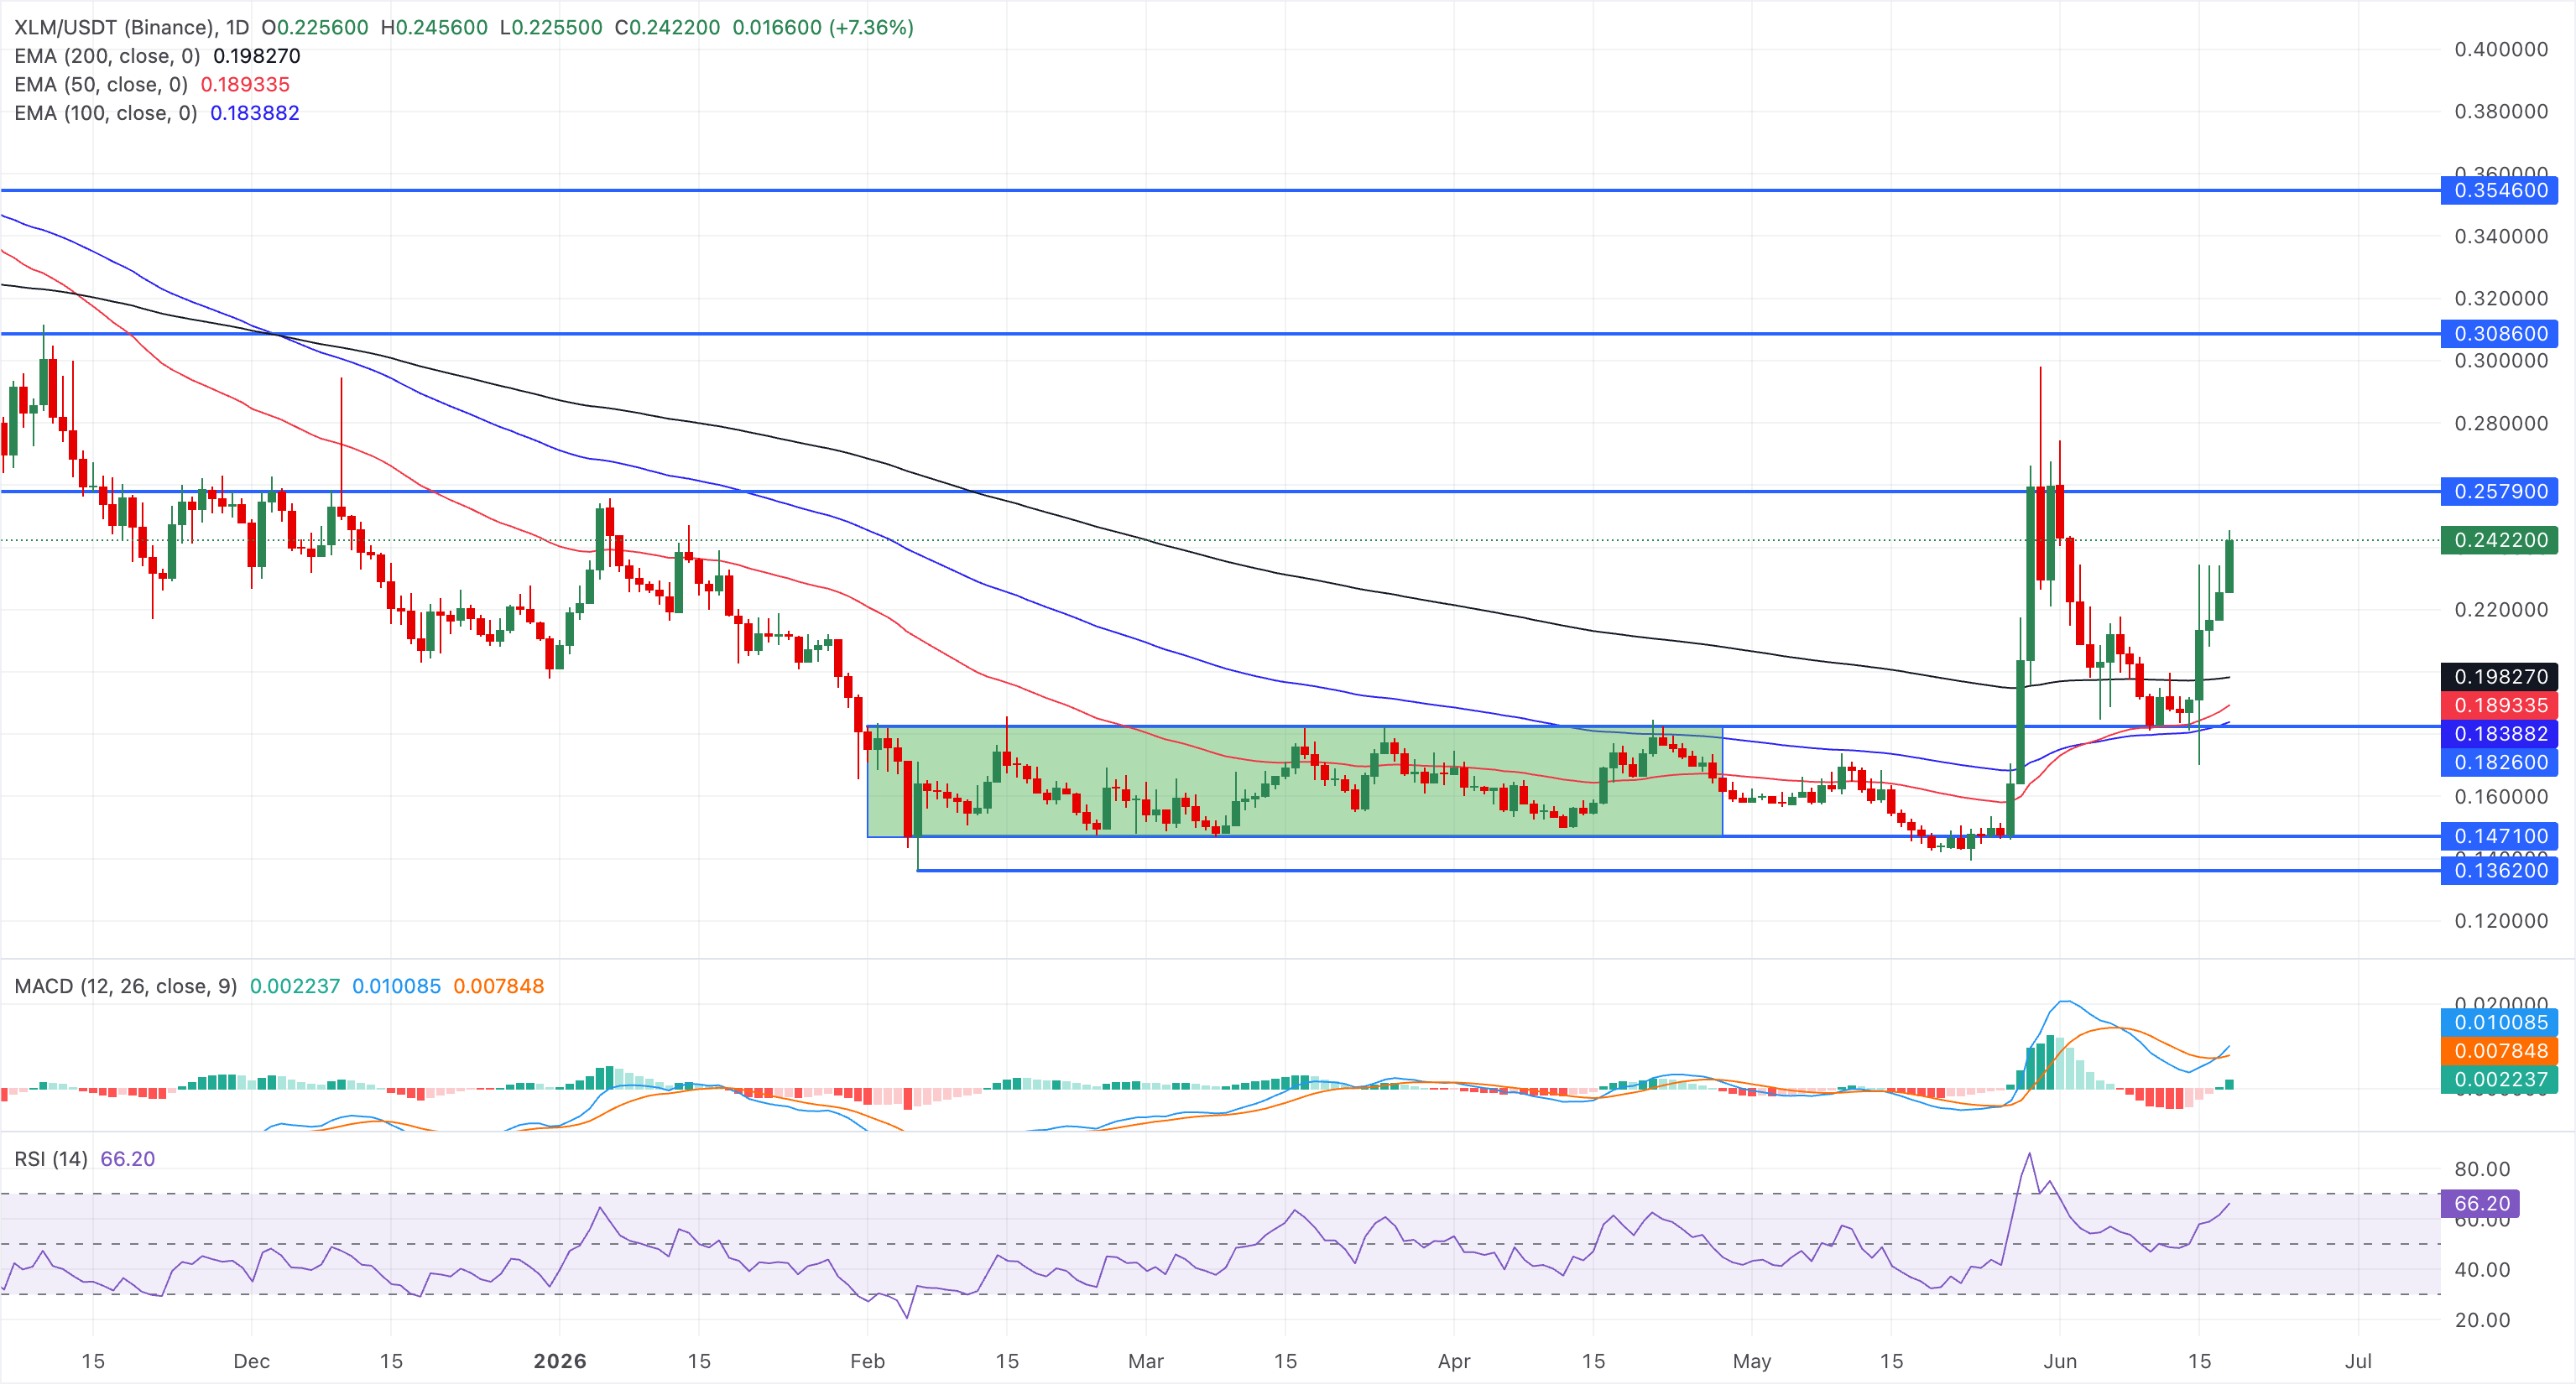
On the flip side, immediate support is seen at the 200-day EMA around $0.1980, with the 50-day EMA near $0.1890 and the 100-day EMA near $0.1840, reinforcing a broader demand band on pullbacks.
(The technical analysis of this story was written with the help of an AI tool.)

100만 명이 넘는 사용자가 FXStreet를 통해 실시간 시장 데이터, 차트 도구, 전문가 인사이트, 포렉스 뉴스를 이용합니다. 포괄적인 경제 캘린더와 교육 웨비나는 트레이더가 정보를 유지하고 신중한 결정을 내리도록 돕습니다. FXStreet는 바르셀로나 본사와 전 세계 지역에 걸쳐 약 60명의 팀으로 구성되어 있습니다.
더 읽기


