
Crypto Overview: Bitcoin retreats amid Middle East tensions – Ondo, Zcash rebound on rising TVL, social activity
작성자 Vishal Dixit
수정됨: 19 May 2026


인기 기사

Bitcoin (BTC) trades around $76,000 on Tuesday amid renewed stress on the US-Iran ceasefire. However, Ondo (ONDO) and Zcash (ZEC) have emerged as top performers over the last 24 hours, with a rebound driven by rising Total Value Locked (TVL) in tokenized stocks and social activity, respectively.
- Bitcoin hovers above $76,000 on Tuesday, edging lower for the fifth consecutive day.
- Donald Trump delays a US military attack on Iran, rebuilding tensions in the Middle East.
- Ondo and Zcash rebound to emerge as top performers over the last 24 hours.
Bitcoin (BTC) trades around $76,000 on Tuesday amid renewed stress on the US-Iran ceasefire. However, Ondo (ONDO) and Zcash (ZEC) have emerged as top performers over the last 24 hours, with a rebound driven by rising Total Value Locked (TVL) in tokenized stocks and social activity, respectively.
Geopolitical risks deepen downside risk in Bitcoin
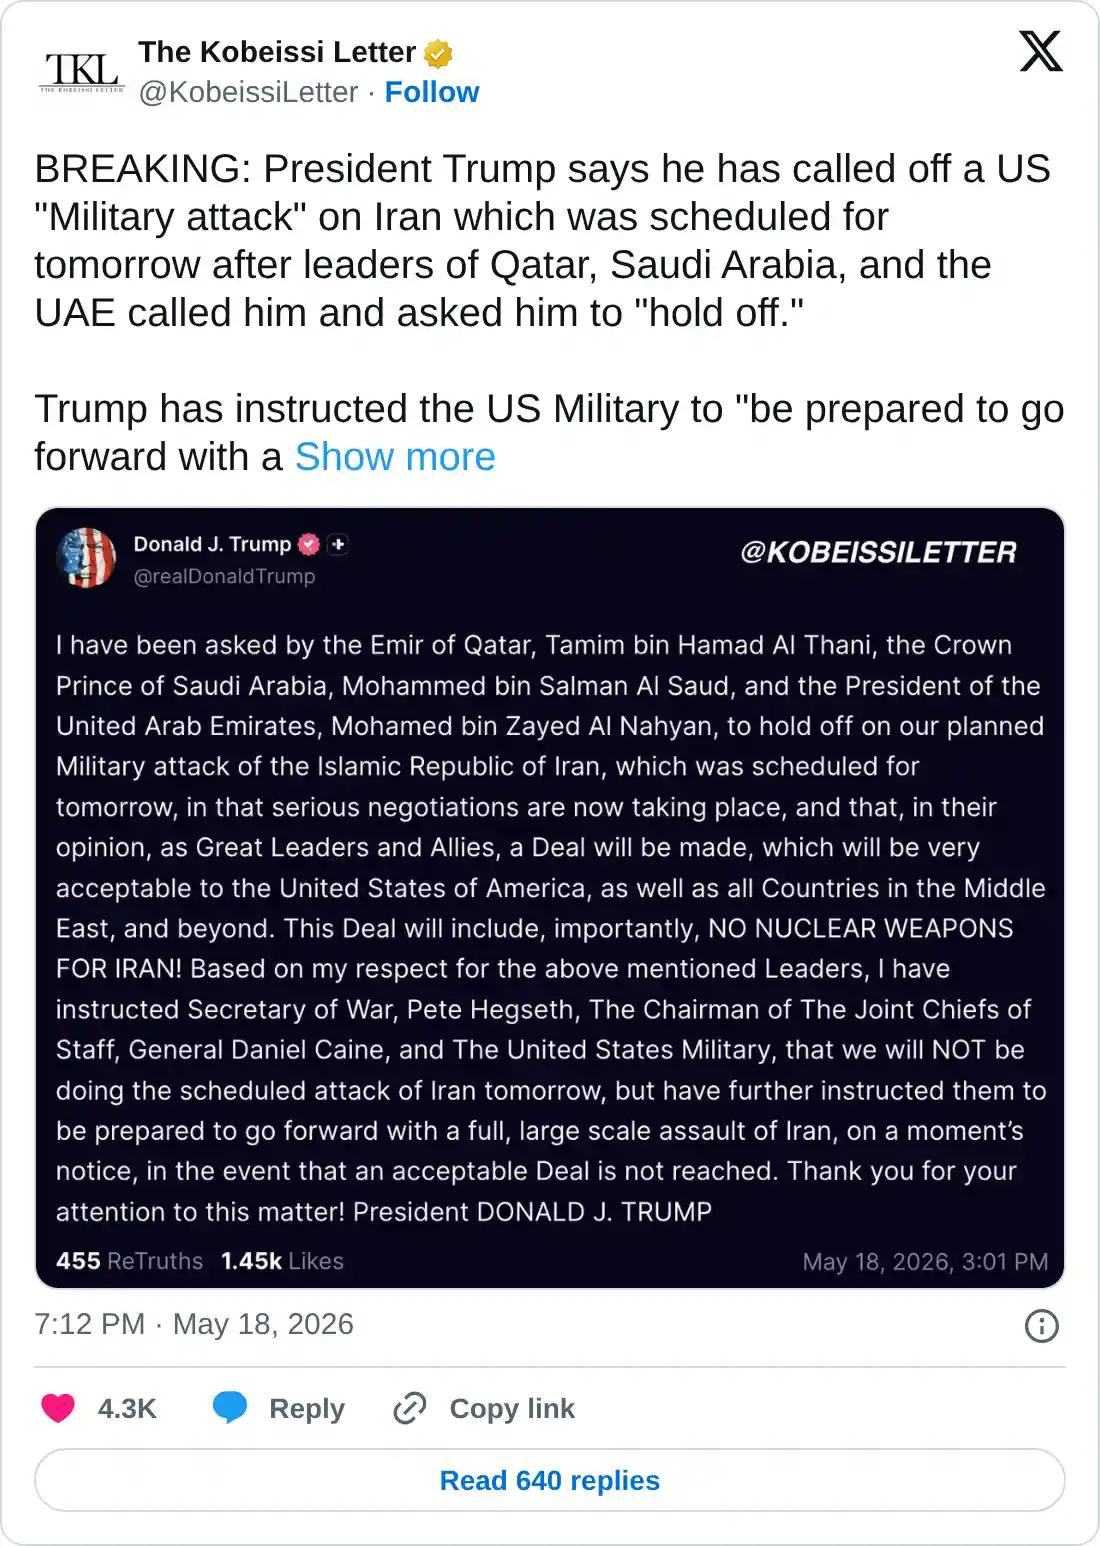
As per US President Donald Trump’s social media post on Monday, the Middle East countries have requested to delay new military actions against Iran. The post reveals that the delayed attacks were planned for Tuesday, but Trump has instructed the US armed forces to be prepared to go forward with a full, large-scale assault on Iran.
Tensions are rebuilding in the Middle East as the US remains persistent on a peace deal that includes “NO NUCLEAR WEAPONS FOR IRAN.”
Bitcoin risks losing $75,000
Bitcoin maintains a bearish near-term bias as it holds beneath a dense Exponential Moving Average (EMA) cap. Price sits just below the 50-day EMA at $76,734 and the 100-day EMA at $76,895, while the 200-day EMA, much higher at $81,688, reinforces the idea that the market is still trading below its longer-term trend yardstick.
Momentum is subdued, with the Relative Strength Index (RSI) hovering around 44 and the Moving Average Convergence Divergence (MACD) line deeply negative, which together suggest lingering downside pressure despite the recent stabilization above the prior trendline break area.
On the downside, the former rising trendline area around $70,571 now serves as the main underlying support; a retreat toward this zone would likely test dip-buying interest, while holding well above it keeps the market in consolidation rather than an outright breakdown.
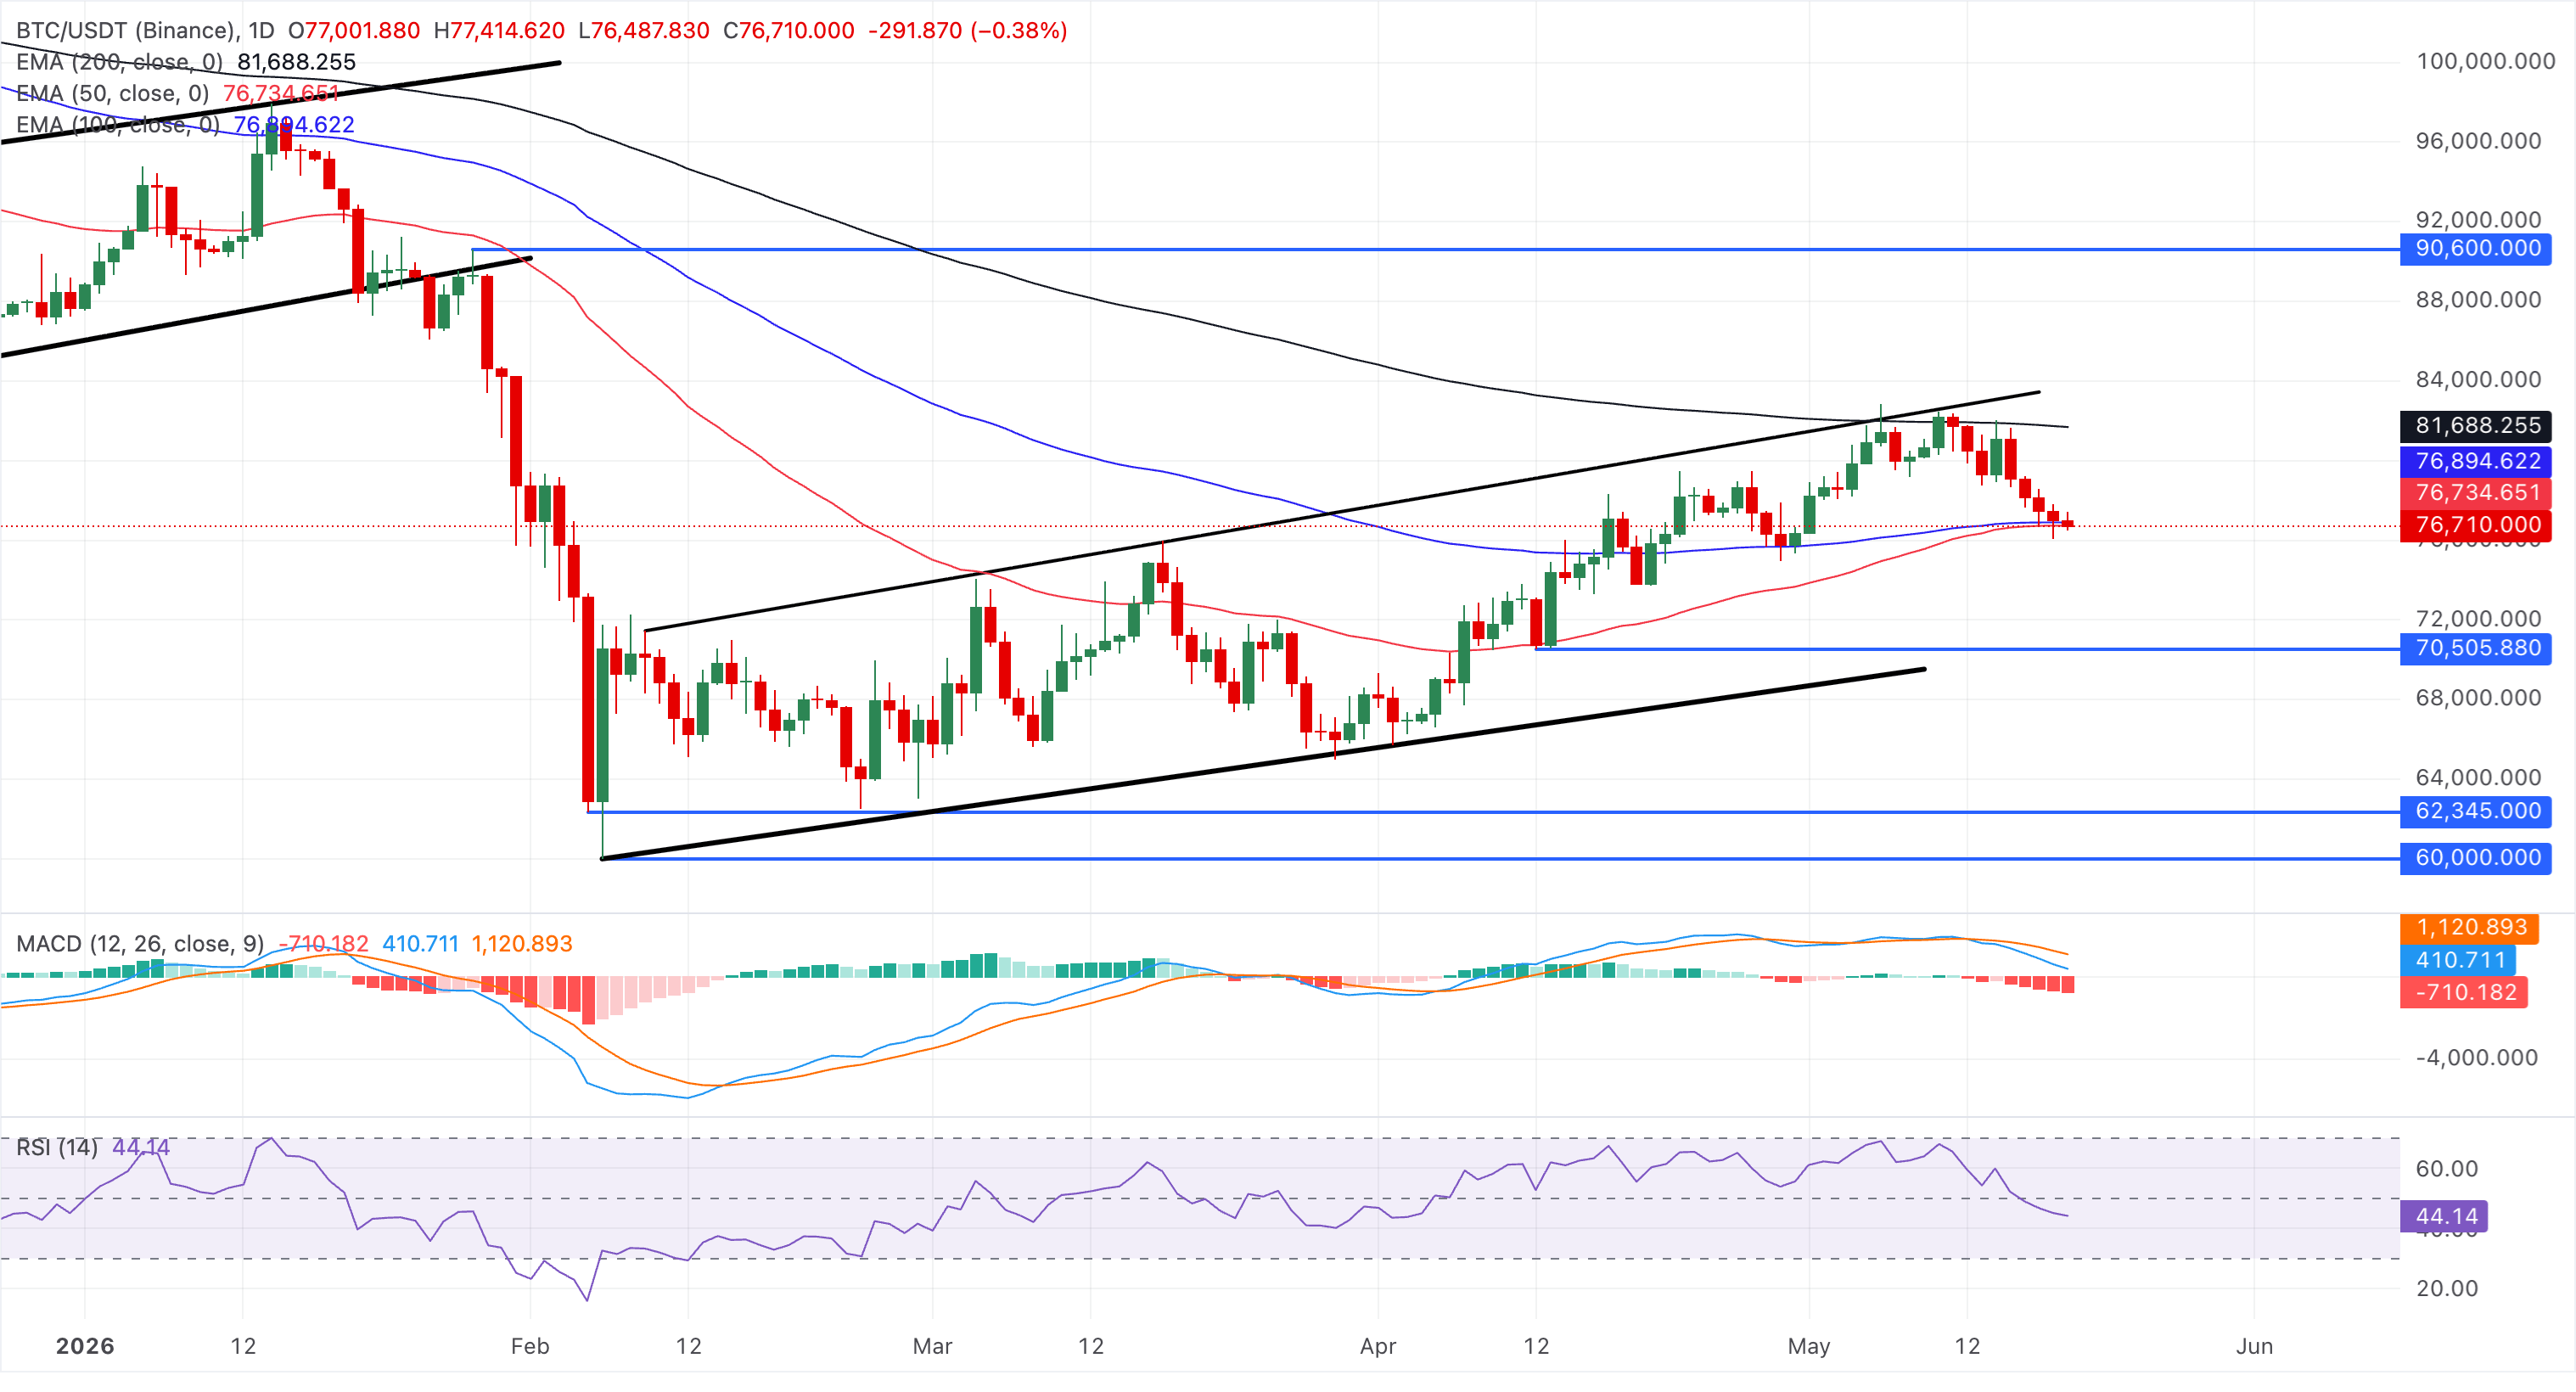
On the topside, immediate resistance is defined first by the 50-day EMA at $76,734, followed closely by the 100-day EMA at $76,895; a sustained break above this tight cluster would be needed to ease the current bearish tone and open the way toward the 200-day EMA near $81,688.
Ondo rallies on rising tokenized stocks' TVL
Tokenized stocks on Ondo have reached a $1.5 billion TVL led by CRCLon (Circle), IVVon (S&P 500 ETF), MUon (Micron), NVDAon (NVIDIA), and IBITon (Bitcoin ETF), which make up roughly 25% of the tokenized stock sector. Amid the rising TVL of on-chain stocks, Ondo executive Katie Wheeler said in an interview, "I wouldn't be surprised if we surpassed $5 billion by year-end. We have a lot of interest, and we're building up quite a pipeline.”
ONDO holds a constructive structure above the 50-day and 100-day EMAs clustered around $0.32 amid growing adoption. However, the price remains capped below the 200-day EMA at $0.4030, keeping the broader bias neutral-to-bearish while the longer-term trend gauge stays overhead.
The RSI hovers near 60, indicating still constructive but moderating momentum, while the MACD sits below its zero line, hinting that upside attempts could fade before a clean break of the 200-day EMA.
Initial resistance is defined by the 200-day EMA at $0.4030; a daily close above this barrier would be needed to ease the broader cap and reopen the path toward higher highs.
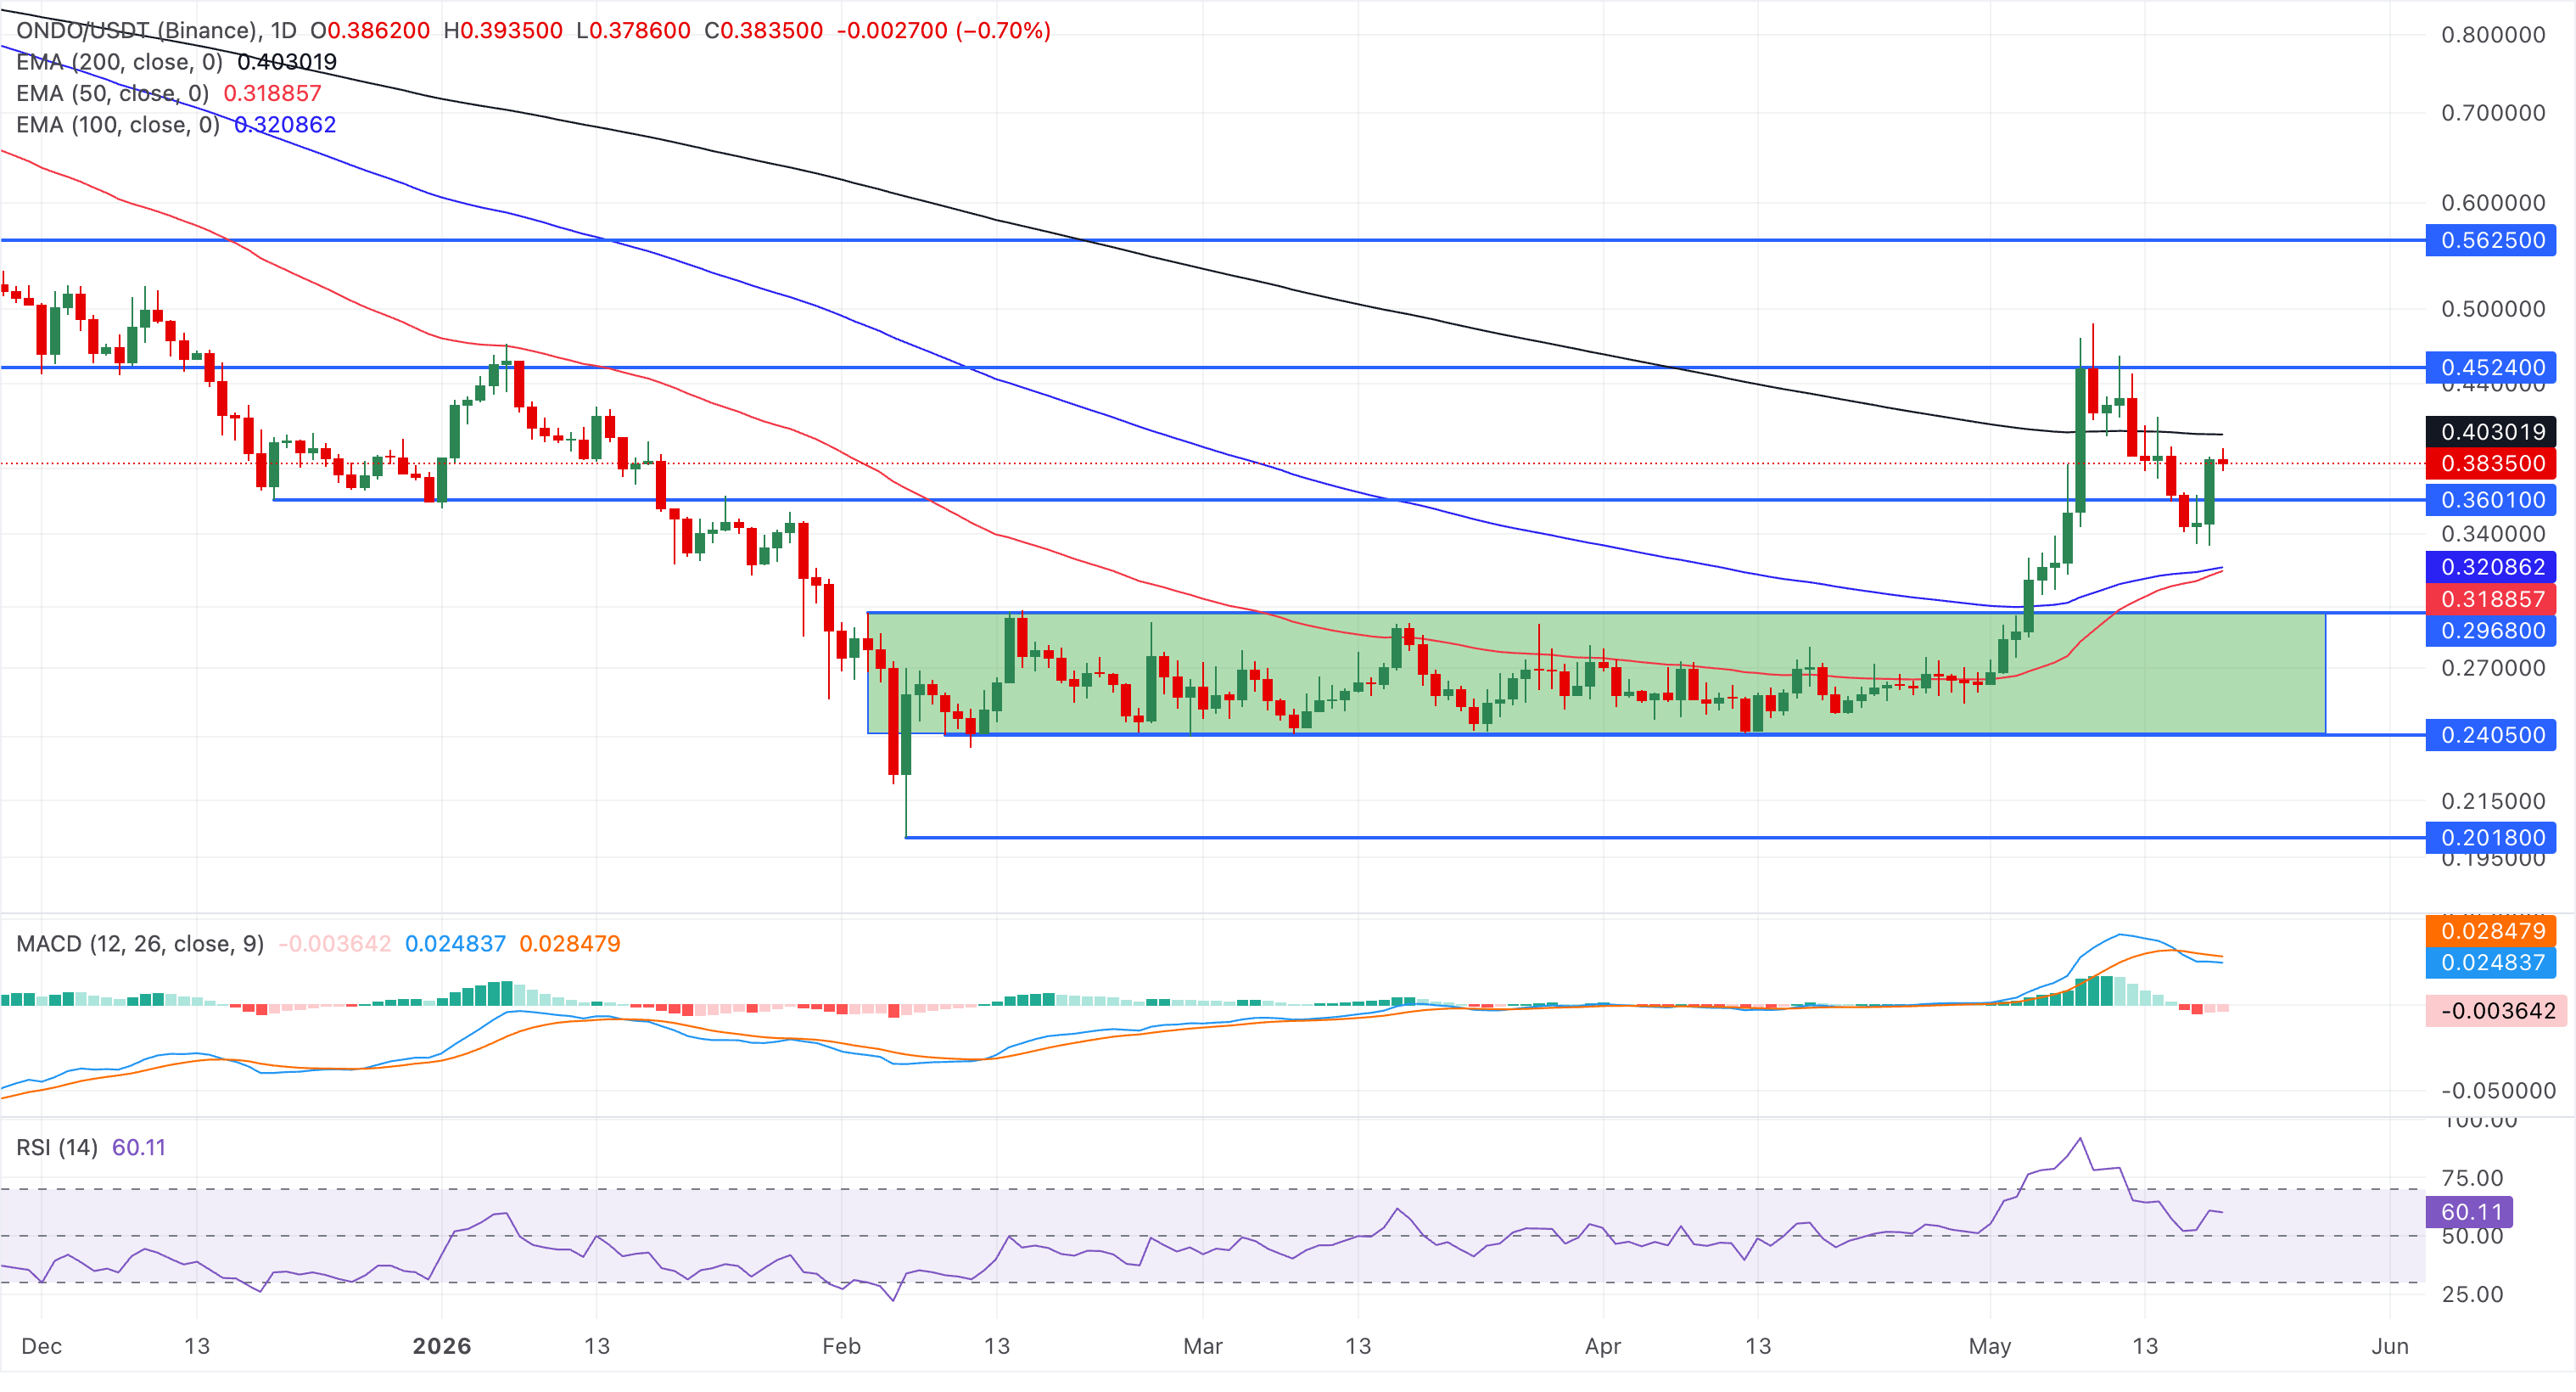
Immediate support lies at the 100-day EMA at $0.3209, followed closely by the 50-day EMA at $0.3189. A sustained drop back through this cluster is likely to reinforce the prevailing medium-term weakness and expose the pair to a deeper retracement.
Zcash rebounds on rising social buzz
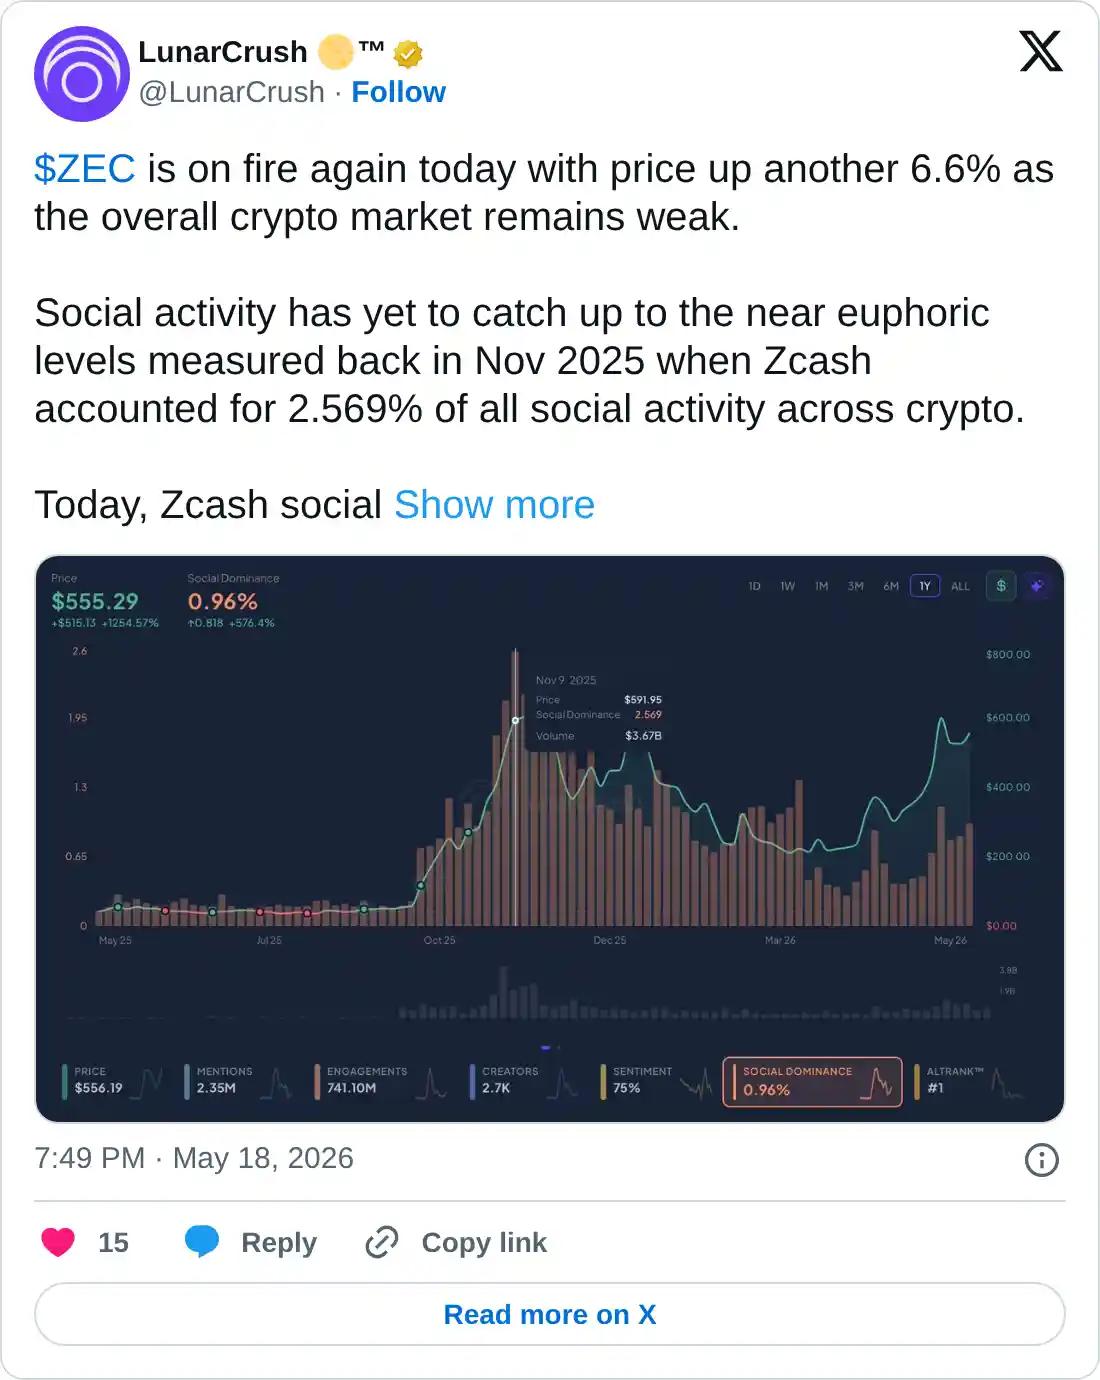
LunarCrush data shows Zcash's social dominance rising to 0.96% of all crypto activity, which supports the price surge. The data also shows further upside for the retail interest before reaching the previous reversal top of 2.569%.
Zcash approaches the $600 threshold for a third consecutive day of recovery, maintaining a clear bullish bias. The privacy coin remains well above the 50-, 100-, and 200-day EMAs at $426, $373, and $329, respectively.
The MACD line reverts to its signal line for a bullish crossover after a minor slip-up last week, hinting that upside momentum is moderating. Meanwhile, the RSI around 65 still reflects firm buying interest rather than overbought stress.
The next notable resistance aligns at the 78.6% Fibonacci retracement at $628, measured from the $750 to $184, followed by the cycle high region around the 100% retracement at $750, where a sustained break would be needed to reassert strong bullish momentum despite the current loss of MACD traction.
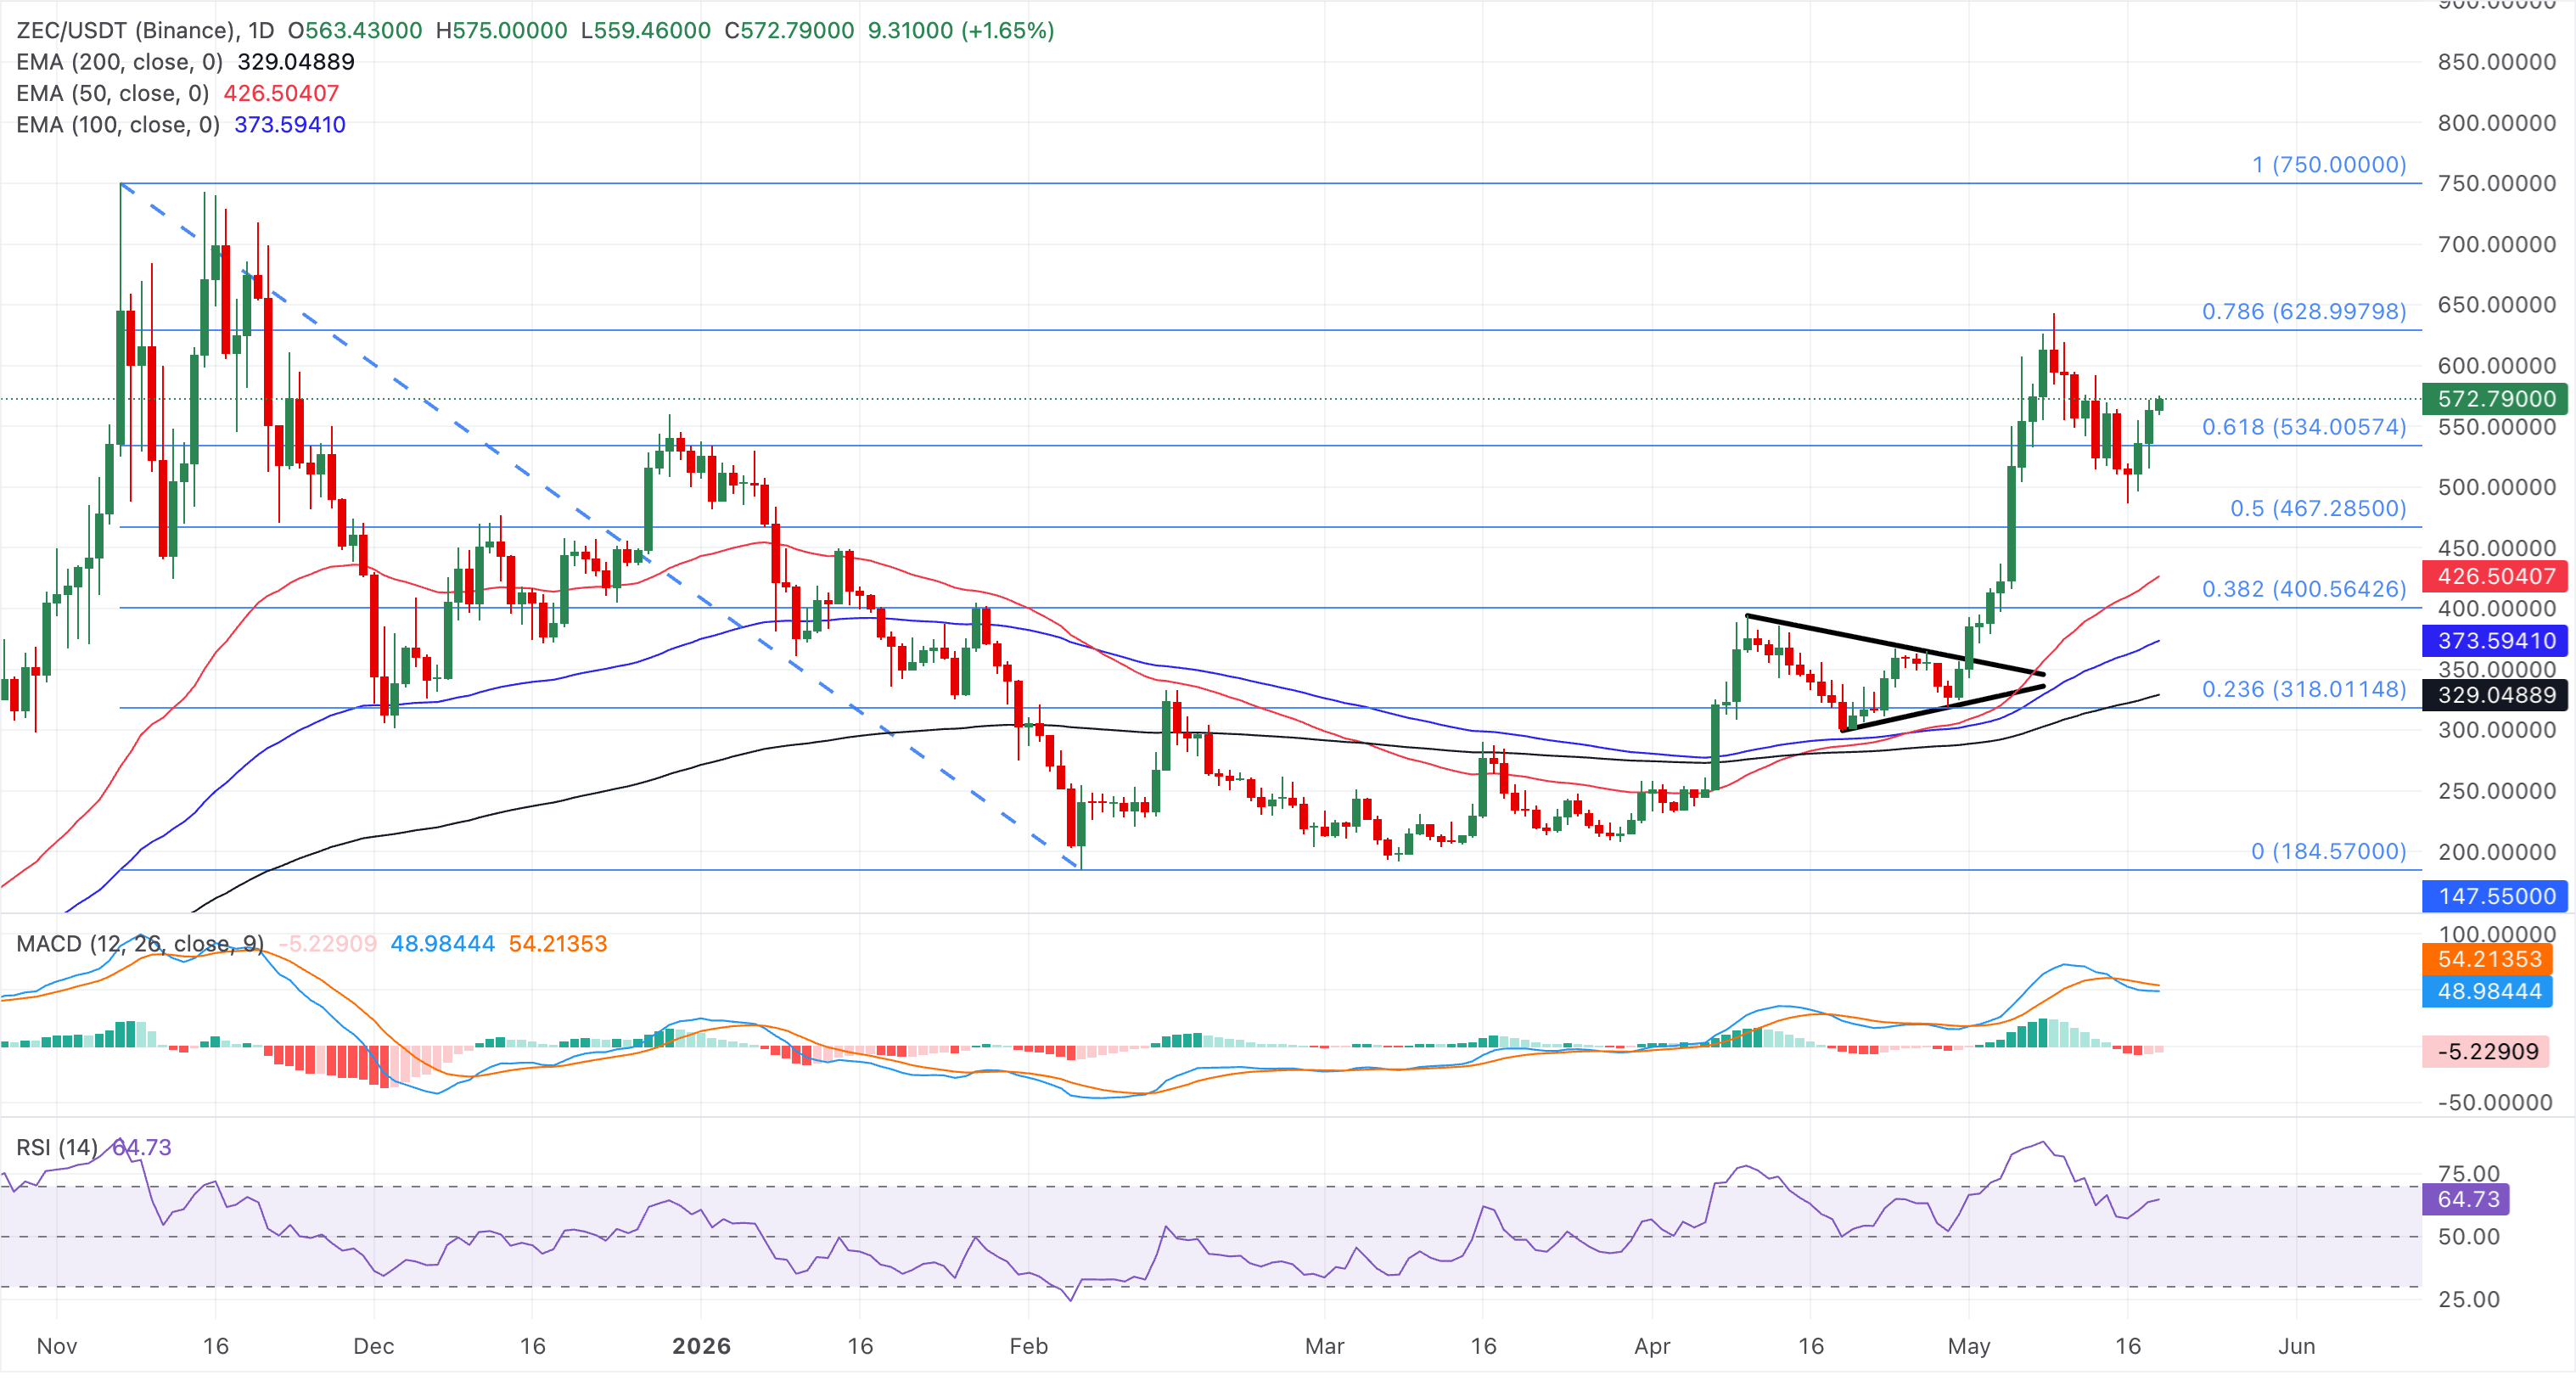
On the flipside, initial support is located near the 61.8% Fibonacci retracement at $534, ahead of the 50% retracement at $467.
(The technical analysis of this story was written with the help of an AI tool.)

100만 명이 넘는 사용자가 FXStreet를 통해 실시간 시장 데이터, 차트 도구, 전문가 인사이트, 포렉스 뉴스를 이용합니다. 포괄적인 경제 캘린더와 교육 웨비나는 트레이더가 정보를 유지하고 신중한 결정을 내리도록 돕습니다. FXStreet는 바르셀로나 본사와 전 세계 지역에 걸쳐 약 60명의 팀으로 구성되어 있습니다.
더 읽기


