
Crypto Overview: Bitcoin wavers around $80,000 – Hyperliquid and Flare rally
작성자 Vishal Dixit
수정됨: 15 May 2026


인기 기사

Bitcoin (BTC) hovers around $80,000 at press time on Friday, as the broader crypto market sentiment steadies amid Donald Trump’s visit to China, while the Iran war stalemate persists.
- Bitcoin resurfaces above $80,000 on Friday, maintaining short-term indecisiveness.
- Market sentiment holds stable as Donald Trump visits China amid lingering US-Iran tensions.
- Hyperliquid and Flare extend gains over the last 24 hours, emerging as top performers.
Bitcoin (BTC) hovers around $80,000 at press time on Friday, as the broader crypto market sentiment steadies amid Donald Trump’s visit to China, while the Iran war stalemate persists. However, altcoins such as Hyperliquid (HYPE) and Flare (FLR) have emerged as top performers over the last 24 hours with double-digit gains.
Bitcoin encounters a strong resistance wall
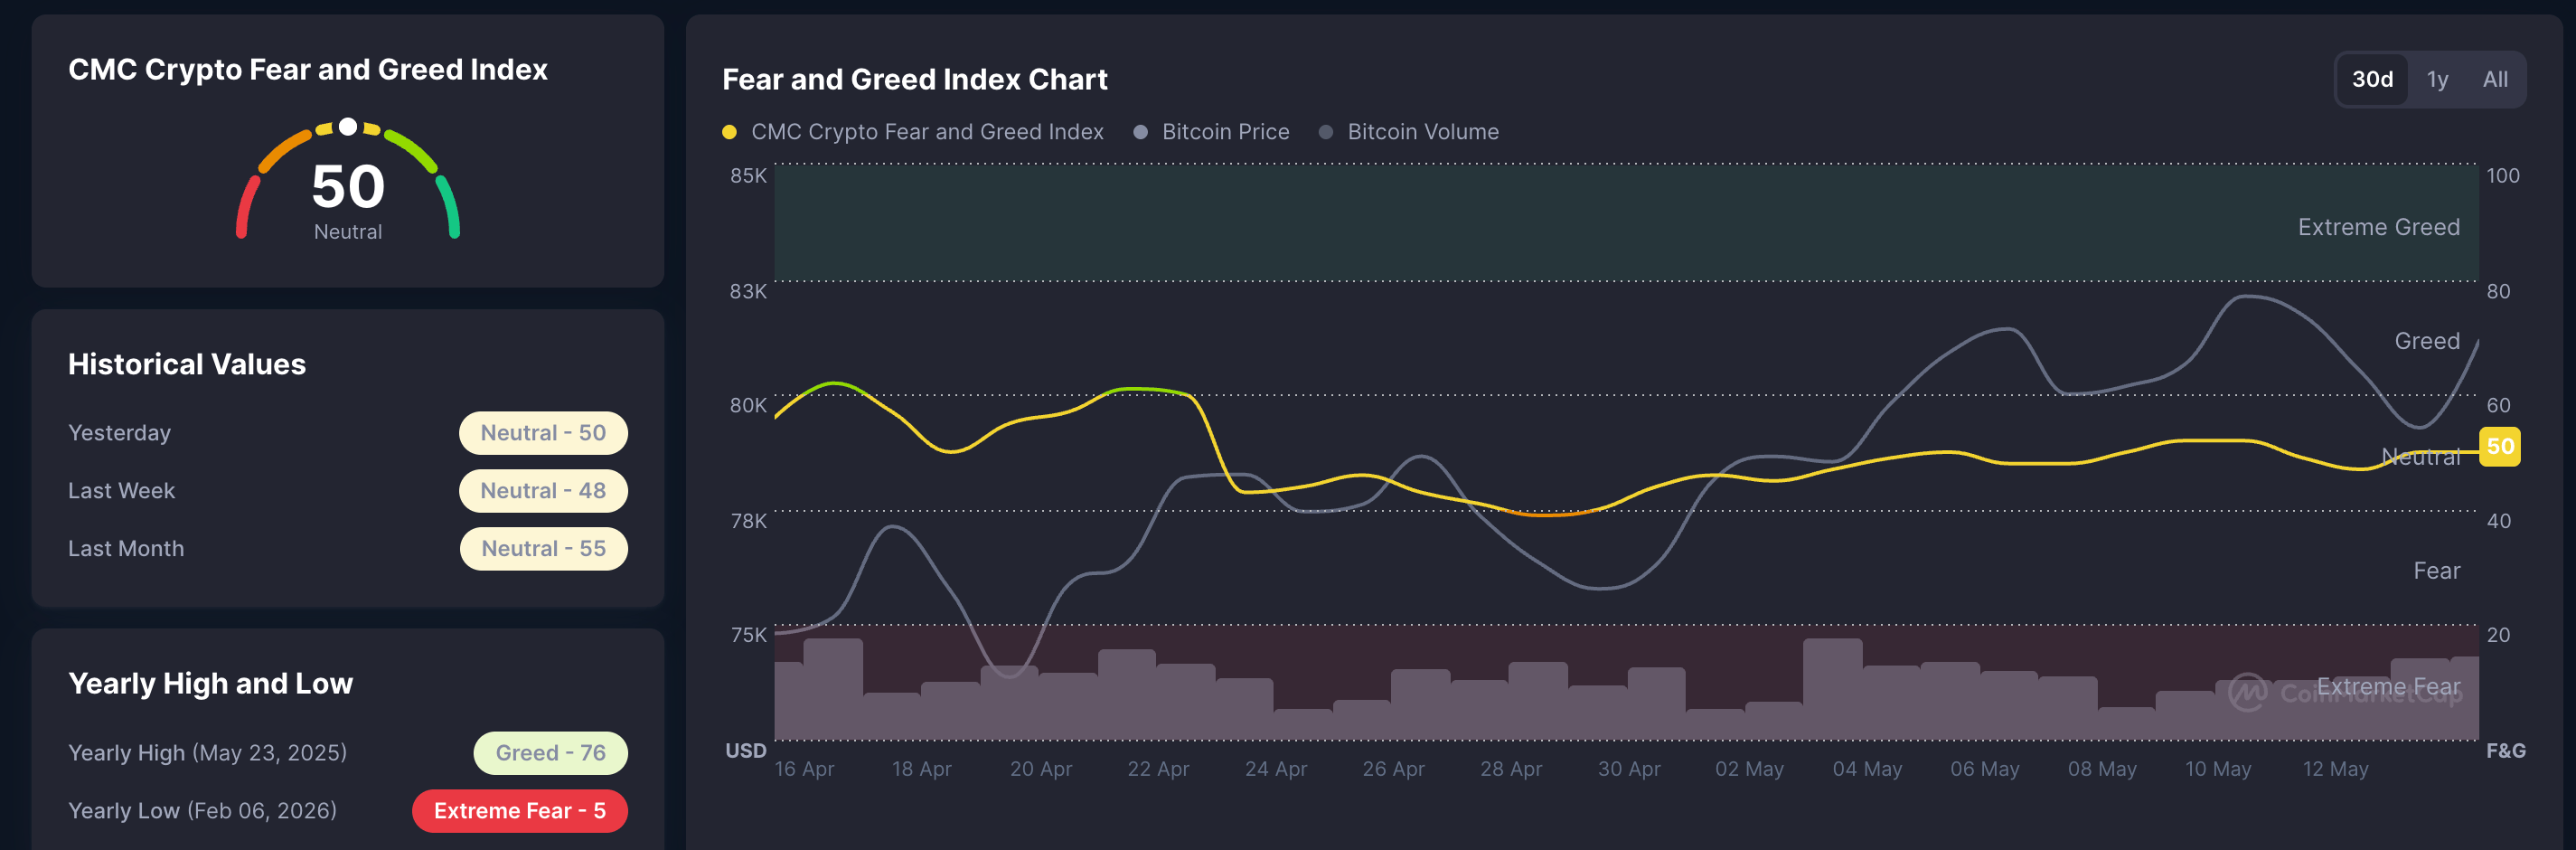
Bitcoin’s instability around $80,000 over the last few days keeps the broader market sentiment trapped in neutral territory. CoinMarketCap’s Crypto Fear and Greed Index at 50 reaffirms the market's indecisive mood, while multiple downticks so far this month are consistent with bearish whipsaws.
Bitcoin retains a broadly constructive bullish bias as it holds well above the 50-day Exponential Moving Average (EMA) at $76,711. However, the BTC price remains capped below the 200-day EMA at $82,769, close to the overhead ascending trendline, which serves as the next key structural barrier.
The Relative Strength Index (RSI) around 59 suggests positive but not overextended momentum, while the Moving Average Convergence Divergence (MACD) sits in negative territory after a bearish crossover on Tuesday, hinting that upside traction is moderating.
On the downside, immediate support is provided by the 50-day EMA at $76,711, with deeper demand expected near the former trendline break at $70,157 if a broader correction unfolds.
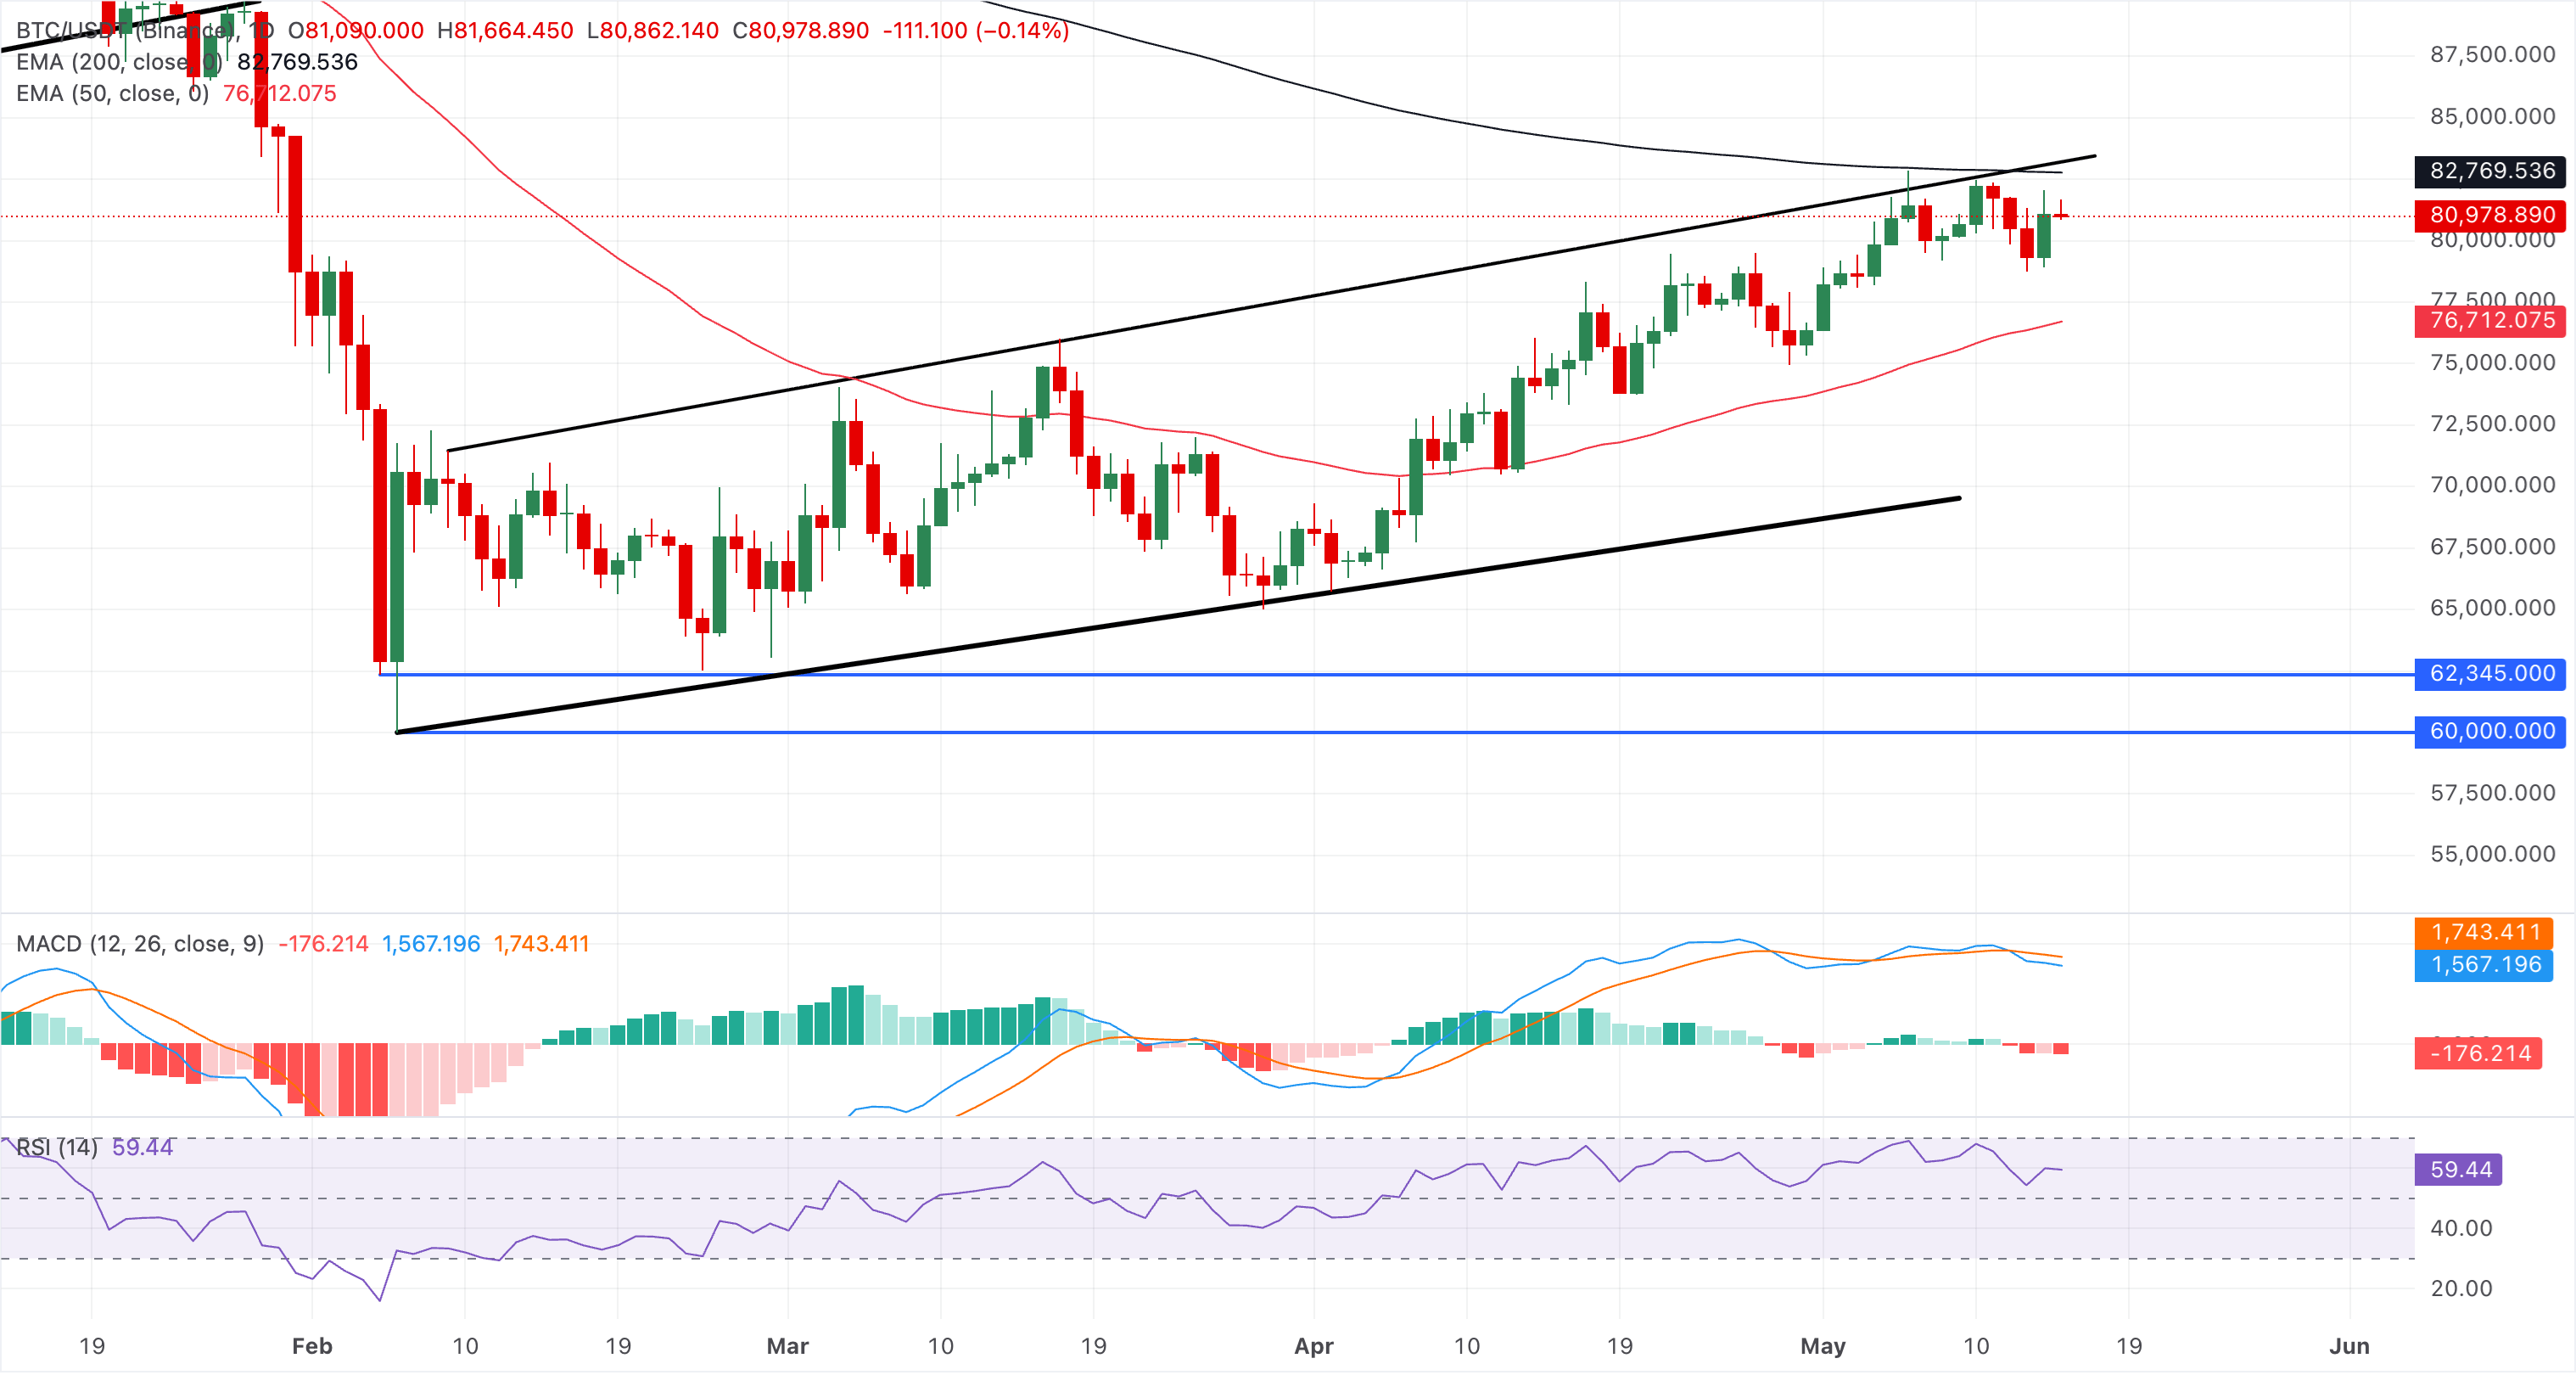
On the topside, the 200-day EMA at $82,769 is the first notable resistance level; a daily close above this level would strengthen the bullish case.
Hyperliquid and Flare extend rally
Hyperliquid trades above $45.00 at press time on Friday, extending Thursday's near 14% gains, which marked a positive rebound from the support trendline of a larger rising channel pattern. The reclaimed distance from the long-term upward support trendline, whose break price sits near $38.33, reinforces an underlying demand zone.
A decisive daily close above the April 16 high at $45.77 could open the path toward the channel's overhead trendline close to the August 27 high at $51.15.
Meanwhile, the MACD crosses above its signal line, flipping the histograms green and the RSI near 62 hints that buyers retain control without yet pushing conditions into extreme overbought territory.
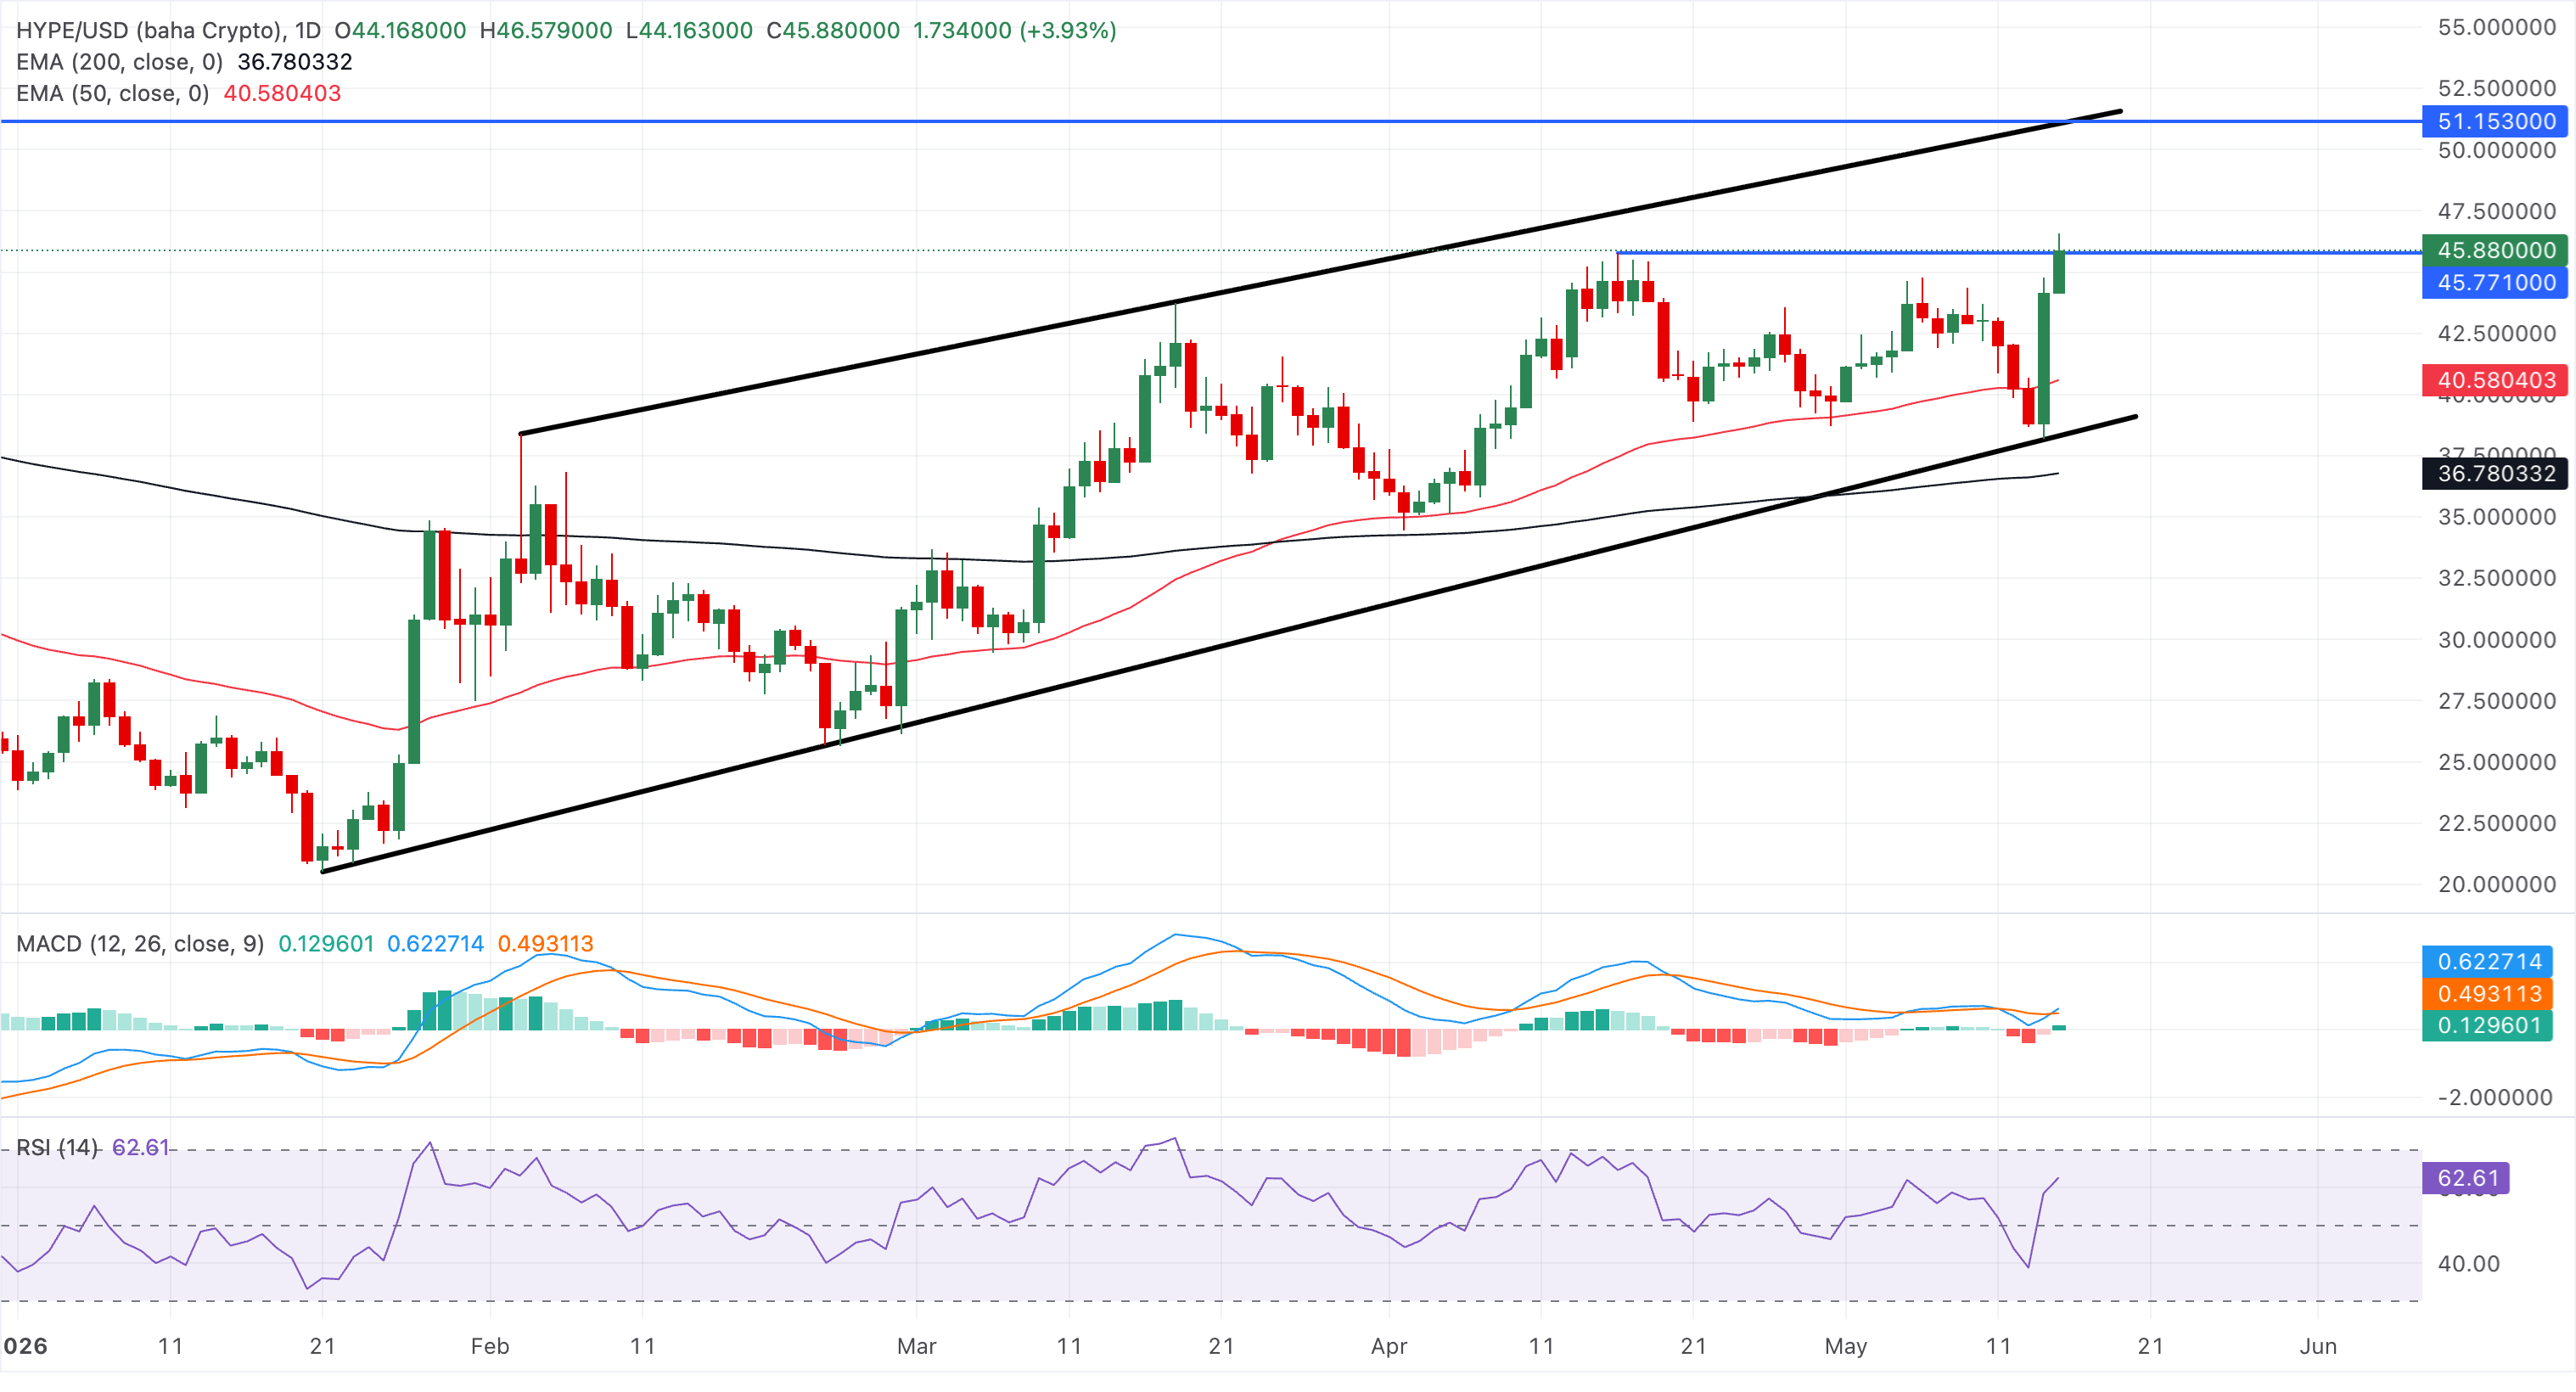
Initial support is seen at the 50-day EMA around $40.58, with the prior trendline break area at $38.33 and the 200-day EMA near $36.22 providing a deeper demand band in the event of a pullback.
On the other hand, Flare is up nearly 3% at the time of writing on Friday, extending the double bottom reversal from the $0.00735 support floor. FLR hovers above the 50-day EMA at $0.0082, preserving a constructive near-term bias, but is still capped below the 200-day EMA at $0.0109, which outlines the next significant topside barrier.
Momentum is stretched, with the RSI hovering deep in overbought territory near 81, while the MACD line keeps a steady rise with its signal line, suggesting the uptrend remains in place but increasingly vulnerable to corrective pullbacks.
A daily close above the $0.0100 psychological threshold could extend the rally toward the 200-day EMA at $0.0109, turning that long-term gauge into a more solid base in the sessions ahead.
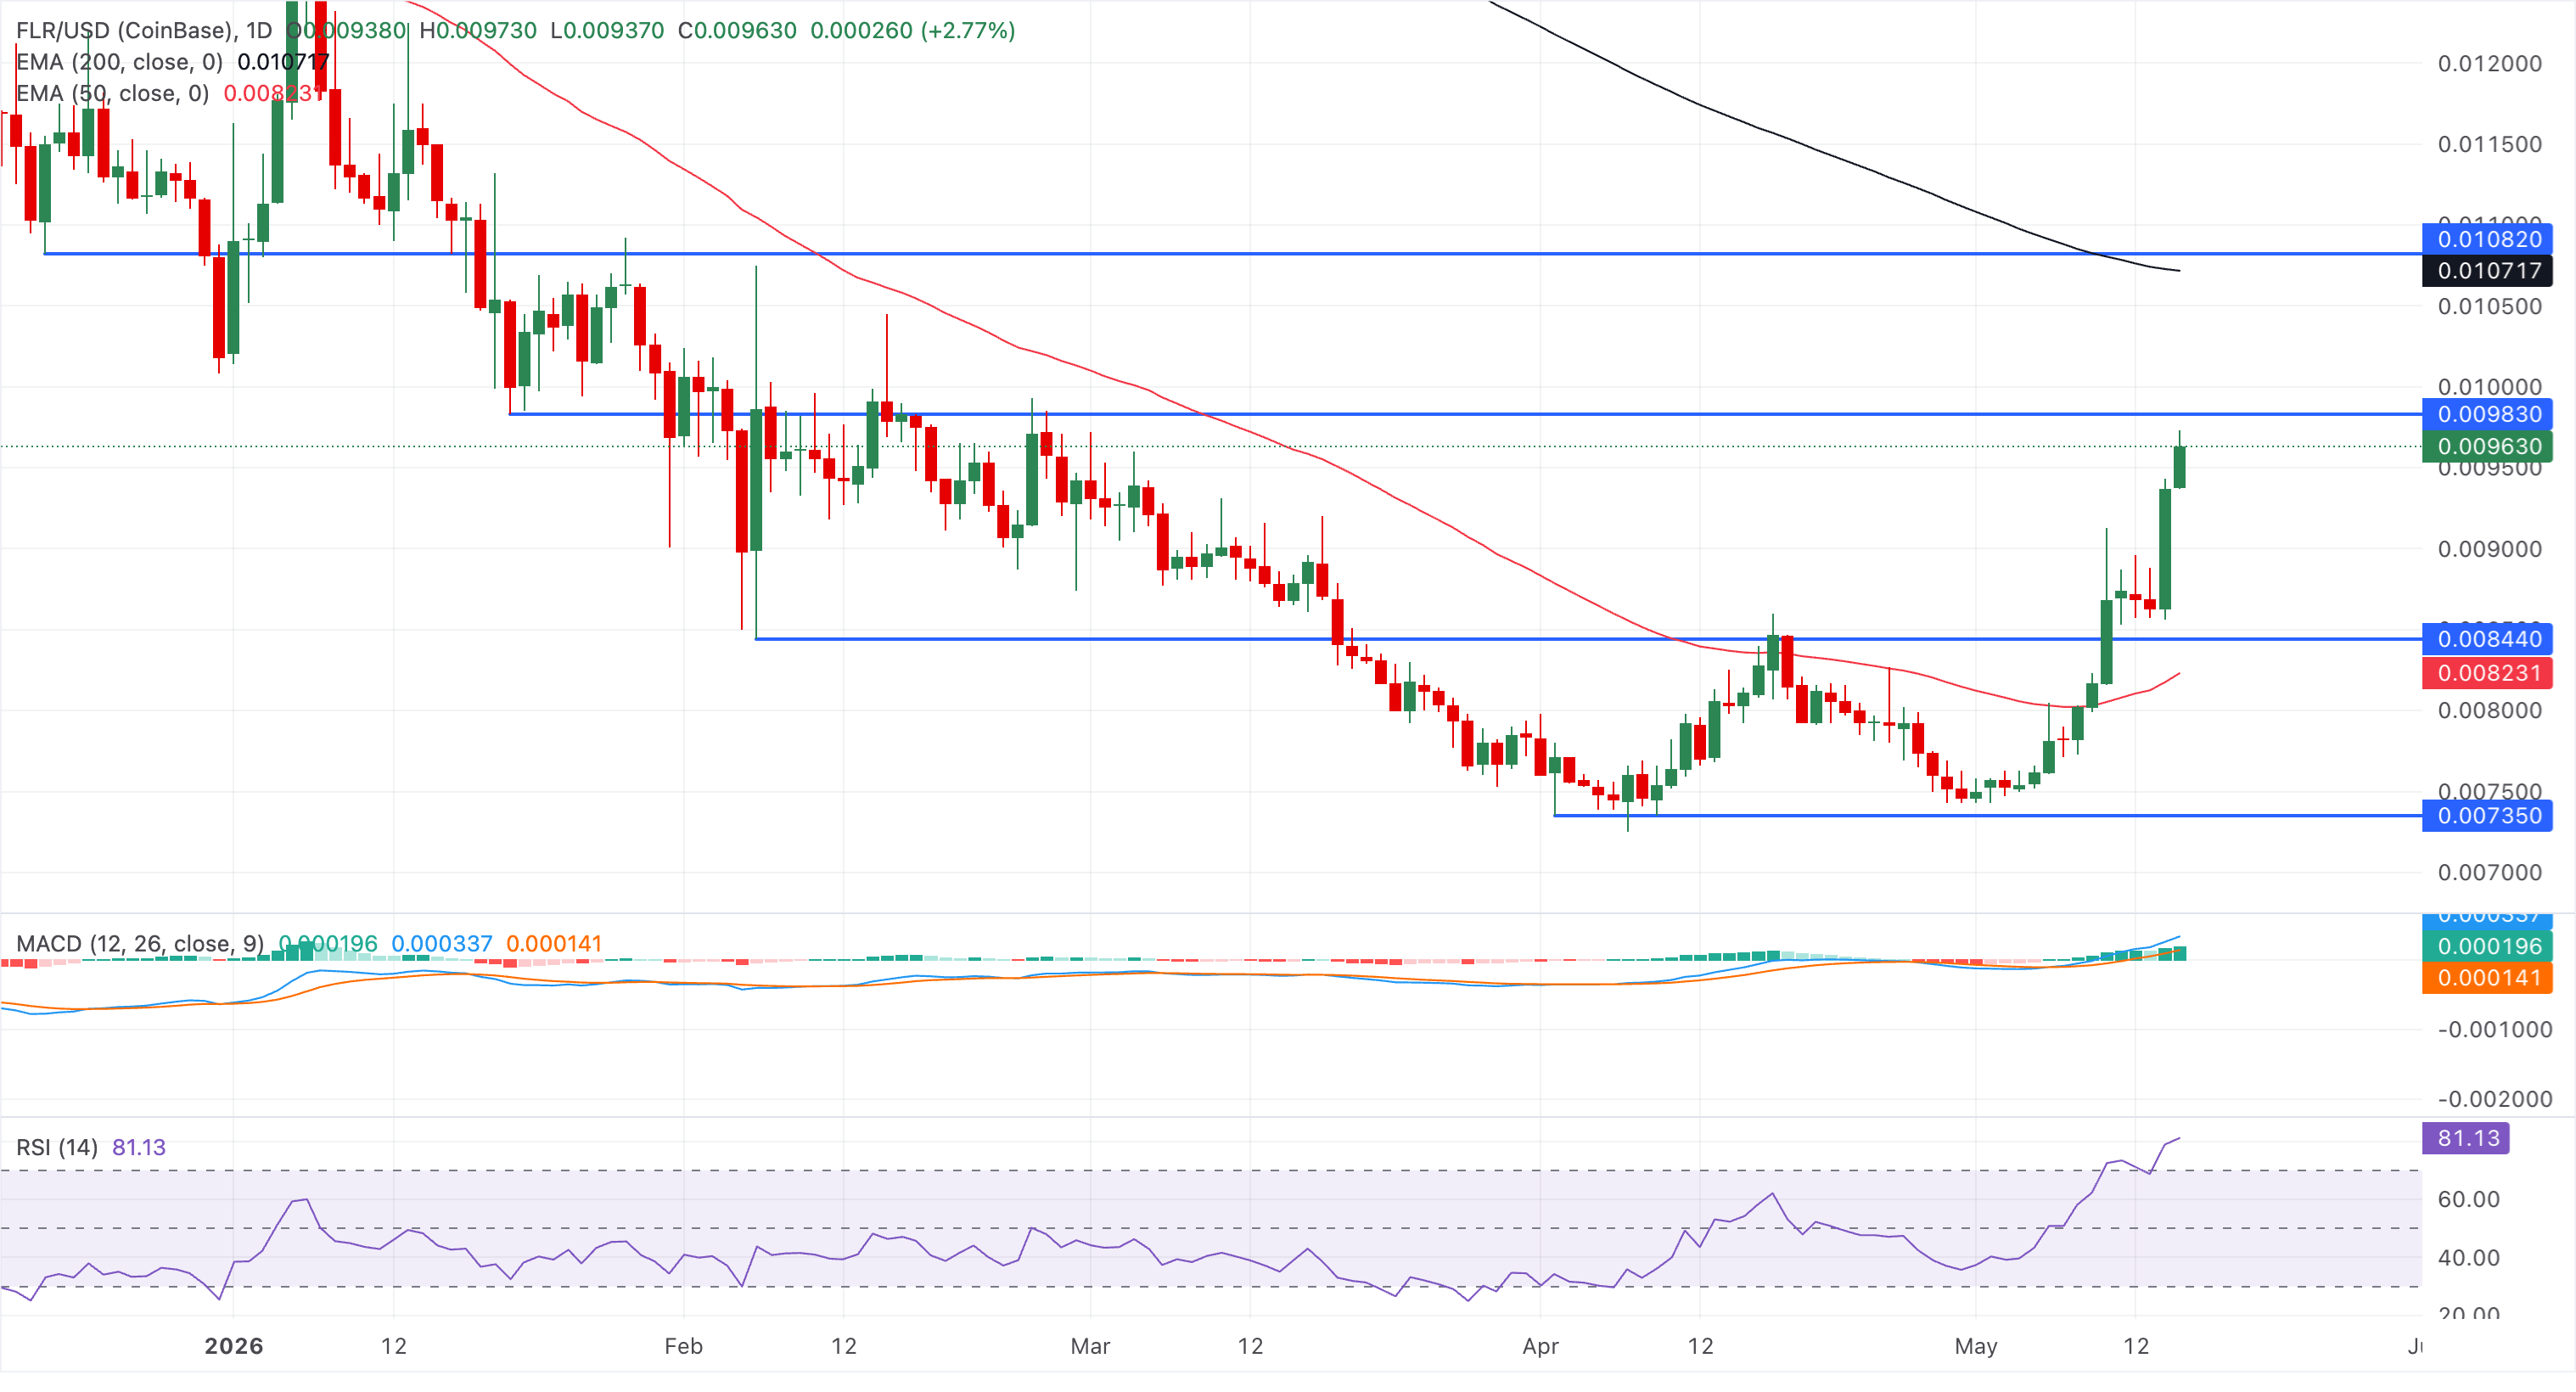
Looking down, initial protection is seen at the 50-day EMA at $0.0082, where a break would weaken the bullish structure and expose deeper retracement risk toward prior consolidation areas below the $0.0080 handle.
(The technical analysis of this story was written with the help of an AI tool.)

100만 명이 넘는 사용자가 FXStreet를 통해 실시간 시장 데이터, 차트 도구, 전문가 인사이트, 포렉스 뉴스를 이용합니다. 포괄적인 경제 캘린더와 교육 웨비나는 트레이더가 정보를 유지하고 신중한 결정을 내리도록 돕습니다. FXStreet는 바르셀로나 본사와 전 세계 지역에 걸쳐 약 60명의 팀으로 구성되어 있습니다.
더 읽기


