
Crypto Today: Bitcoin, Ethereum hold steady amid ETF inflows, XRP extends decline
작성자 John Isige
수정됨: 31 Mar 2026


인기 기사

The cryptocurrency market is sending mixed signals on Tuesday amid the war in the Middle East and sticky macroeconomic uncertainty.
- Bitcoin pares losses above $67,000, supported by the resurgence of inflows into US-listed spot ETFs.
- Ethereum remains above $2,000 as institutional interest mildly returns with ETFs attracting nearly $5 million in inflows on Monday.
- XRP sellers tighten their grip as the price falls toward $1.30 support on Tuesday.
The cryptocurrency market is sending mixed signals on Tuesday amid the war in the Middle East and sticky macroeconomic uncertainty. Bitcoin (BTC) holds steady above $67,000, up from its daily low of $66,348 at the time of writing, while Ethereum (ETH) remains above $2,000, reflecting neutral-to-bullish resilience. Meanwhile, Ripple (XRP) is struggling to stay above support at $1.30, extending its decline for the third day in a row.
Bitcoin and Ethereum ETF inflows return as prices hold steady
Interest in digital investment products has been shaky amid the United States (US) and Israel’s war with Iran, as evidenced by outflows of approximately $414 million last week. Bitcoin investment products recorded outflows totaling $194 million, according to a CoinShares report released on Monday.
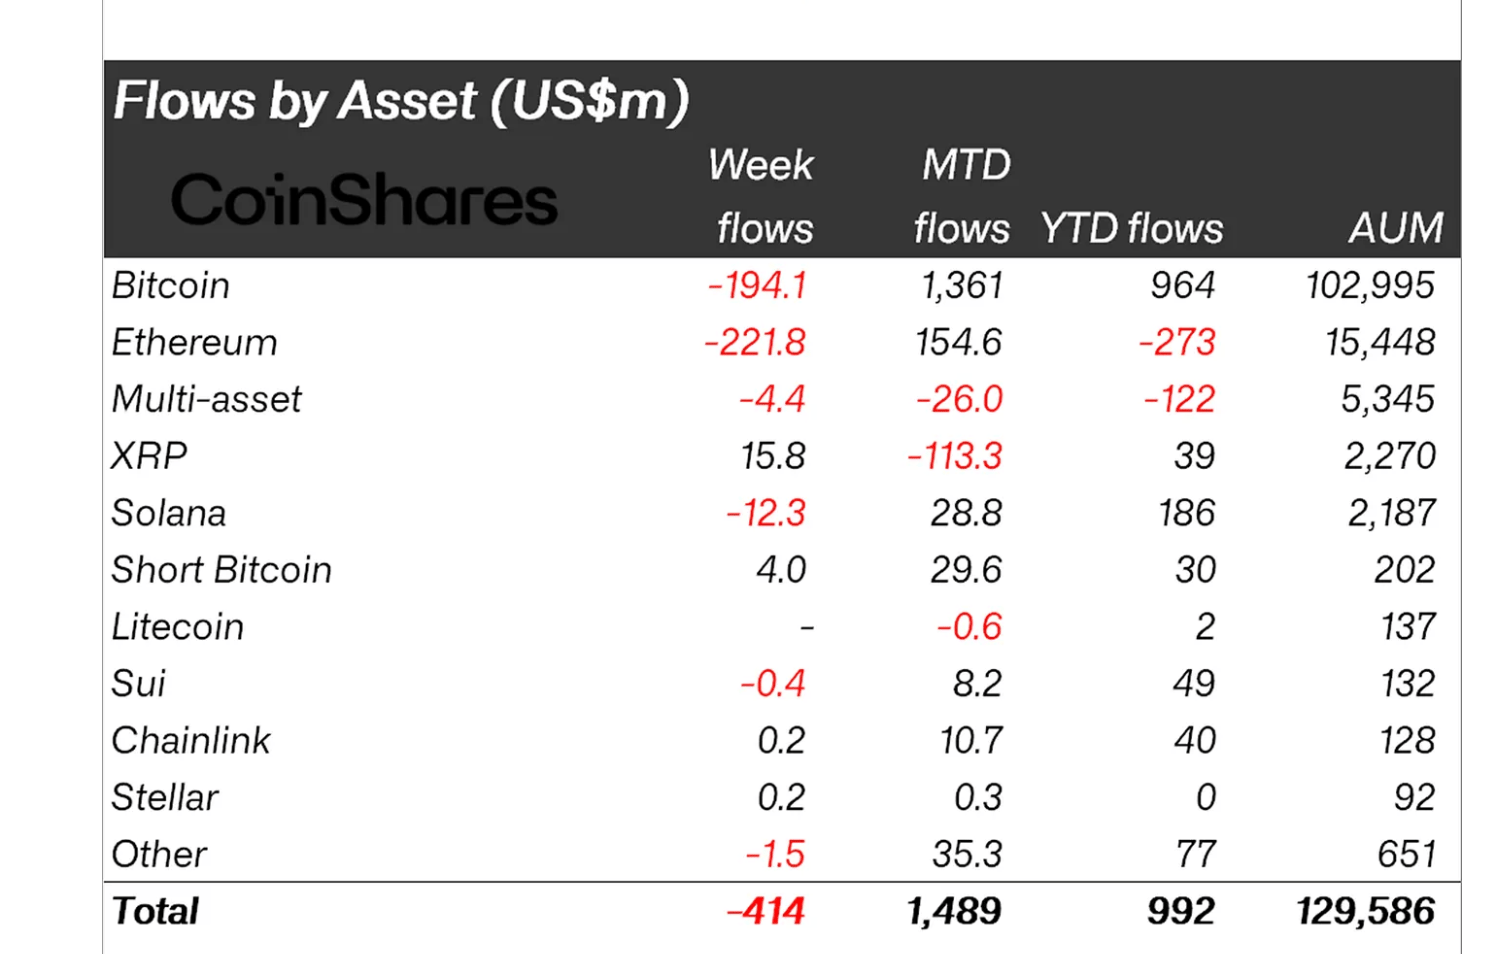
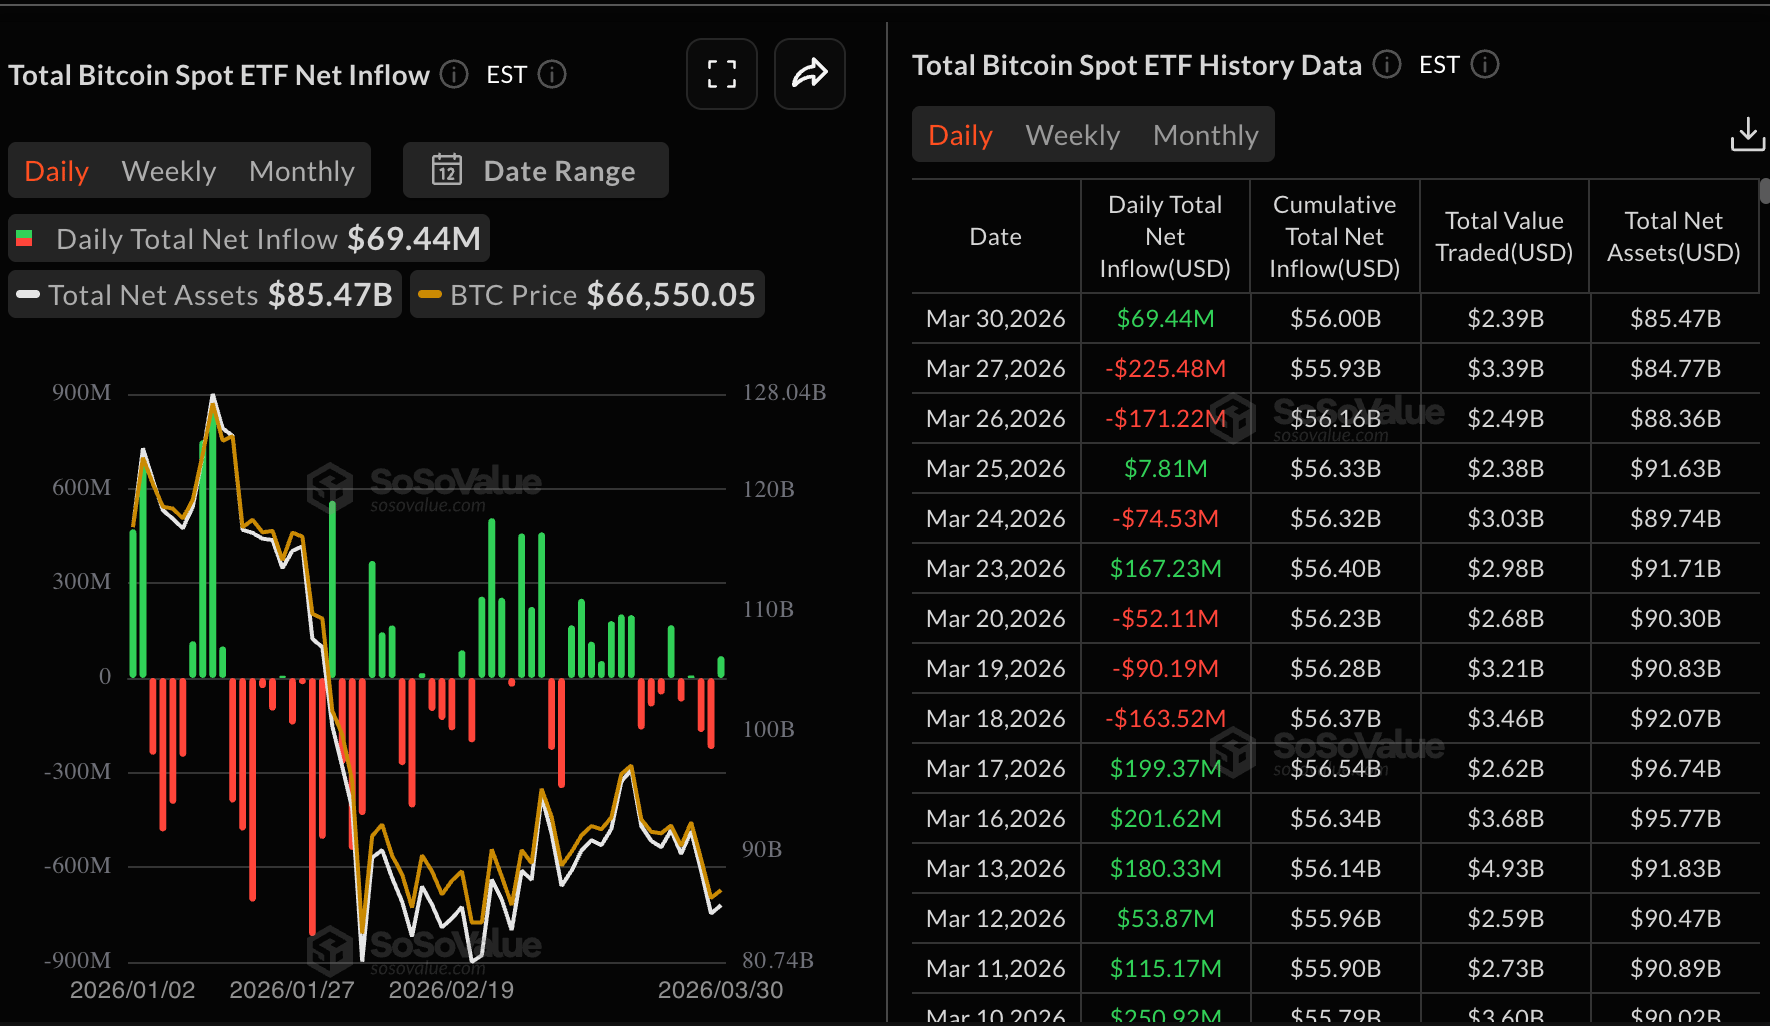
However, a shift appears to be underway in the Exchange-Traded Funds (ETFs) market this week, as US-listed Bitcoin spot ETFs recorded inflows of roughly $64 million on Monday.
The turnaround in ETFs has seen cumulative inflows average $56 billion, with net assets under management at $85.47 billion. If inflows are steady this week, sentiment around Bitcoin could improve and back a sustained price recovery.
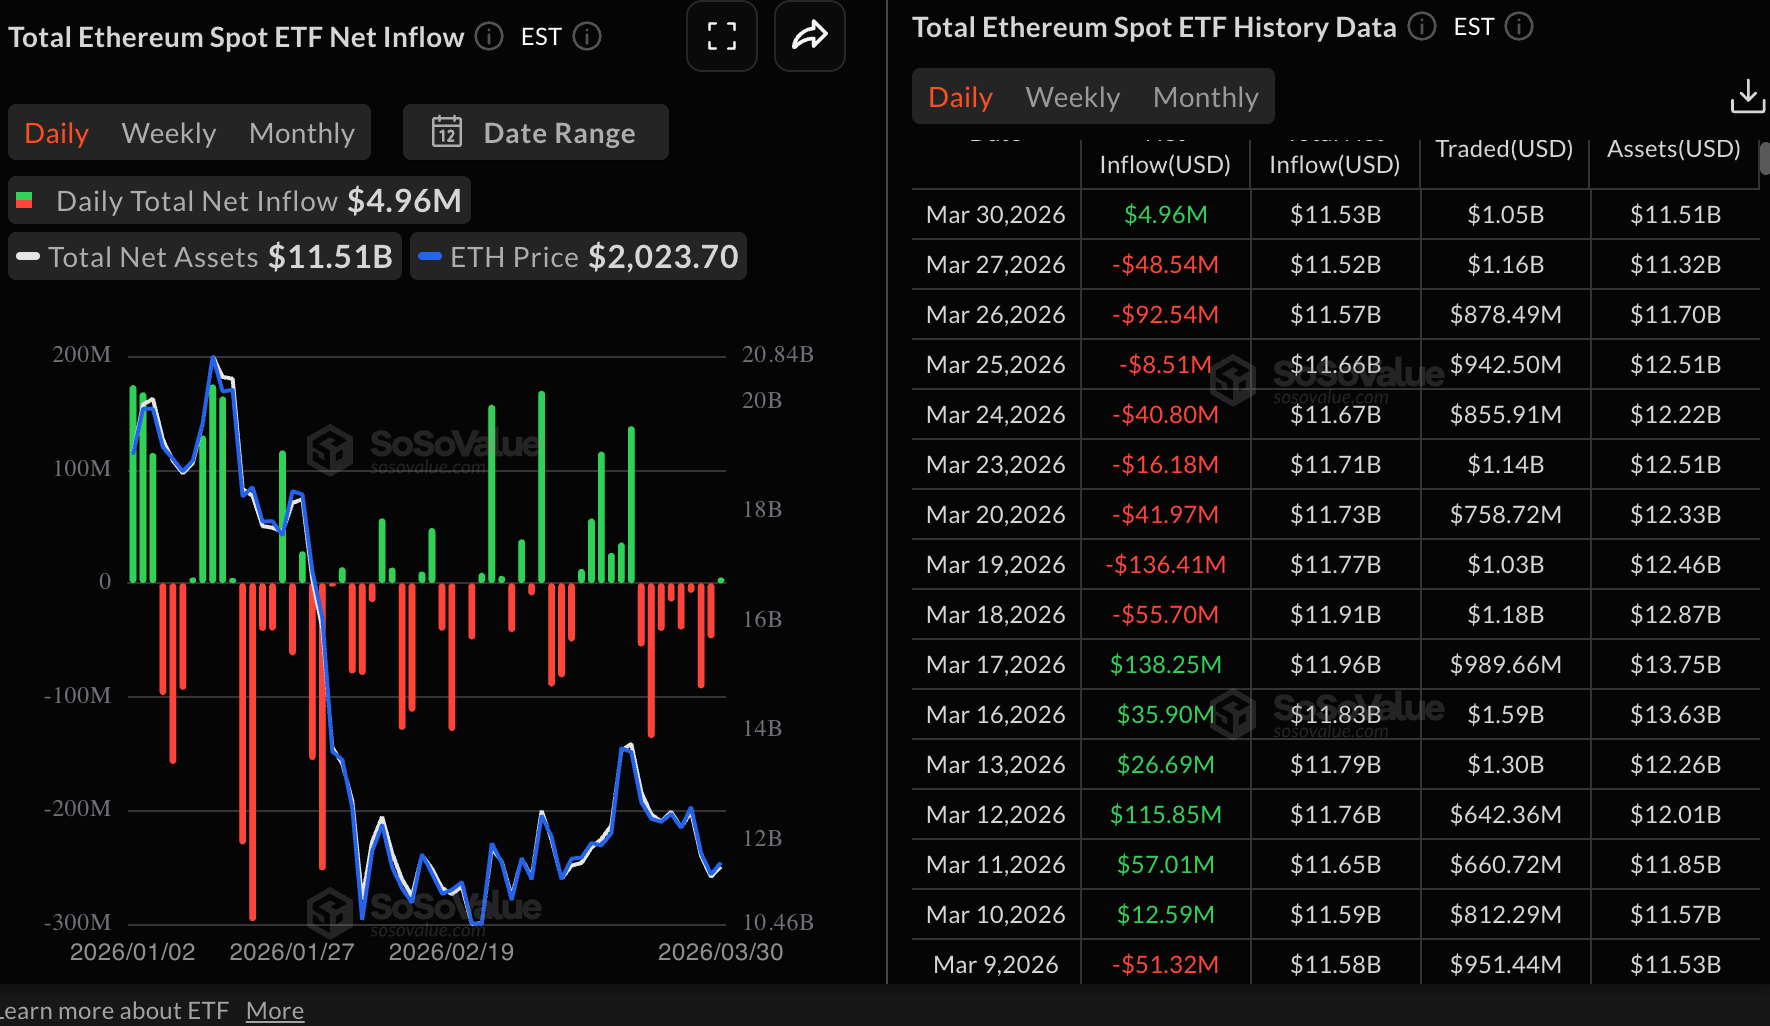
Ethereum similarly recorded inflows, albeit mild, of nearly $5 million on Monday, breaking an eight-day bearish streak of outflows. SoSoValue data shows cumulative inflows totaling $11.53 million, while net assets average $11.51 billion.
As for XRP, interest in spot ETFs remains on the back foot, as the products recorded outflows of slightly over $2 million on Monday. Moreover, activity remained muted on Monday, Thursday and Friday last week, significantly undermining institutional investor interest in the remittance token.
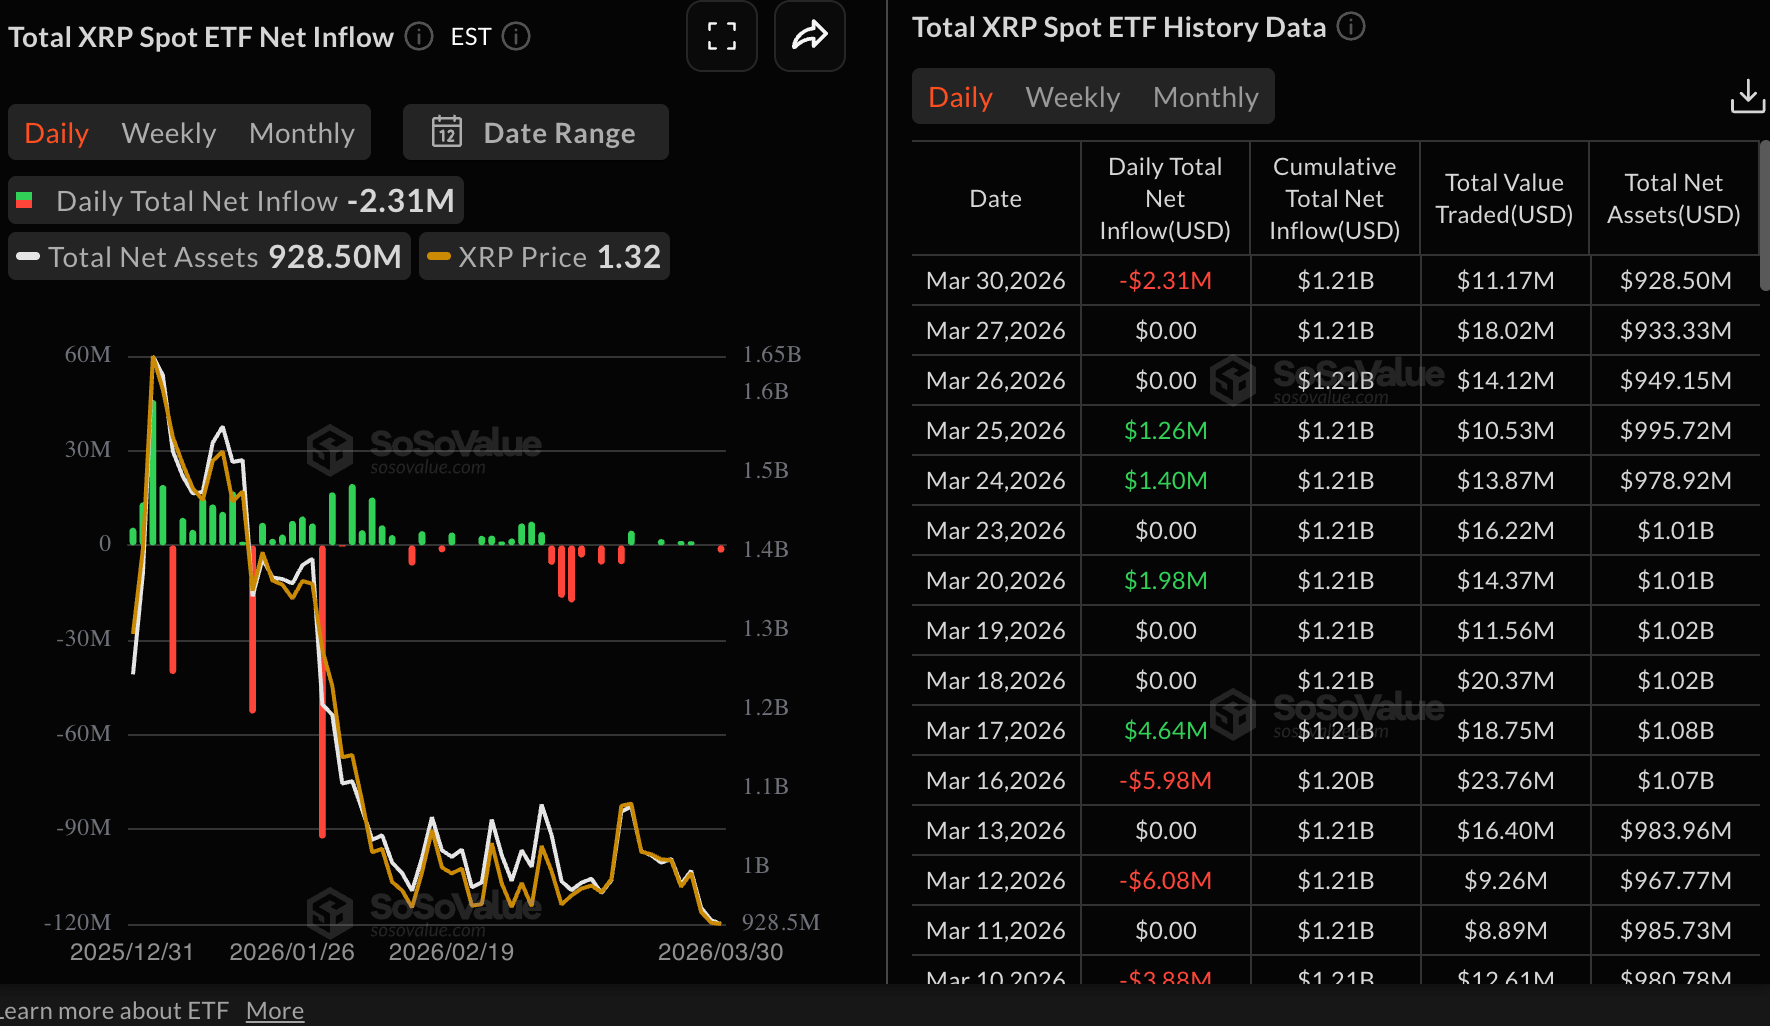
Chart of the day: Bitcoin stable at support, but gains stay constrained
Bitcoin is trading above $67,000, with a mildly bearish near-term bias. The price holds in a descending sequence of lower highs beneath the 50-day, 100-day, and 200-day Exponential Moving Averages (EMAs), which all sit well above spot and cap the upside. The Moving Average Convergence Divergence (MACD) indicator remains below the signal line on the daily chart, with contracting red histogram bars, suggesting fading but still dominant bearish momentum.
Meanwhile, the Relative Strength Index (RSI) near 45 recovers from recent lows yet stays below the 50 midline on the same chart, reinforcing that sellers retain a slight advantage despite the latest stabilization.
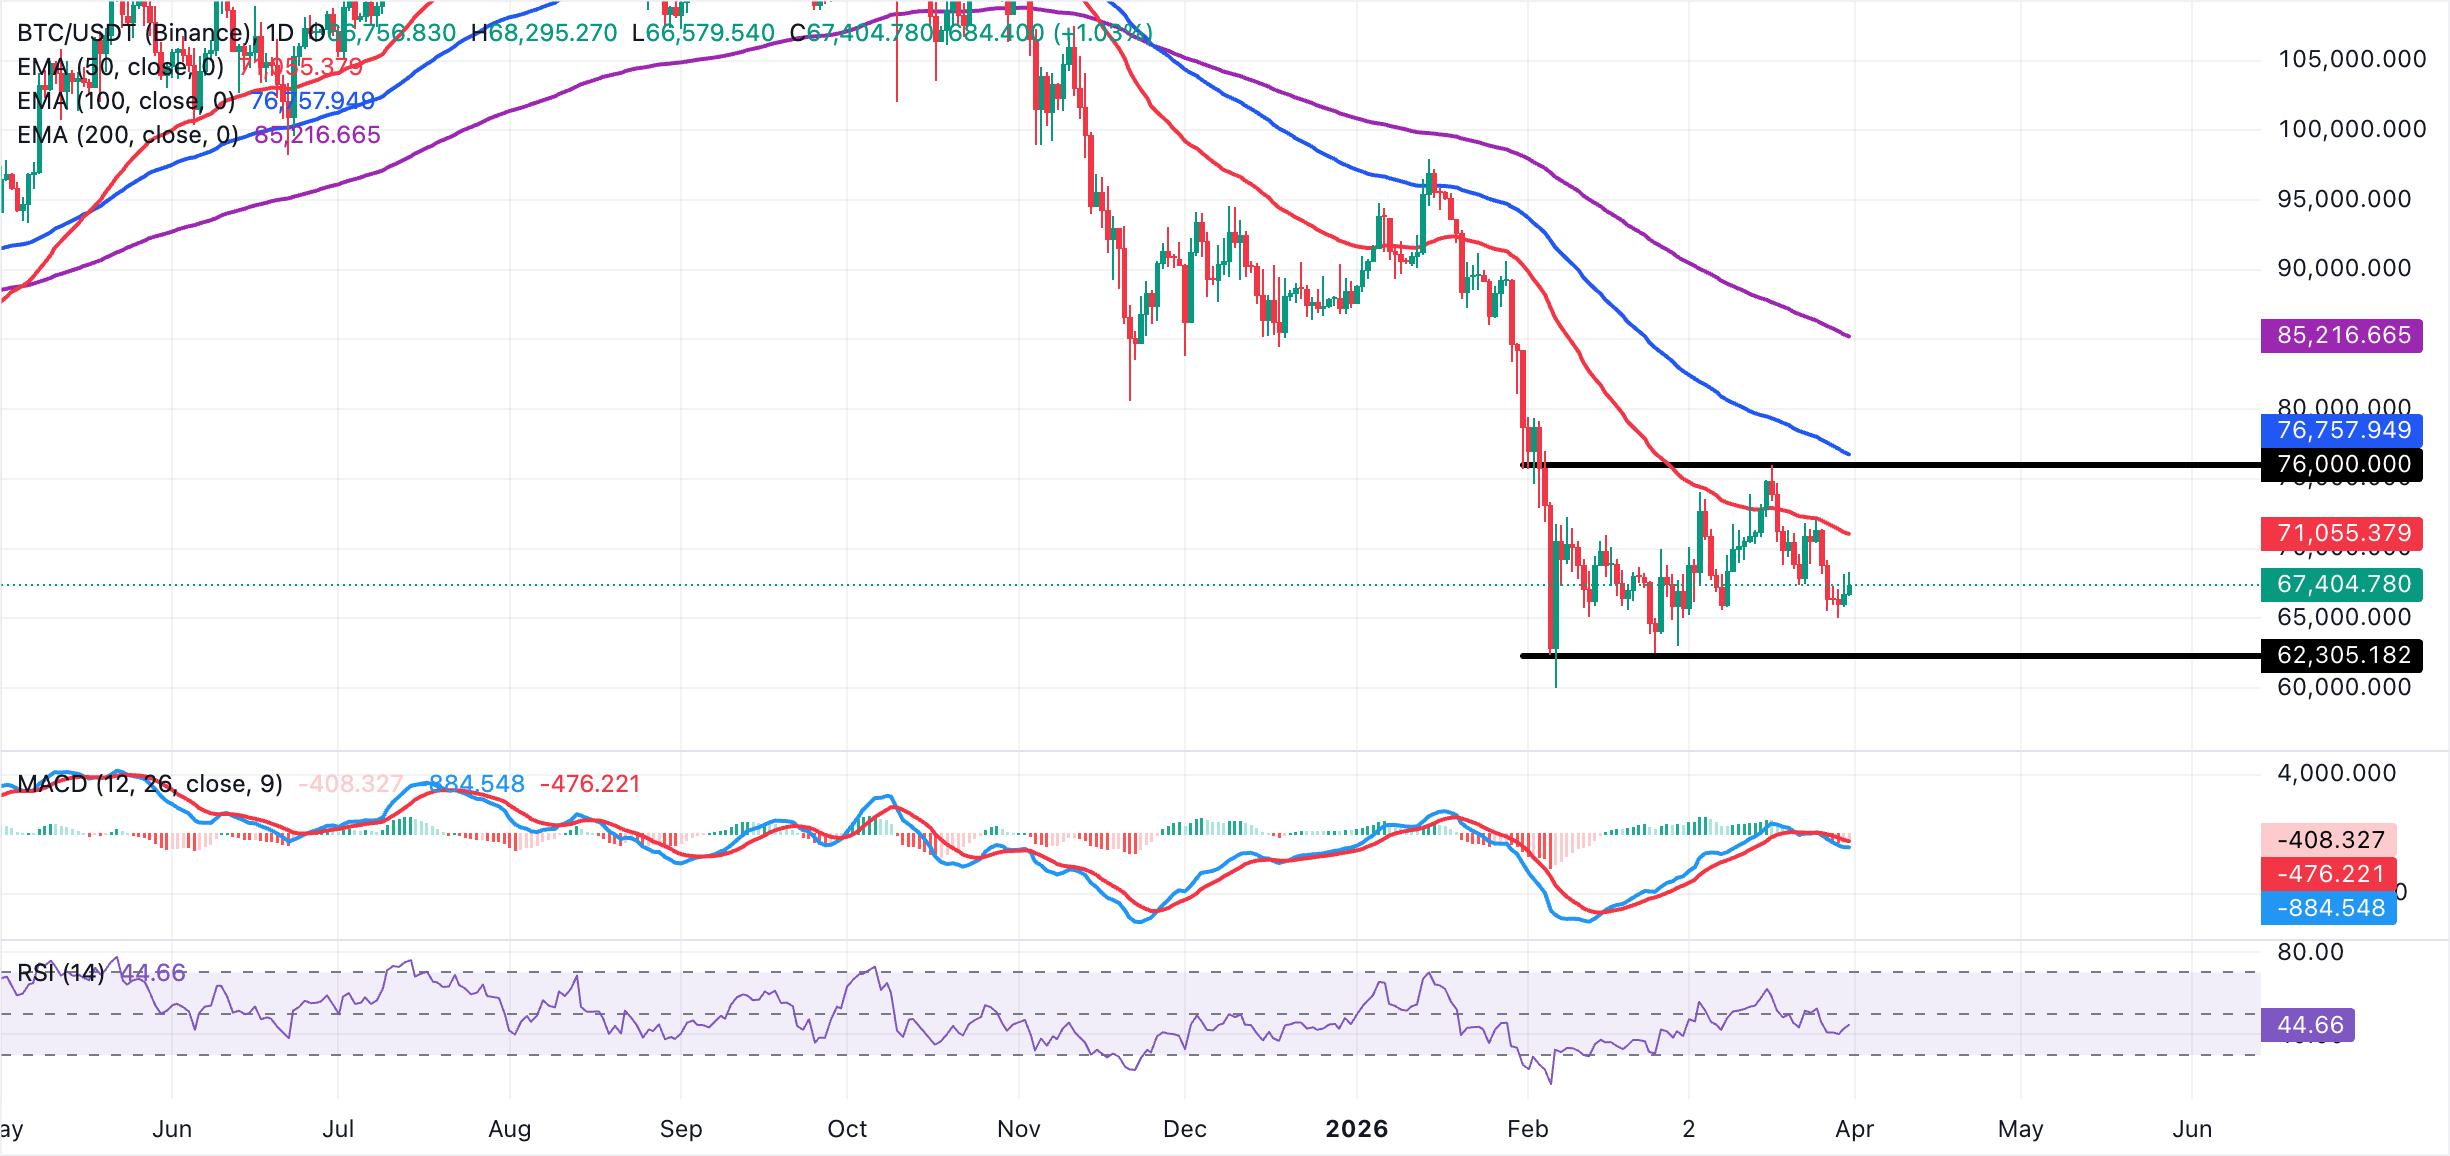
Initial resistance emerges around the recent clustering of closes near $69,000, followed by stronger supply at $71,000, aligning with the 50-day EMA and the March 17 low around $73,400. A sustained break above this area would expose the March high of $76,000.
On the downside, immediate support is at the daily low around $66,348, with a break exposing Monday's low at $65,800, and then last week's trough near $65,000 as the next downside objective.
Altcoins technical outlook: Ethereum stays above support as XRP wobbles
Ethereum is trading at $2,055, with $2,000 functing as immediate support. The smart contract token holds just above an upward-sloping support trend line from around $1,745, keeping the near-term bias mildly bullish despite the price sitting well below the 50-day, 100-day, and 200-day EMAs, which cap the broader upside.
The MACD line has slipped below the signal line on the daily chart. Meanwhile, red histogram bars are contracting, while the RSI on the same chart is near 48 and turning higher toward the 50 midline, suggesting sellers are losing conviction as price stabilises above the trendline base.
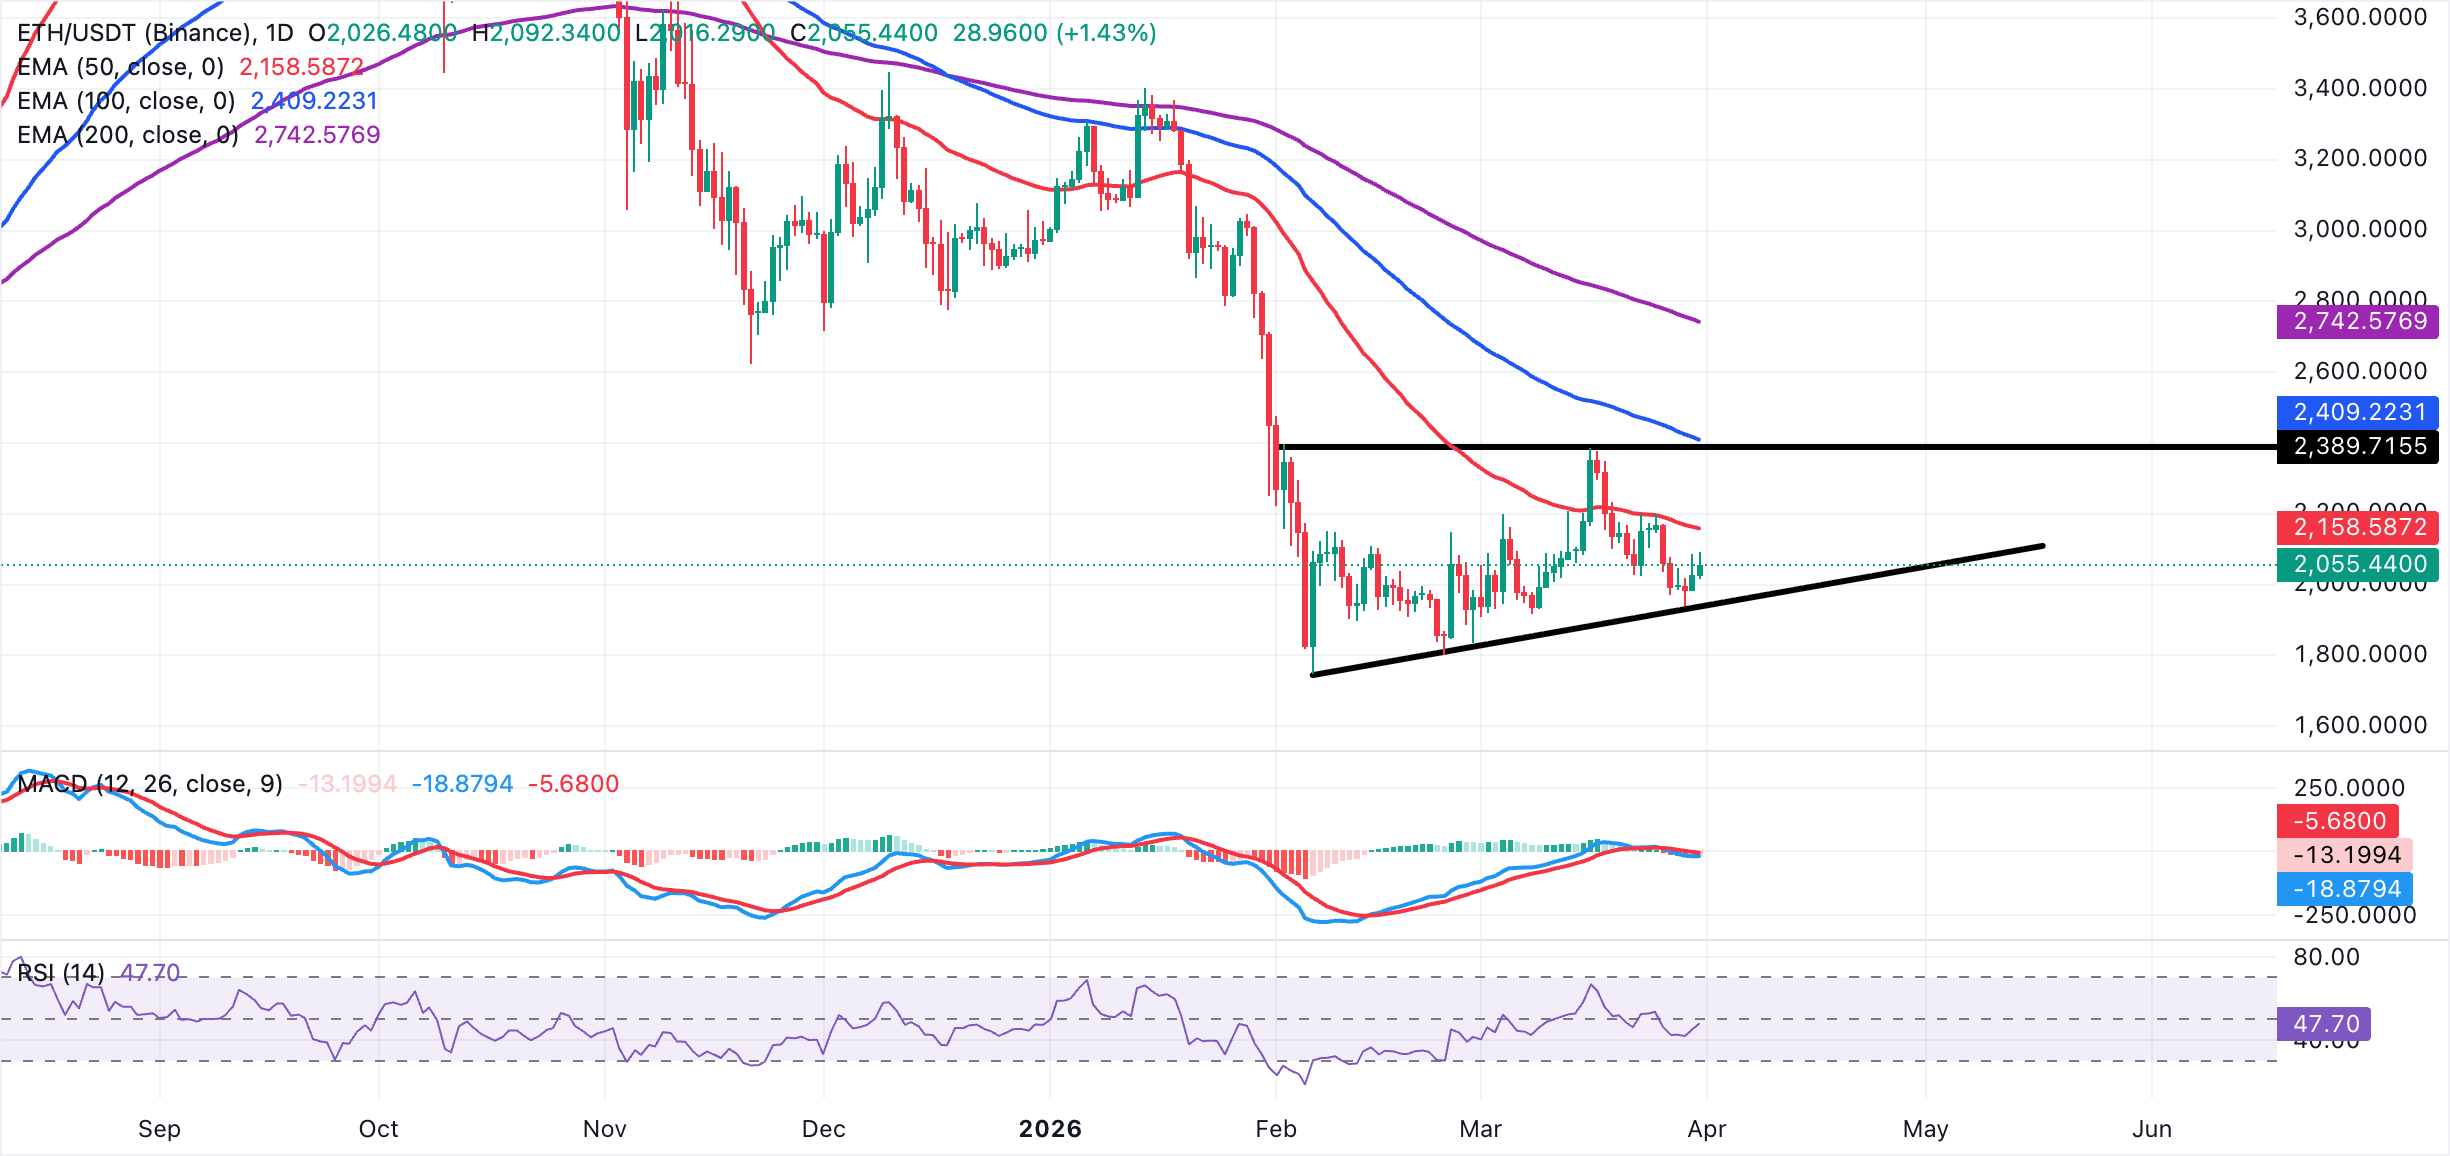
Immediate support is near $2,000, in line with the latest pullback lows and just above the rising trend line, with a break exposing next support around $1,940 and then $1,900. On the topside, initial resistance emerges at $2,100, followed by the 50-day EMA around $2,150 and then the recent swing high near $2,386.
As for XRP, the price is edging lower at $1.32 amid a short-term bearish trend. Daily closes remain well below the clustered 50-day, 100-day, and 200-day EMAs between $1.45 and $1.89, keeping the broader trend under pressure. The MACD indicator slips further below the signal line as the red histogram bars expand on the daily chart, suggesting strengthening bearish momentum. Moreover, RSI is at 38 on the same chart, staying below the 50 midline, reinforcing a downside-tilted tone rather than oversold exhaustion.
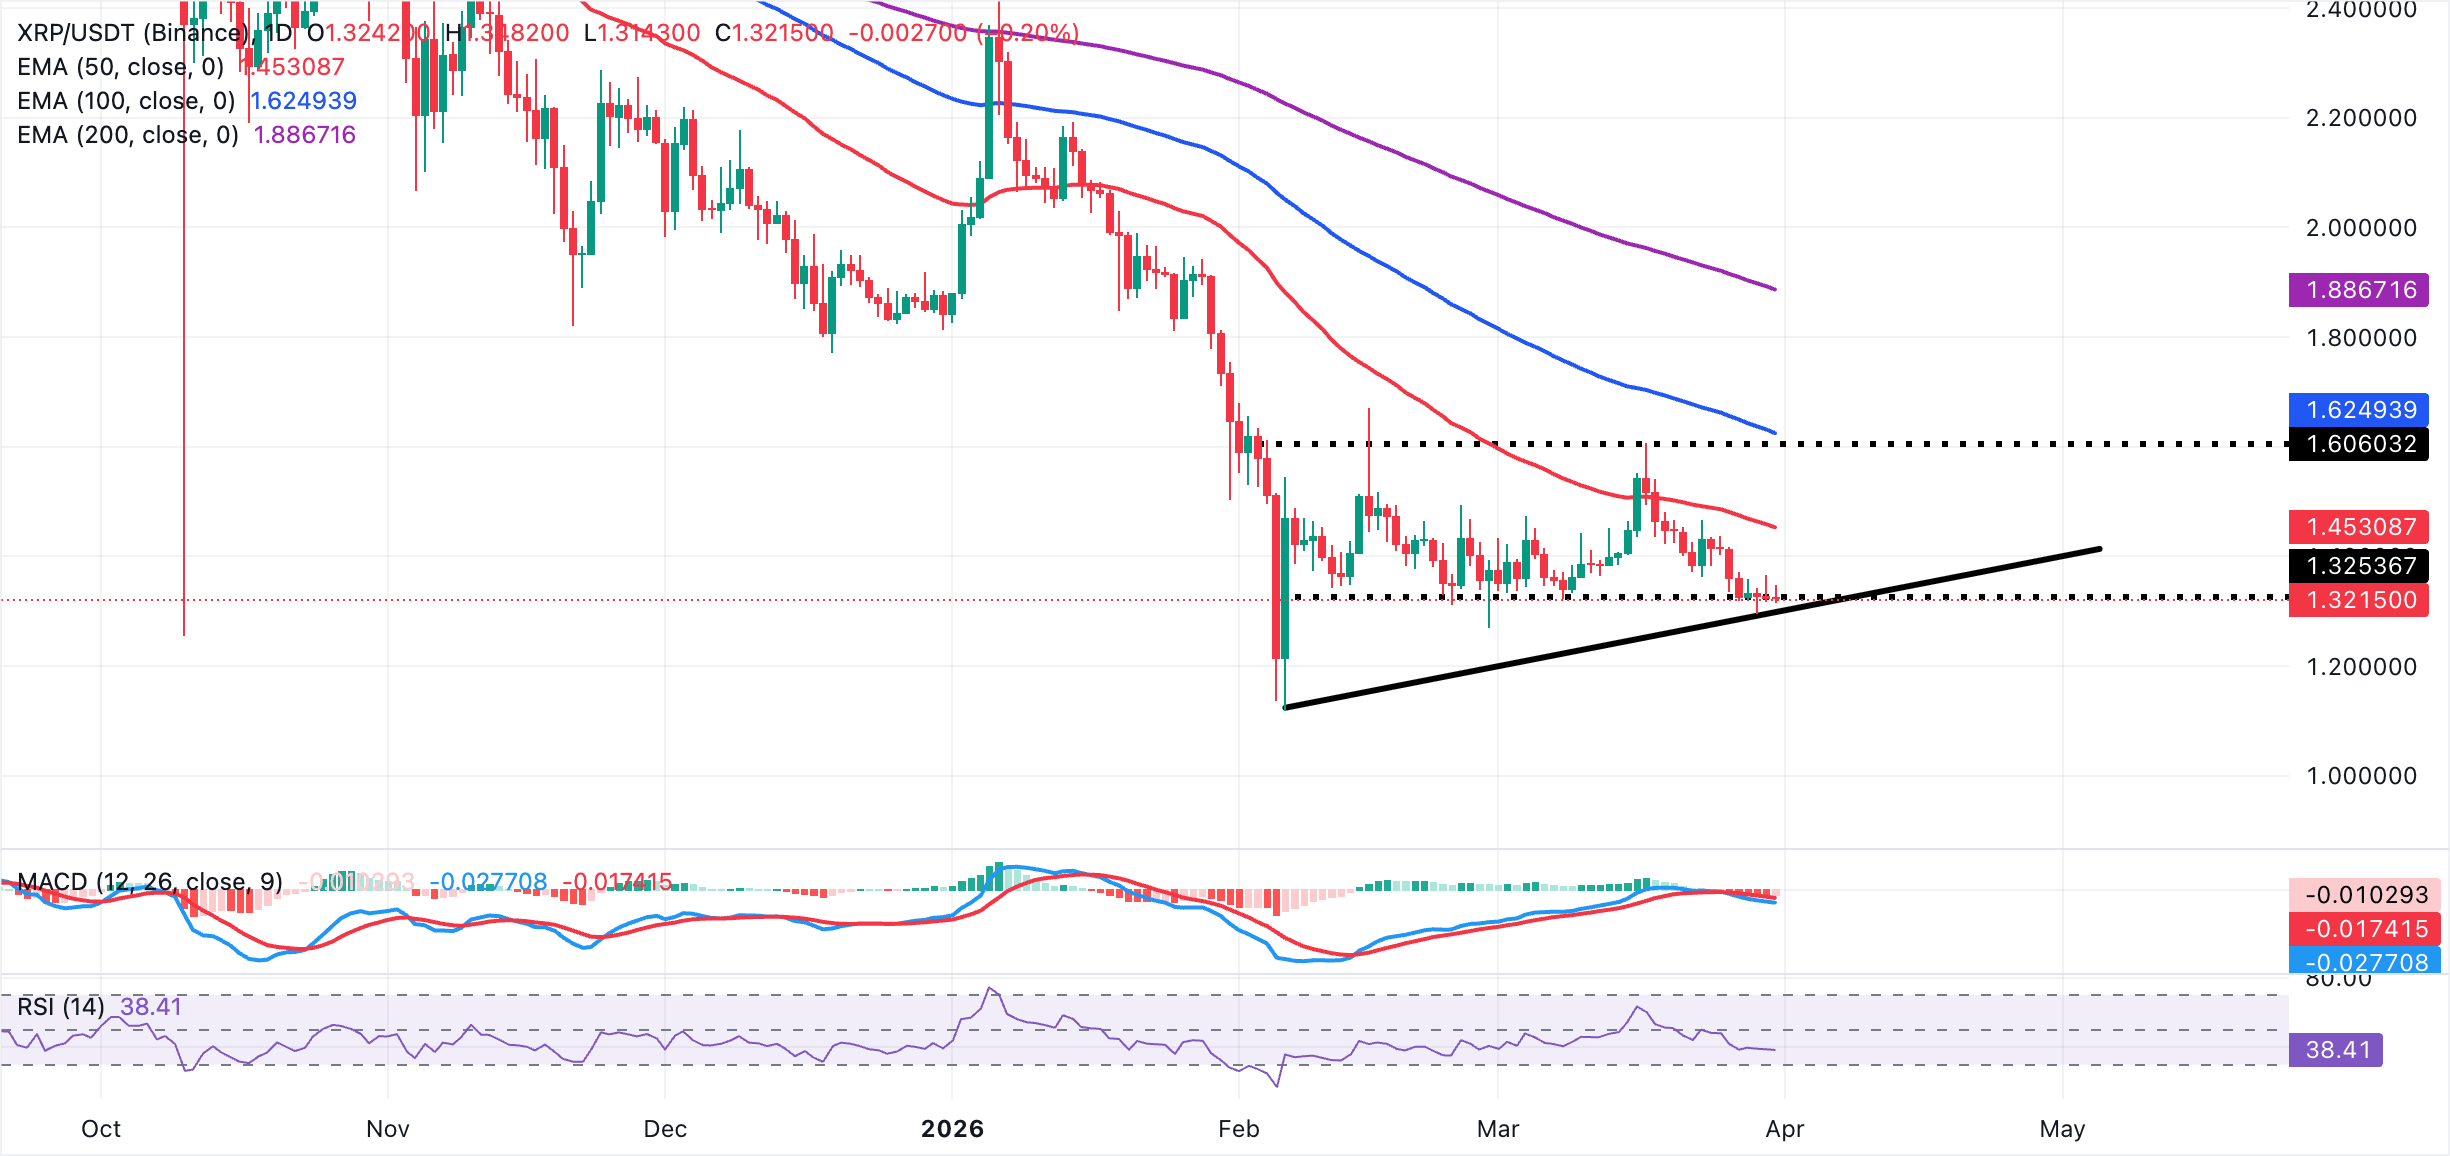
XRP's initial resistance emerges at $1.36, where recent minor rebounds stalled with a stronger cap expected at $1.40 and then $1.45, the latter aligning with the 50-day EMA. On the downside, immediate support is seen at $1.30, where the latest breakdown occurred, and intraday buyers have attempted to stabilize. A clear close below $1.30 would open the way toward $1.25 and then $1.22, exposing the broader corrective leg while momentum remains bearish.
Crypto ETF FAQs
An Exchange-Traded Fund (ETF) is an investment vehicle or an index that tracks the price of an underlying asset. ETFs can not only track a single asset, but a group of assets and sectors. For example, a Bitcoin ETF tracks Bitcoin’s price. ETF is a tool used by investors to gain exposure to a certain asset.
Yes. The first Bitcoin futures ETF in the US was approved by the US Securities & Exchange Commission in October 2021. A total of seven Bitcoin futures ETFs have been approved, with more than 20 still waiting for the regulator’s permission. The SEC says that the cryptocurrency industry is new and subject to manipulation, which is why it has been delaying crypto-related futures ETFs for the last few years.
Yes. The SEC approved in January 2024 the listing and trading of several Bitcoin spot Exchange-Traded Funds, opening the door to institutional capital and mainstream investors to trade the main crypto currency. The decision was hailed by the industry as a game changer.
The main advantage of crypto ETFs is the possibility of gaining exposure to a cryptocurrency without ownership, reducing the risk and cost of holding the asset. Other pros are a lower learning curve and higher security for investors since ETFs take charge of securing the underlying asset holdings. As for the main drawbacks, the main one is that as an investor you can’t have direct ownership of the asset, or, as they say in crypto, “not your keys, not your coins.” Other disadvantages are higher costs associated with holding crypto since ETFs charge fees for active management. Finally, even though investing in ETFs reduces the risk of holding an asset, price swings in the underlying cryptocurrency are likely to be reflected in the investment vehicle too.
(The technical analysis of this story was written with the help of an AI tool.)

100만 명이 넘는 사용자가 FXStreet를 통해 실시간 시장 데이터, 차트 도구, 전문가 인사이트, 포렉스 뉴스를 이용합니다. 포괄적인 경제 캘린더와 교육 웨비나는 트레이더가 정보를 유지하고 신중한 결정을 내리도록 돕습니다. FXStreet는 바르셀로나 본사와 전 세계 지역에 걸쳐 약 60명의 팀으로 구성되어 있습니다.
더 읽기


