
Crypto Today: Bitcoin, Ethereum, XRP edge lower despite Middle East tensions easing
작성자 John Isige
수정됨: 9 Jun 2026


인기 기사

Cryptocurrency prices trade amid persistent selling pressure on Tuesday.
- Bitcoin remains under pressure below $63,000, declining for the second consecutive day as Israel and Iran agree to halt strikes.
- Ethereum hovers below the $1,700 resistance level, in line with the prevailing risk-off sentiment.
- XRP recovery stalls below $1.20, weighed down by a stifled technical structure.
Cryptocurrency prices trade amid persistent selling pressure on Tuesday. Bitcoin (BTC) hovers near $63,000, Ethereum (ETH) above $1,650, and Ripple (XRP) around $1.14, reflecting a subdued appetite for risk assets even as geopolitical tensions in the Middle East appeared to ease after Israel and Iran agreed to halt strikes.
Israel and Iran pause attacks as Trump eyes imminent peace deal
Israel and Iran said on Monday that they had halted military operations, following a heated exchange of fire that tested the fragile ceasefire signed between the United States (US) and Tehran in early April.
However, Iranian military leaders cautioned that any renewed Israeli offensive, particularly in southern Lebanon, could trigger an escalated response.
US President Donald Trump signaled on Tuesday that a new proposal regarding the Iran agreement could be unveiled within days, according to Reuters. Meanwhile, Israeli Prime Minister Benjamin Netanyahu reiterated earlier this week that military operations against Iran and Hezbollah are ongoing, although he emphasized that both adversaries have been significantly weakened.
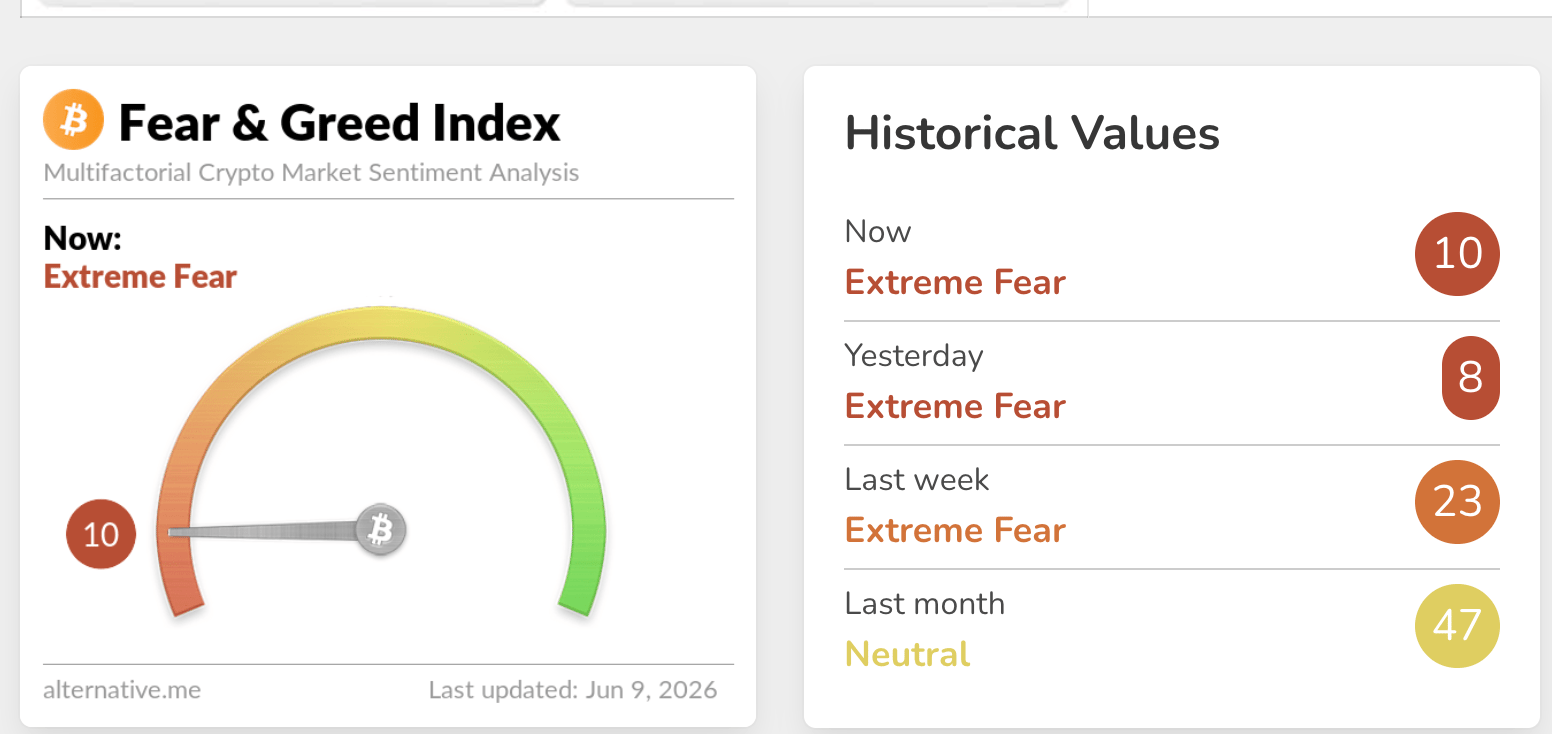
Markets remain alert to potential volatility from further developments, as reflected in the crypto Fear & Greed Index, holding at 10 in the Extreme Fear territory on Tuesday, up from 8 the day before.
A steady increase in the appetite for risk assets is required to sustain the recovery, with Bitcoin eyeing a comeback above $70,000, Ethereum beyond $ 2,000, and XRP above $2.00.
Price analysis: Bitcoin bears tighten grip as recovery stalls
Bitcoin trades at $62,945, extending a decisive bearish phase after breaking below the former rising trendline that now caps the market near $71,830. The pair sits well under the 50-day, 100-day and 200-day Exponential Moving Averages (EMAs), which cluster between roughly $72,500 and $79,500 and reinforce a dominant downside bias.
Momentum remains heavy, with the Relative Strength Index (RSI) hovering around 26 on the daily chart and the Money Flow Index (MFI) around 19, both in oversold territory. At the same time, the Moving Average Convergence Divergence (MACD) histogram holds in negative territory on the same chart, suggesting persistent selling pressure despite the risk of short-term relief bounces.
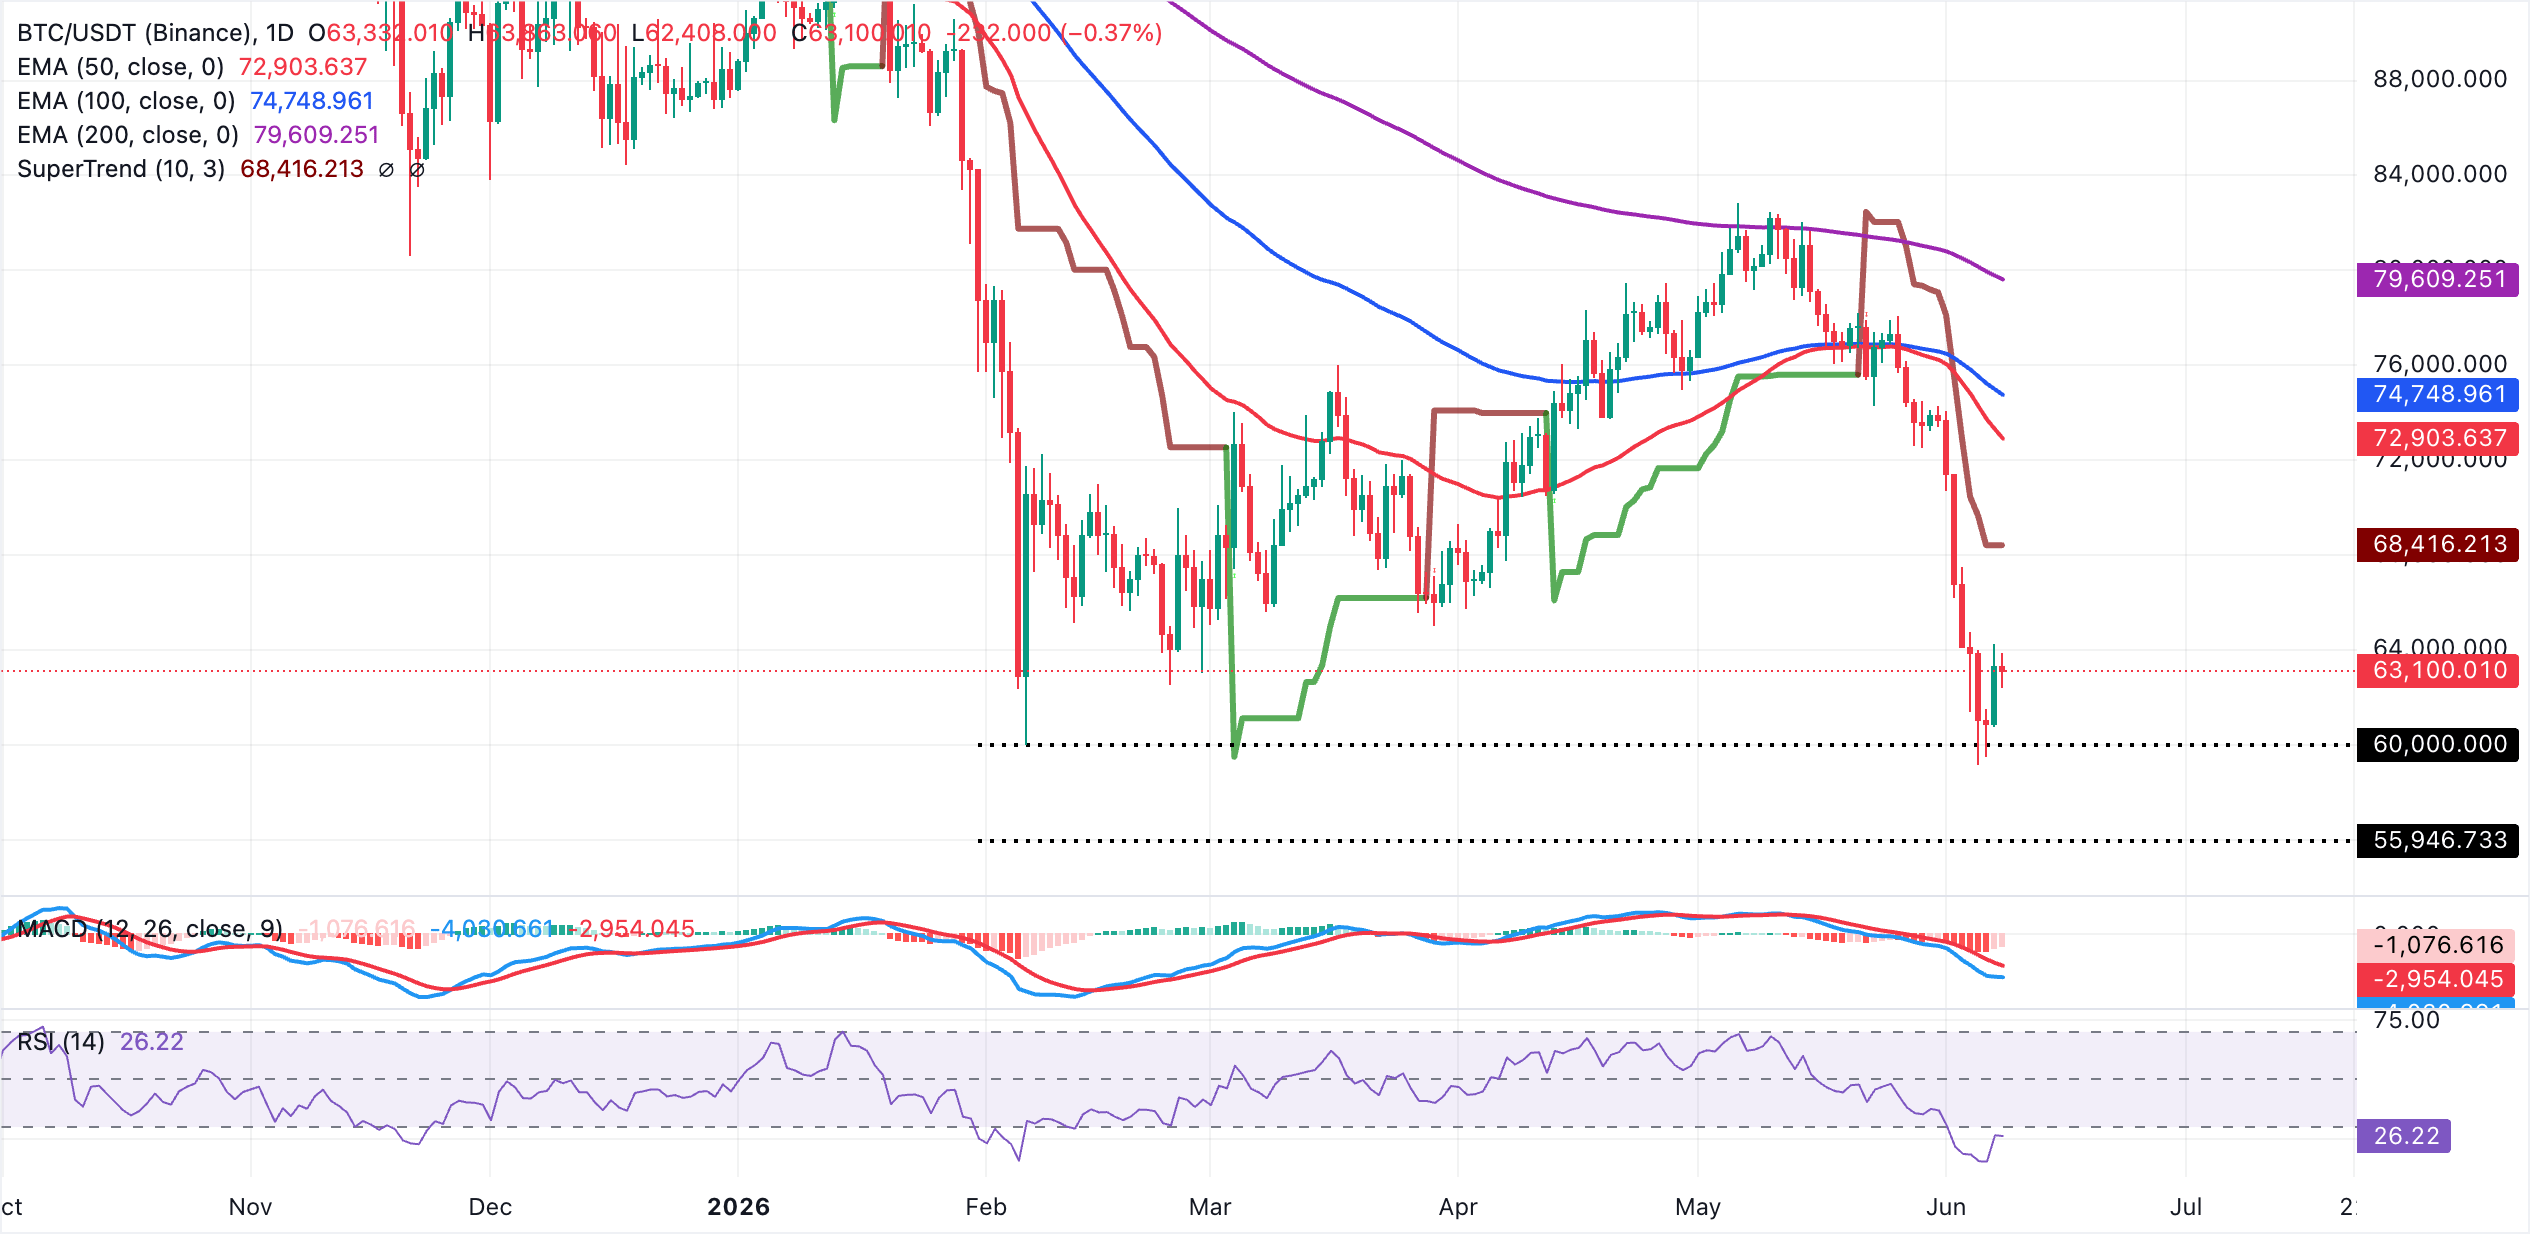
On the topside, initial resistance lies at the broken rising support line around $71,830, where any rebound would likely face its first vital test. A sustained move above that area would then bring the 50-day EMA near $72,513 into view, followed by the 100-day EMA around $74,512 and the more distant 200-day EMA close to $79,498, which collectively define a broader supply zone that would need to be reclaimed to ease the current bearish structure.
Altcoins technical outlook: Ethereum and XRP struggle as headwinds persist
Ethereum trades at $1,676, keeping a clear bearish near-term bias as price holds well below the 50-day, 100-day and 200-day EMAs clustered around $2,058, $2,189 and $2,430 respectively.
Momentum remains weak, with the RSI hovering near oversold territory around 27 on the daily chart, while the MACD histogram stays in negative ground with its line below the signal and a persistently negative histogram, which together suggest that downside pressure is still dominant despite stretched conditions.
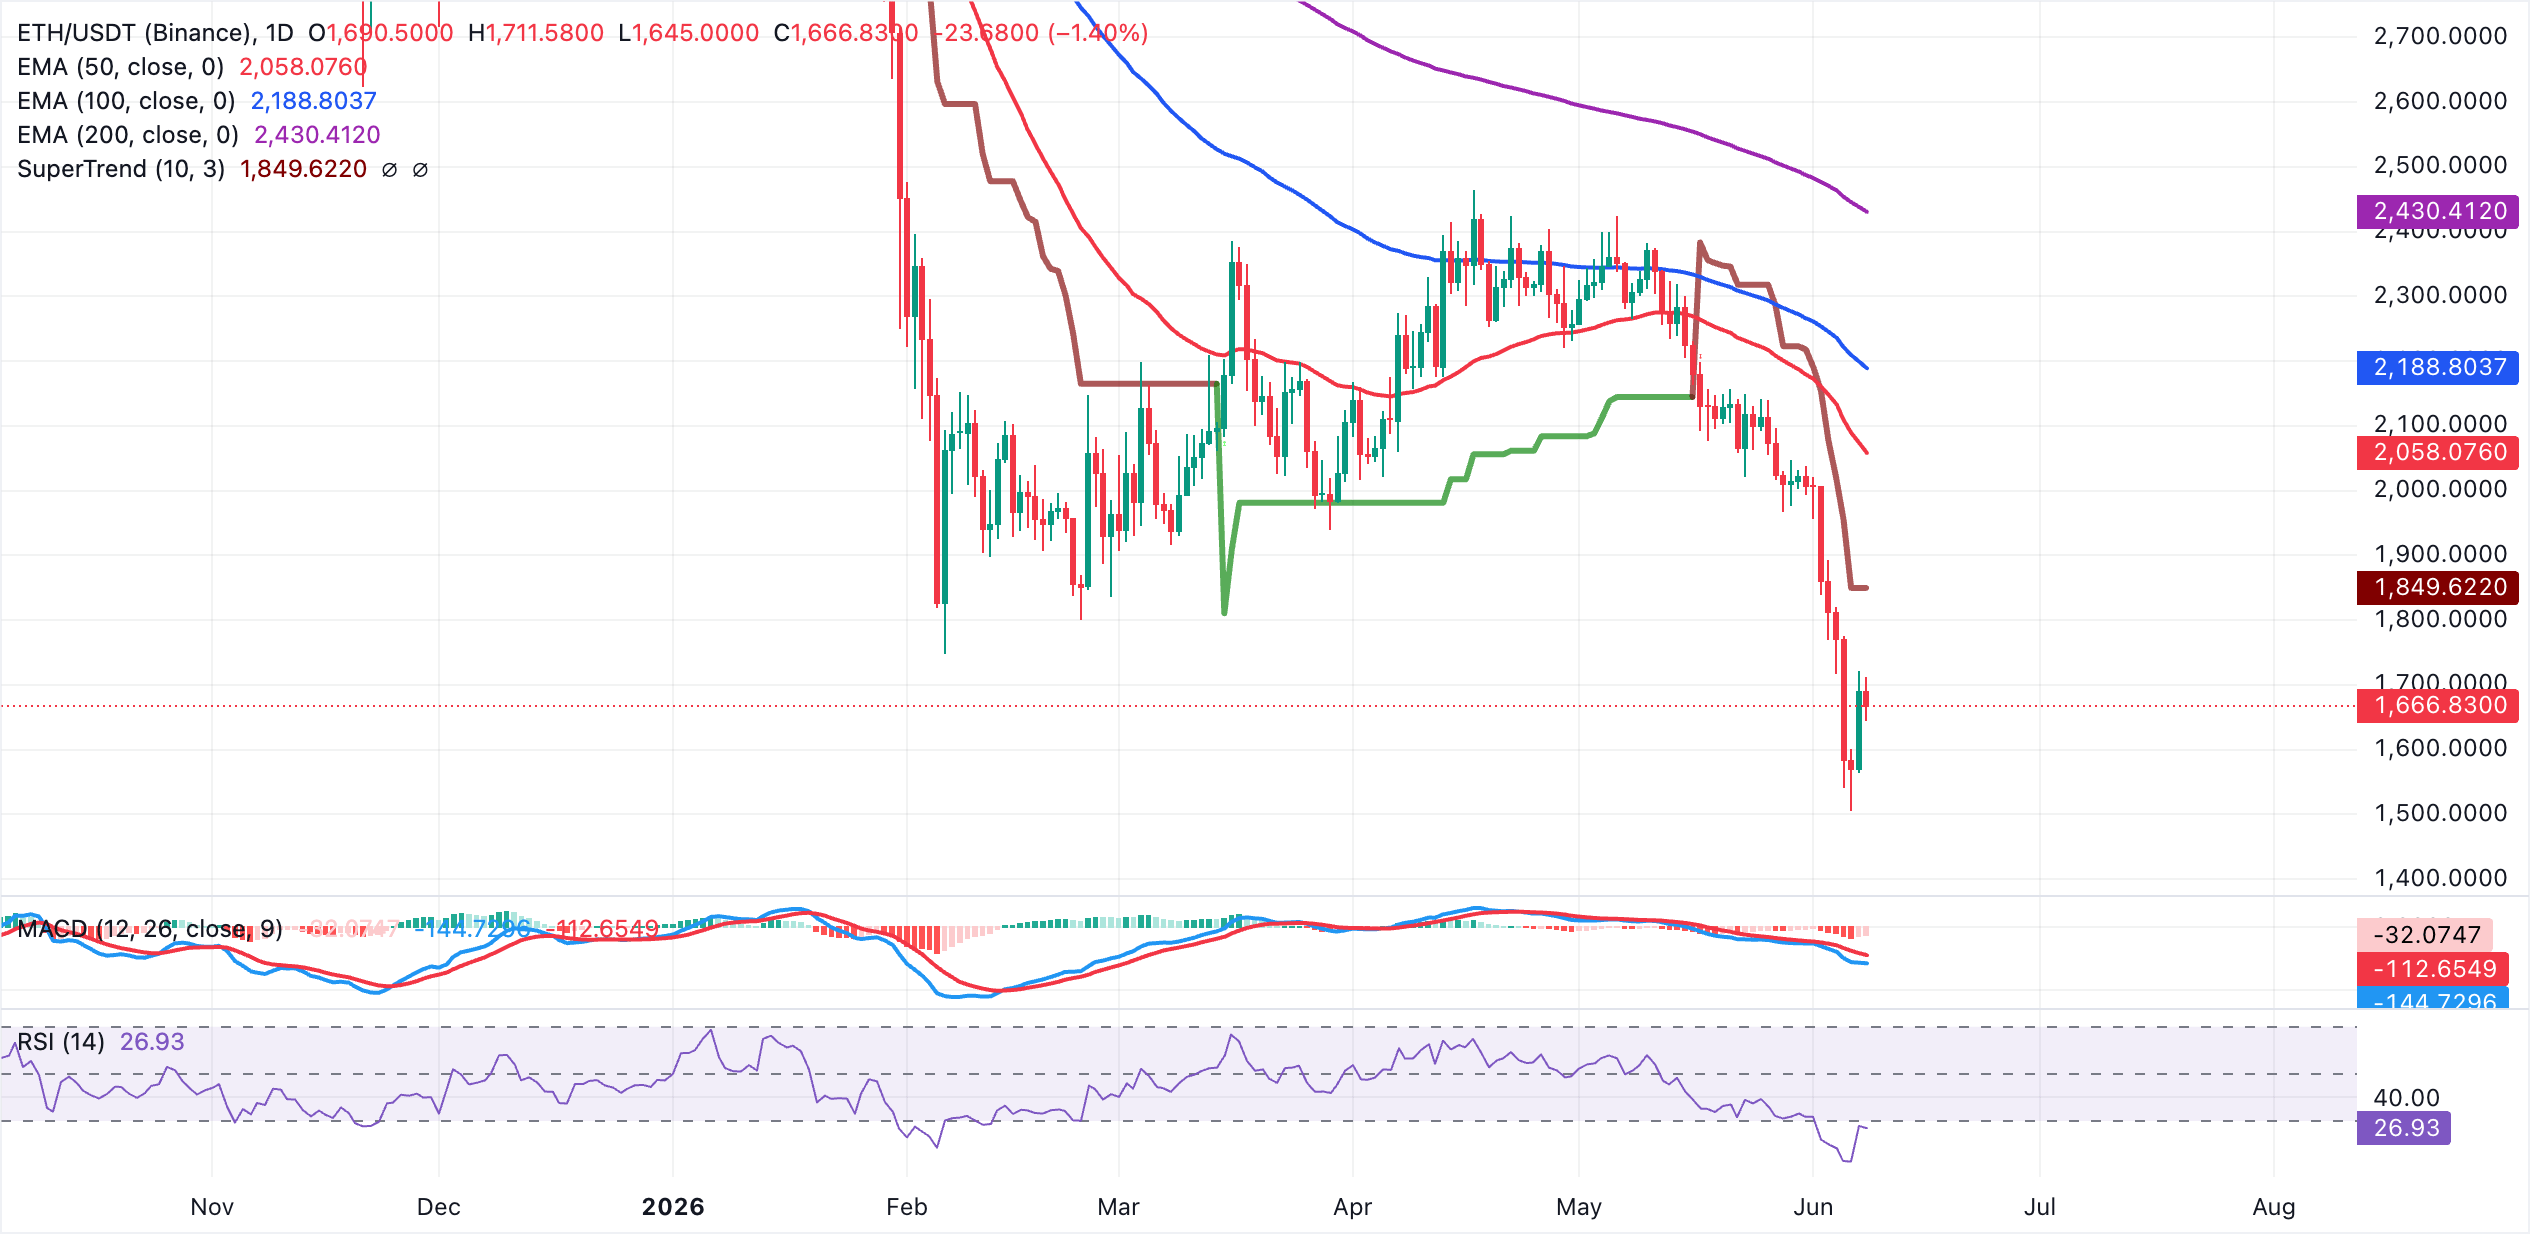
On the topside, initial resistance emerges at the 50-day EMA near $2,058, followed by the 100-day EMA around $2,189 and the longer-term 200-day EMA close to $2,430, which together outline a dense supply zone that would need to be reclaimed to ease the broader bearish tone. On the downside, psychological handles at $1,600 and $1,500 are the next potential areas where dip-buying interest might attempt to stabilize price.
XRP, on the other hand, trades at around $1.16, holding under clear downside pressure. The spot price is well below the 50-day EMA at $1.32, the 100-day EMA at $1.41 and the 200-day EMA at $1.62, which collectively cap the upside and reinforce a bearish near-term bias.
The RSI hovers just above oversold territory near 34 on the daily chart, while the MACD histogram in negative territory, both suggesting that while downside momentum is still dominant, selling pressure could start to lose intensity on further declines.
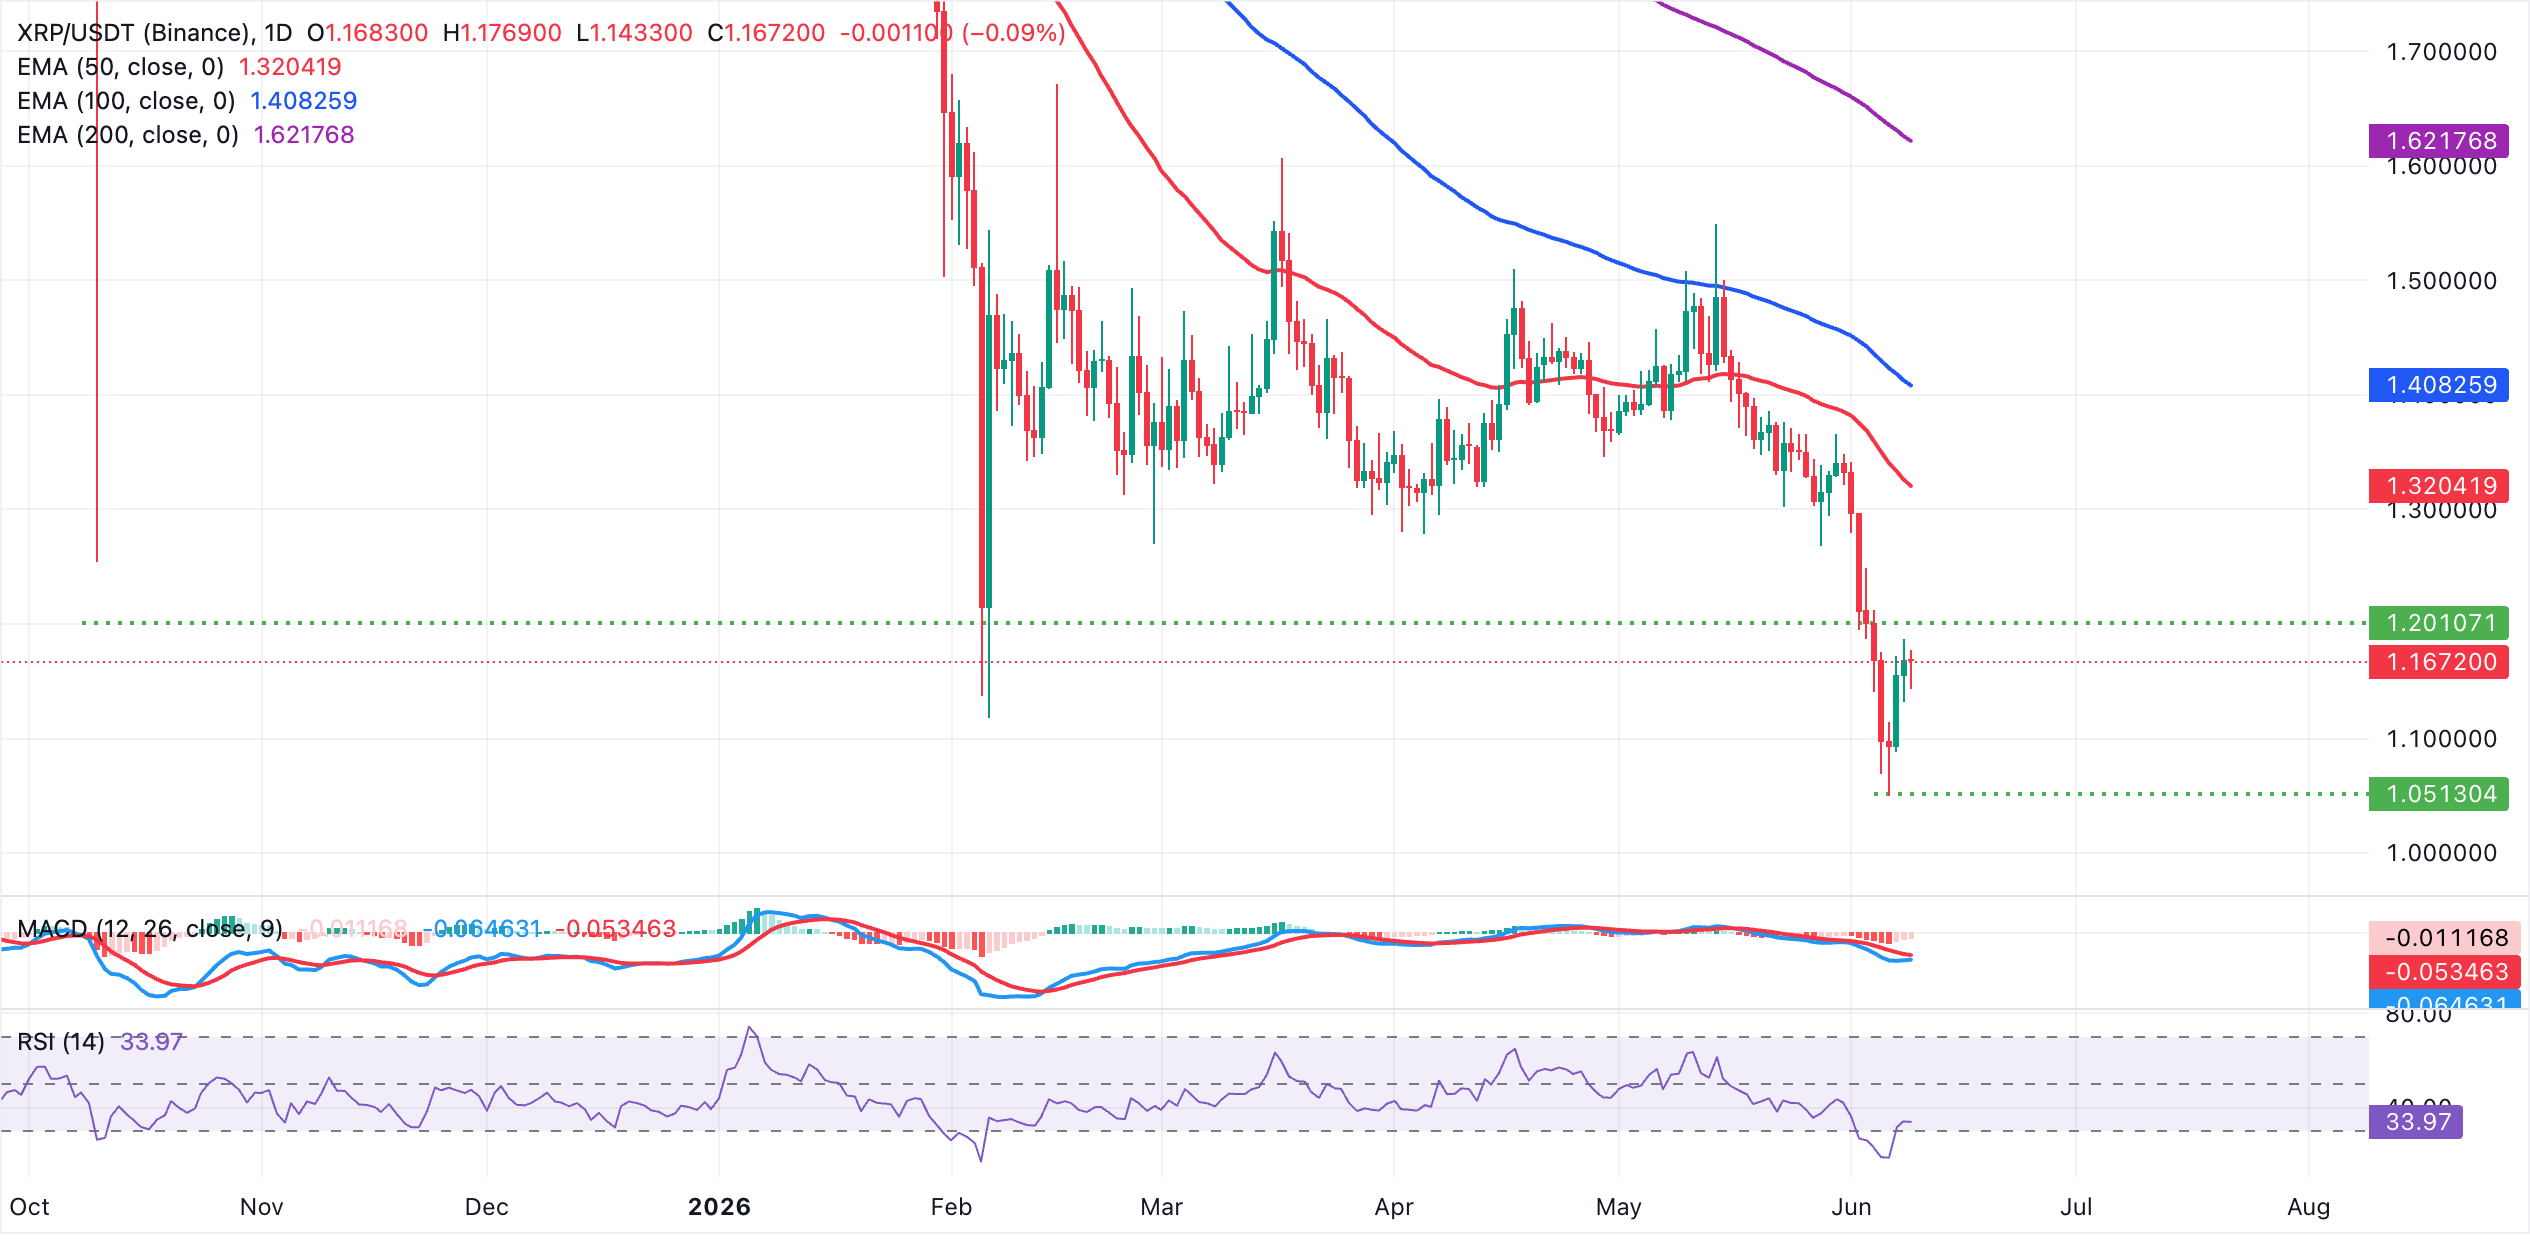
On the topside, initial resistance is aligned with the 50-day EMA at $1.32, with further barriers at the 100-day EMA at $1.41 and the 200-day EMA at $1.62, where any recovery is likely to struggle unless buyers can sustain a break above these moving averages. In the absence of nearby technical support levels on the daily chart, traders may look to prior price lows for potential demand zones at $1.05 and $1.00. Still, as long as XRP trades beneath the clustered EMAs, rallies are likely to be sold into rather than extended.
(The technical analysis of this story was written with the help of an AI tool.)
Open Interest, funding rate FAQs
Higher Open Interest is associated with higher liquidity and new capital inflow to the market. This is considered the equivalent of increase in efficiency and the ongoing trend continues. When Open Interest decreases, it is considered a sign of liquidation in the market, investors are leaving and the overall demand for an asset is on a decline, fueling a bearish sentiment among investors.
Funding fees bridge the difference between spot prices and prices of futures contracts of an asset by increasing liquidation risks faced by traders. A consistently high and positive funding rate implies there is a bullish sentiment among market participants and there is an expectation of a price hike. A consistently negative funding rate for an asset implies a bearish sentiment, indicating that traders expect the cryptocurrency’s price to fall and a bearish trend reversal is likely to occur.

100만 명이 넘는 사용자가 FXStreet를 통해 실시간 시장 데이터, 차트 도구, 전문가 인사이트, 포렉스 뉴스를 이용합니다. 포괄적인 경제 캘린더와 교육 웨비나는 트레이더가 정보를 유지하고 신중한 결정을 내리도록 돕습니다. FXStreet는 바르셀로나 본사와 전 세계 지역에 걸쳐 약 60명의 팀으로 구성되어 있습니다.
더 읽기


