
Crypto Today: Bitcoin, Ethereum, XRP lag recovery as Israel and Iran attack each other
작성자 John Isige
수정됨: 8 Jun 2026


인기 기사

Cryptocurrency prices remain under pressure on Monday as market participants navigate tensions in the Middle East after Israel and Iran attacked each other for the first time since the peace deal agreement that was reached in Early April.
- Bitcoin remains pressured around $63,000 as Israel and Iran exchange fire for the first time since the early April ceasefire agreement.
- Ethereum corrects after a rejection at $1,700, as broader risk-off sentiment and capital outflows, reinforce the pullback.
- XRP hovers around $1.14, pressured by a weakening technical structure and continuing mild ETF inflows.
Cryptocurrency prices remain under pressure on Monday as market participants navigate tensions in the Middle East after Israel and Iran attacked each other for the first time since the peace deal agreement that was reached in Early April. Bitcoin (BTC) hovers around $63,000 as headwinds intensify, while altcoins, including Ethereum (ETH) and Ripple (XRP), are in a tight bearish grip.
Geopolitical risks mount as Israel and Iran exchange strikes
Risk-off sentiment continues to dominate, with most digital assets correcting after a brief weekend bounce. Israel and Iran exchanged strikes for the first time since the ceasefire agreement was reached on April 8.
Iran launched missiles at Israel on Sunday in retaliation for an Israeli attack in Lebanon. Israeli military reported that it intercepted the missiles and launched a retaliatory attack, striking military targets in western and central Iran.
Iran’s Islamic Revolutionary Guard Corps (IRGC) announced that it launched strikes against Israeli air bases Nevatim and Tel Nof in response to attacks on radar sites within Iran, adding that they are "ready for any scenario and for widespread operations on all fronts.
Meanwhile, United States (US) President Donald Trump told the Financial Times that the strikes between Israel and Iran do not change his desire to bring the ongoing peace negotiations to a conclusion. Trump said that Israel’s Prime Minister Benjamin Netanyahu will have no choice but to accept a peace agreement with Iran.
Crypto prices are struggling to hold steady, with some assets correcting from the slight rebound over the weekend. Besides geopolitical tensions, the headwinds stem from persistent capital outflows, as reflected in spot Exchange-Traded Funds (ETFs).
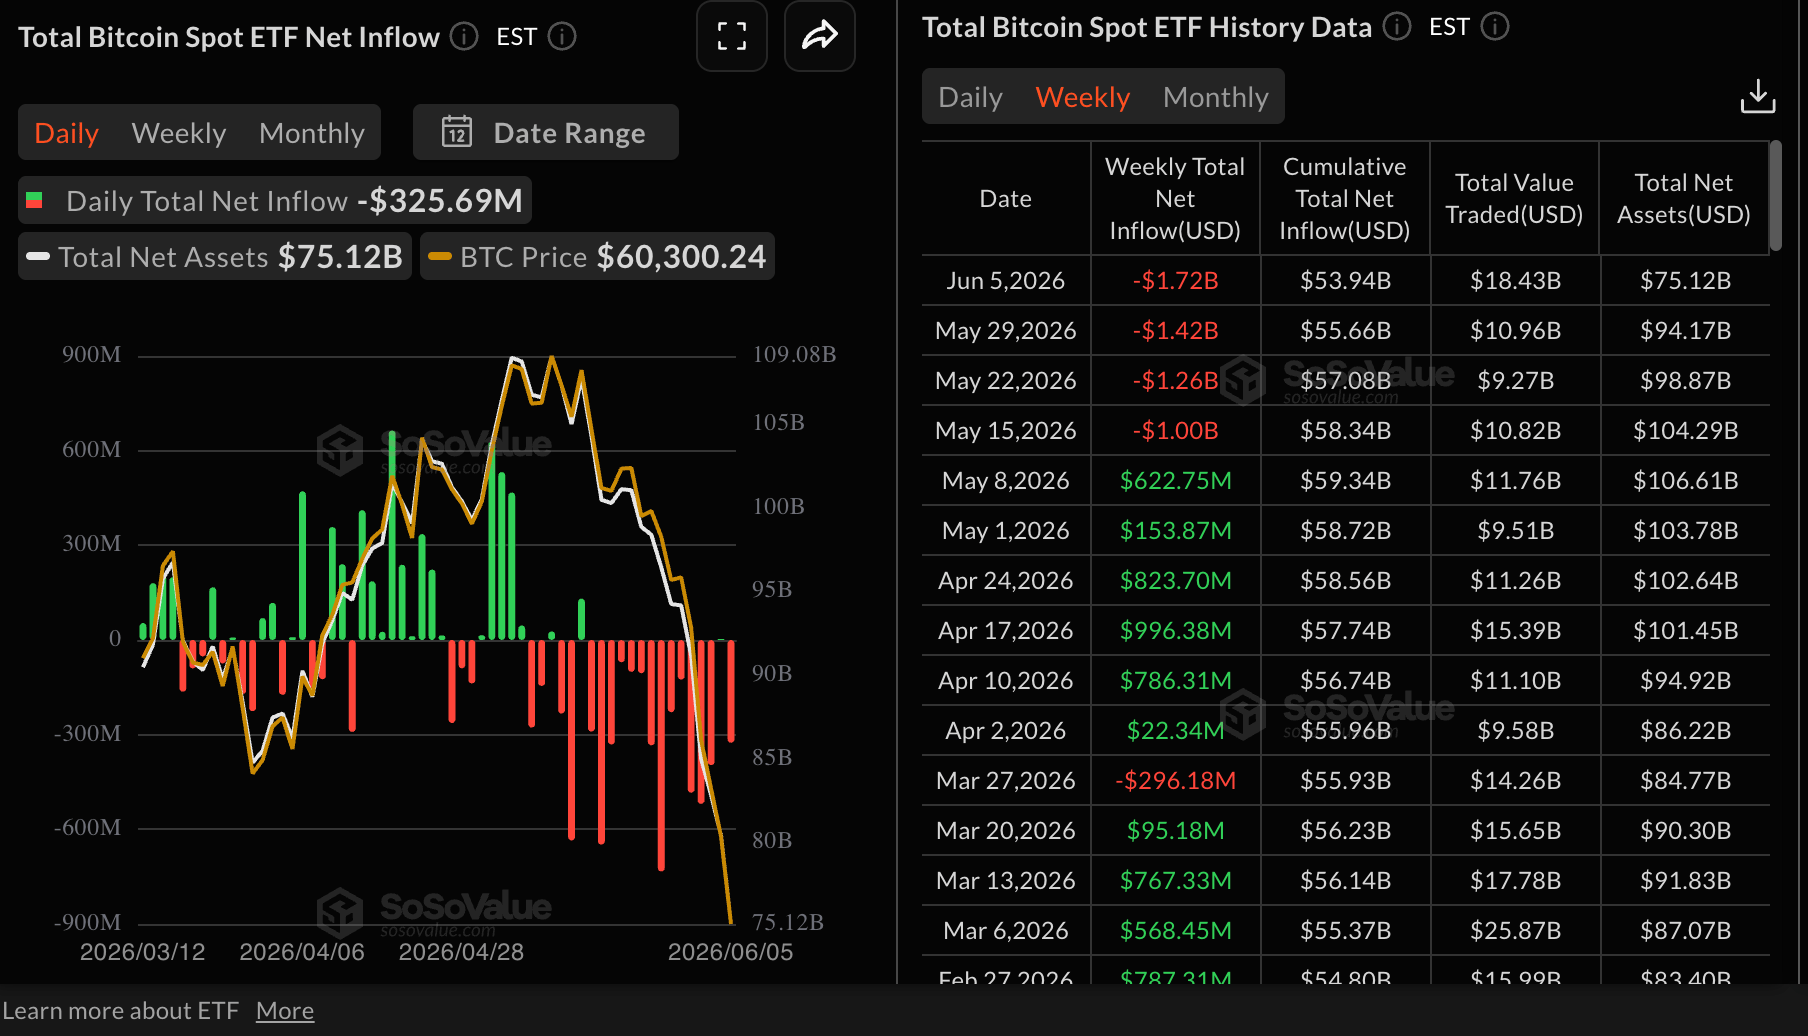
Institutional appetite remained on the back seat last week, with SoSoValue weekly data showing that spot Bitcoin ETFs recorded outflows of $1.72 billion through Friday. Unless we see a positive turnaround this week, a sustained recovery could remain a pipe dream.
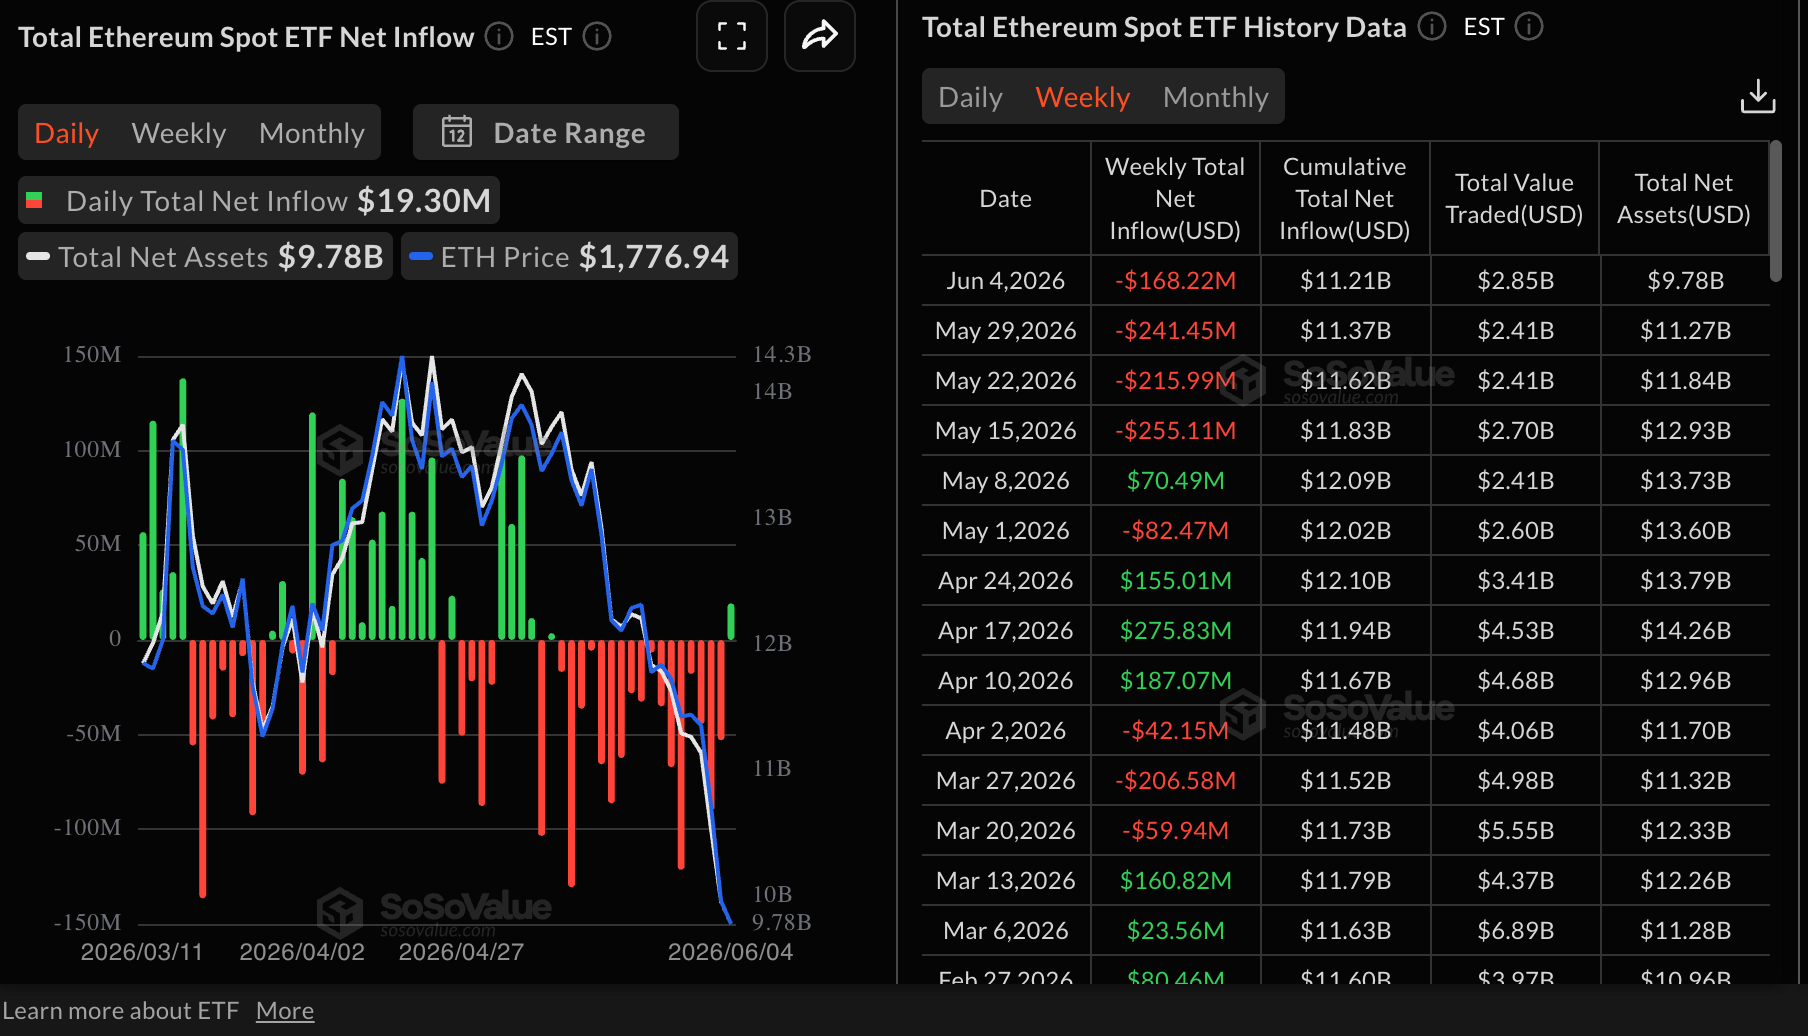
Ethereum spot ETFs extended the bearish streak for the fourth consecutive week, with $168 million in outflows recorded through Friday. Cumulative inflows narrowed slightly to $11.21 billion from $11.37 billion the previous week. Total assets under management declined to $9.78 billion from $11.27 billion in the same period, reinforcing the persistent risk-off sentiment.
Meanwhile, XRP spot ETFs extended their mild bullish streak, with inflows of $2.62 million last week through Friday. This marked the fifth consecutive week of inflows, bringing cumulative inflows to $1.43 billion and net assets to $928 million, according to SoSoValue.
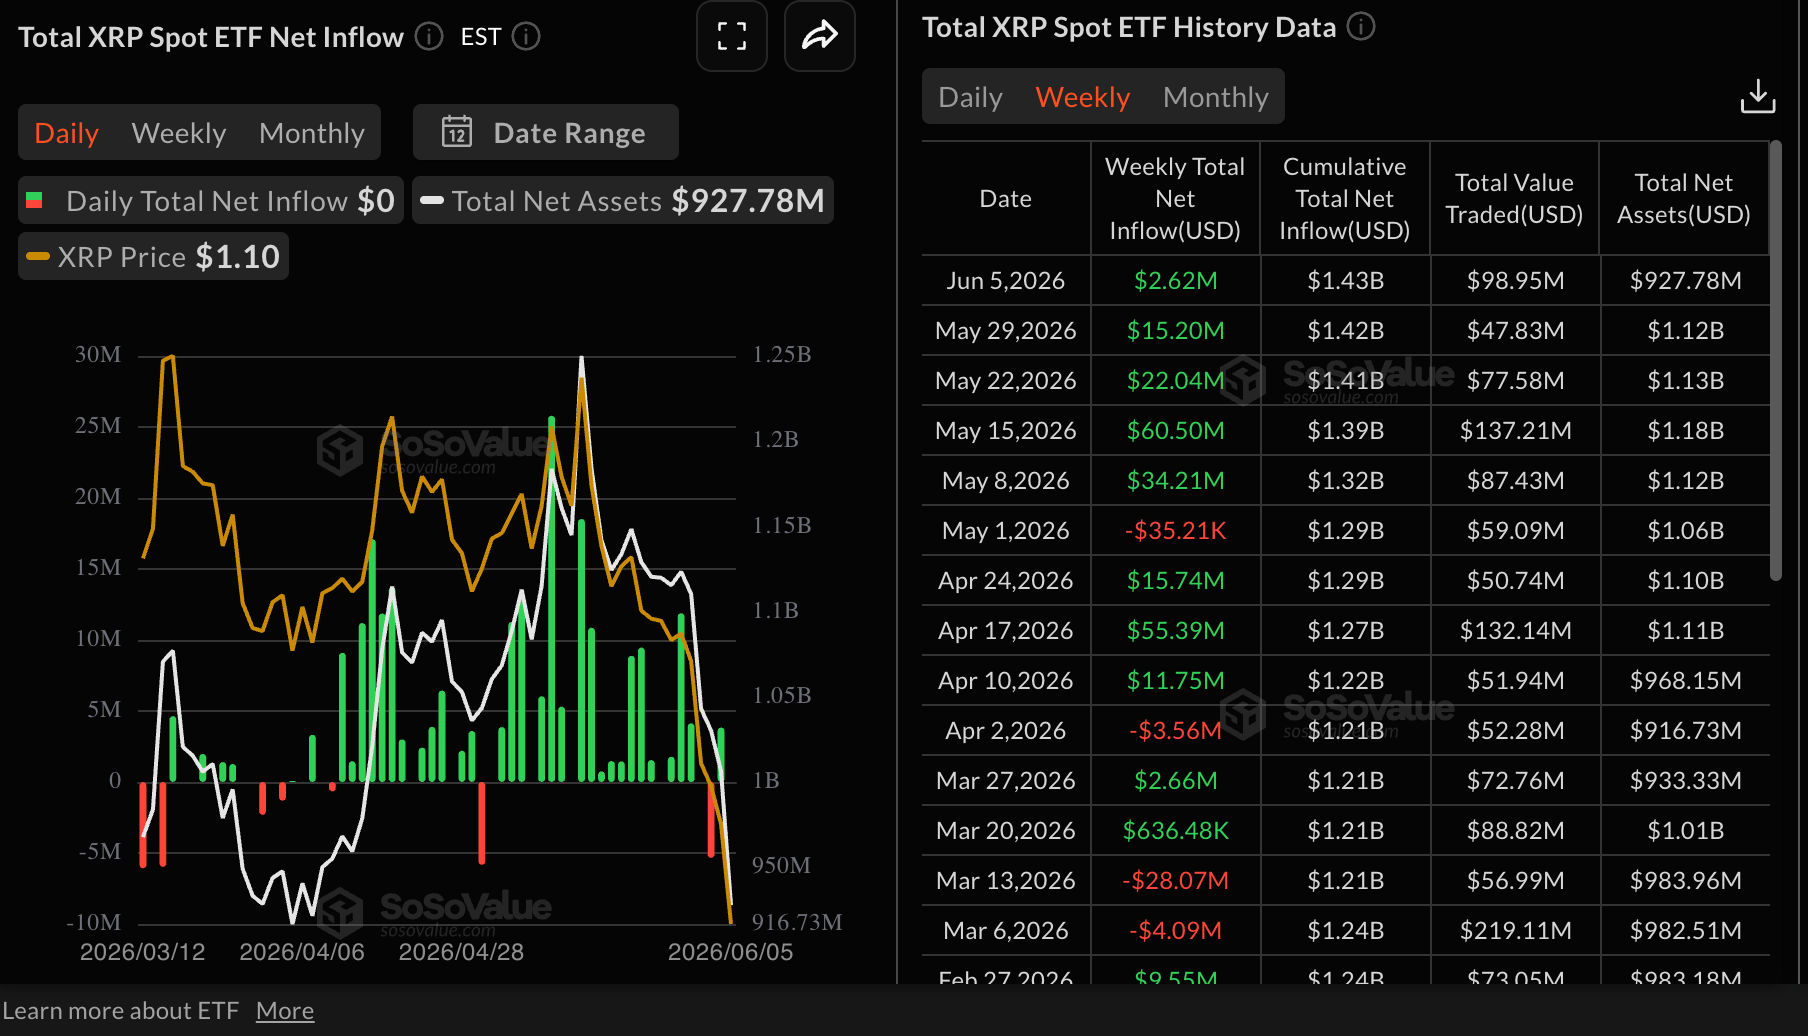
Despite mild capital inflows, sentiment around XRP remained grim, with the price dropping to $1.05 on Saturday before rising to trade around $1.14 at the time of writing on Monday.
Price analysis: Bitcoin trades under pressure
Bitcoin trades at $63,100, keeping a bearish near-term bias as price sits well below the 50-day, 100-day and 200-day Exponential Moving Averages (EMAs). The closest structural cap is the SuperTrend line near $68,416, with additional overhead pressure reinforced by the 50-day EMA around $72,903, the 100-day EMA near $74,749 and the 200-day EMA up at about $79,609.
Momentum remains weak, as the Relative Strength Index (RSI) hovers in oversold territory near 26 on the daily chart, while the Moving Average Convergence Divergence (MACD) histogram stays negative and depressed, suggesting ongoing downside pressure despite the risk of intermittent bounces.
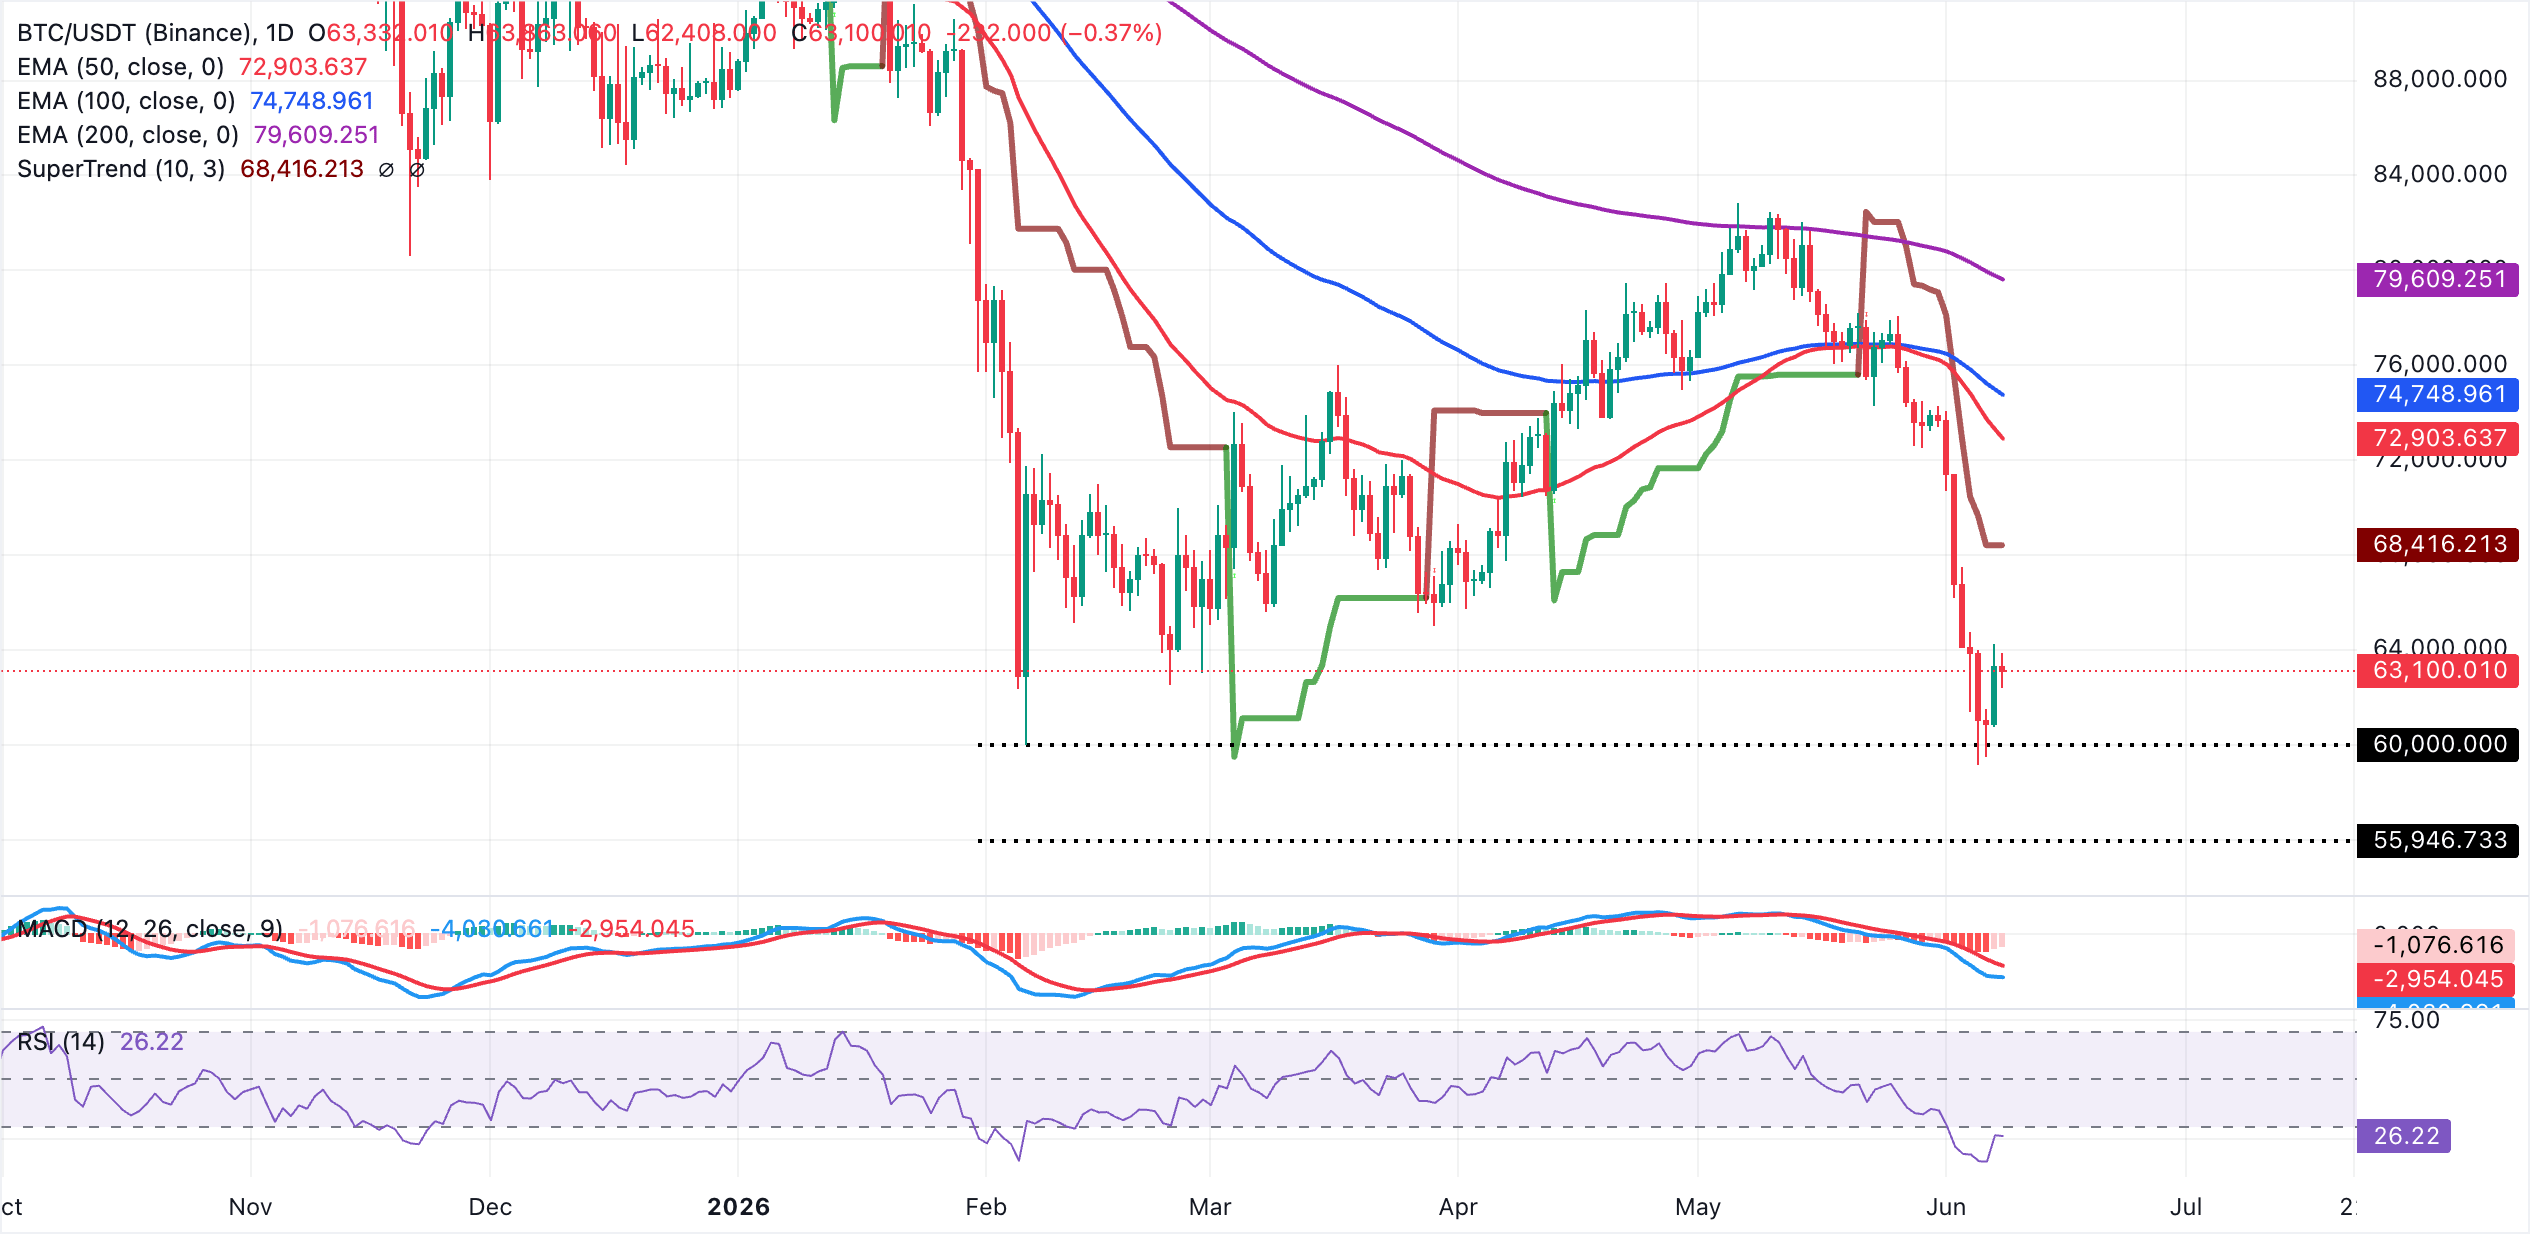
On the topside, initial resistance is aligned at the SuperTrend barrier around $68,416, which guards a deeper recovery toward the clustered daily EMAs, starting with the 50-day EMA near $72,903 and then the 100-day EMA at roughly $74,749. A more decisive shift in tone would require a daily close above the 200-day EMA, now near $79,609, to ease the broader bearish structure. Until then, rallies are likely to face selling interest into these successive resistance zones.
Altcoins technical outlook: Ethereum and XRP wobble, bearish momentum builds
Ethereum trades at $1,666.64, maintaining a bearish near-term bias as price holds well beneath all key moving averages. The 50-day EMA at $2,058, the 100-day EMA at $2,189 and the 200-day EMA at $2,430 all sit overhead, reinforcing a capped structure despite the RSI slipping into oversold territory near 27 on the daily chart, which hints at stretched downside conditions rather than a confirmed reversal signal.
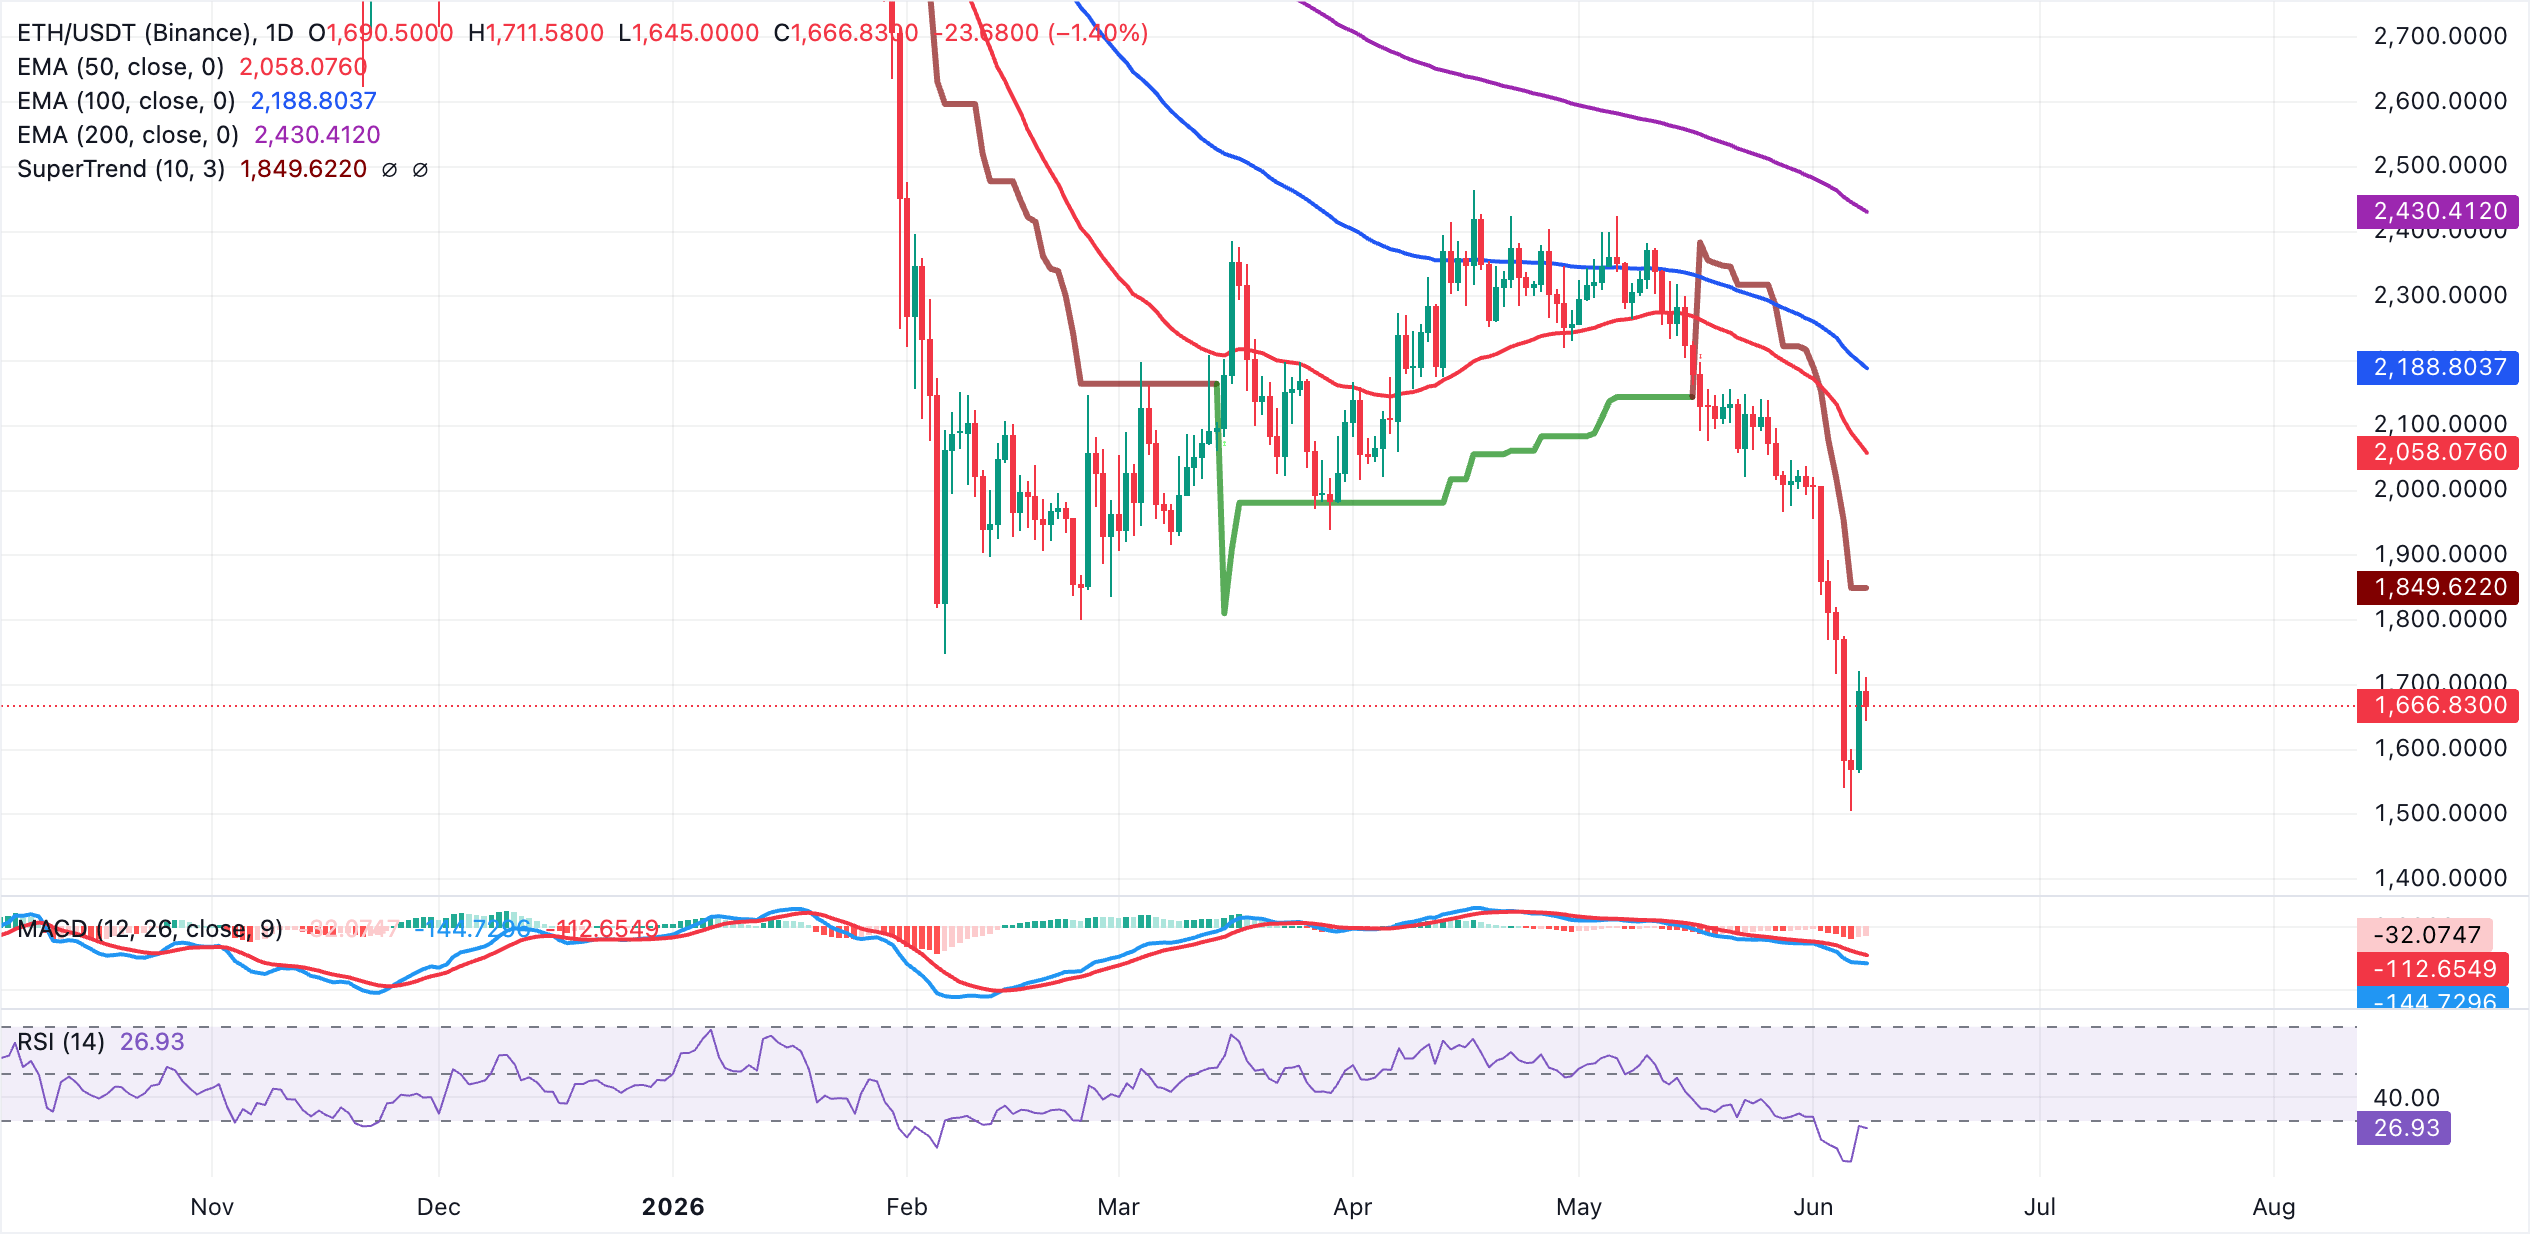
On the topside, initial resistance is highlighted by the SuperTrend line at $1,850, ahead of the 50-day EMA at $2,058, with additional barriers at the 100-day EMA around $2,189 and the 200-day EMA near $2,430. With the MACD histogram deeply negative, momentum still favors sellers, suggesting that rebounds into this overhead band are likely to face supply until price can reclaim at least the lower EMA resistances.
XRP, on the other hand, trades at $1.14, extending a bearish phase with price holding firmly below the 50-day, 100-day and 200-day EMAs clustered from about $1.33 to $1.63. The SuperTrend line at $1.26 also sits above spot, reinforcing a capped tone despite the RSI hovering just above oversold territory near 30 on the daily chart, which hints that downside momentum may be stretched but not yet reversed, while the negative MACD histogram keeps the focus on persistent selling pressure.
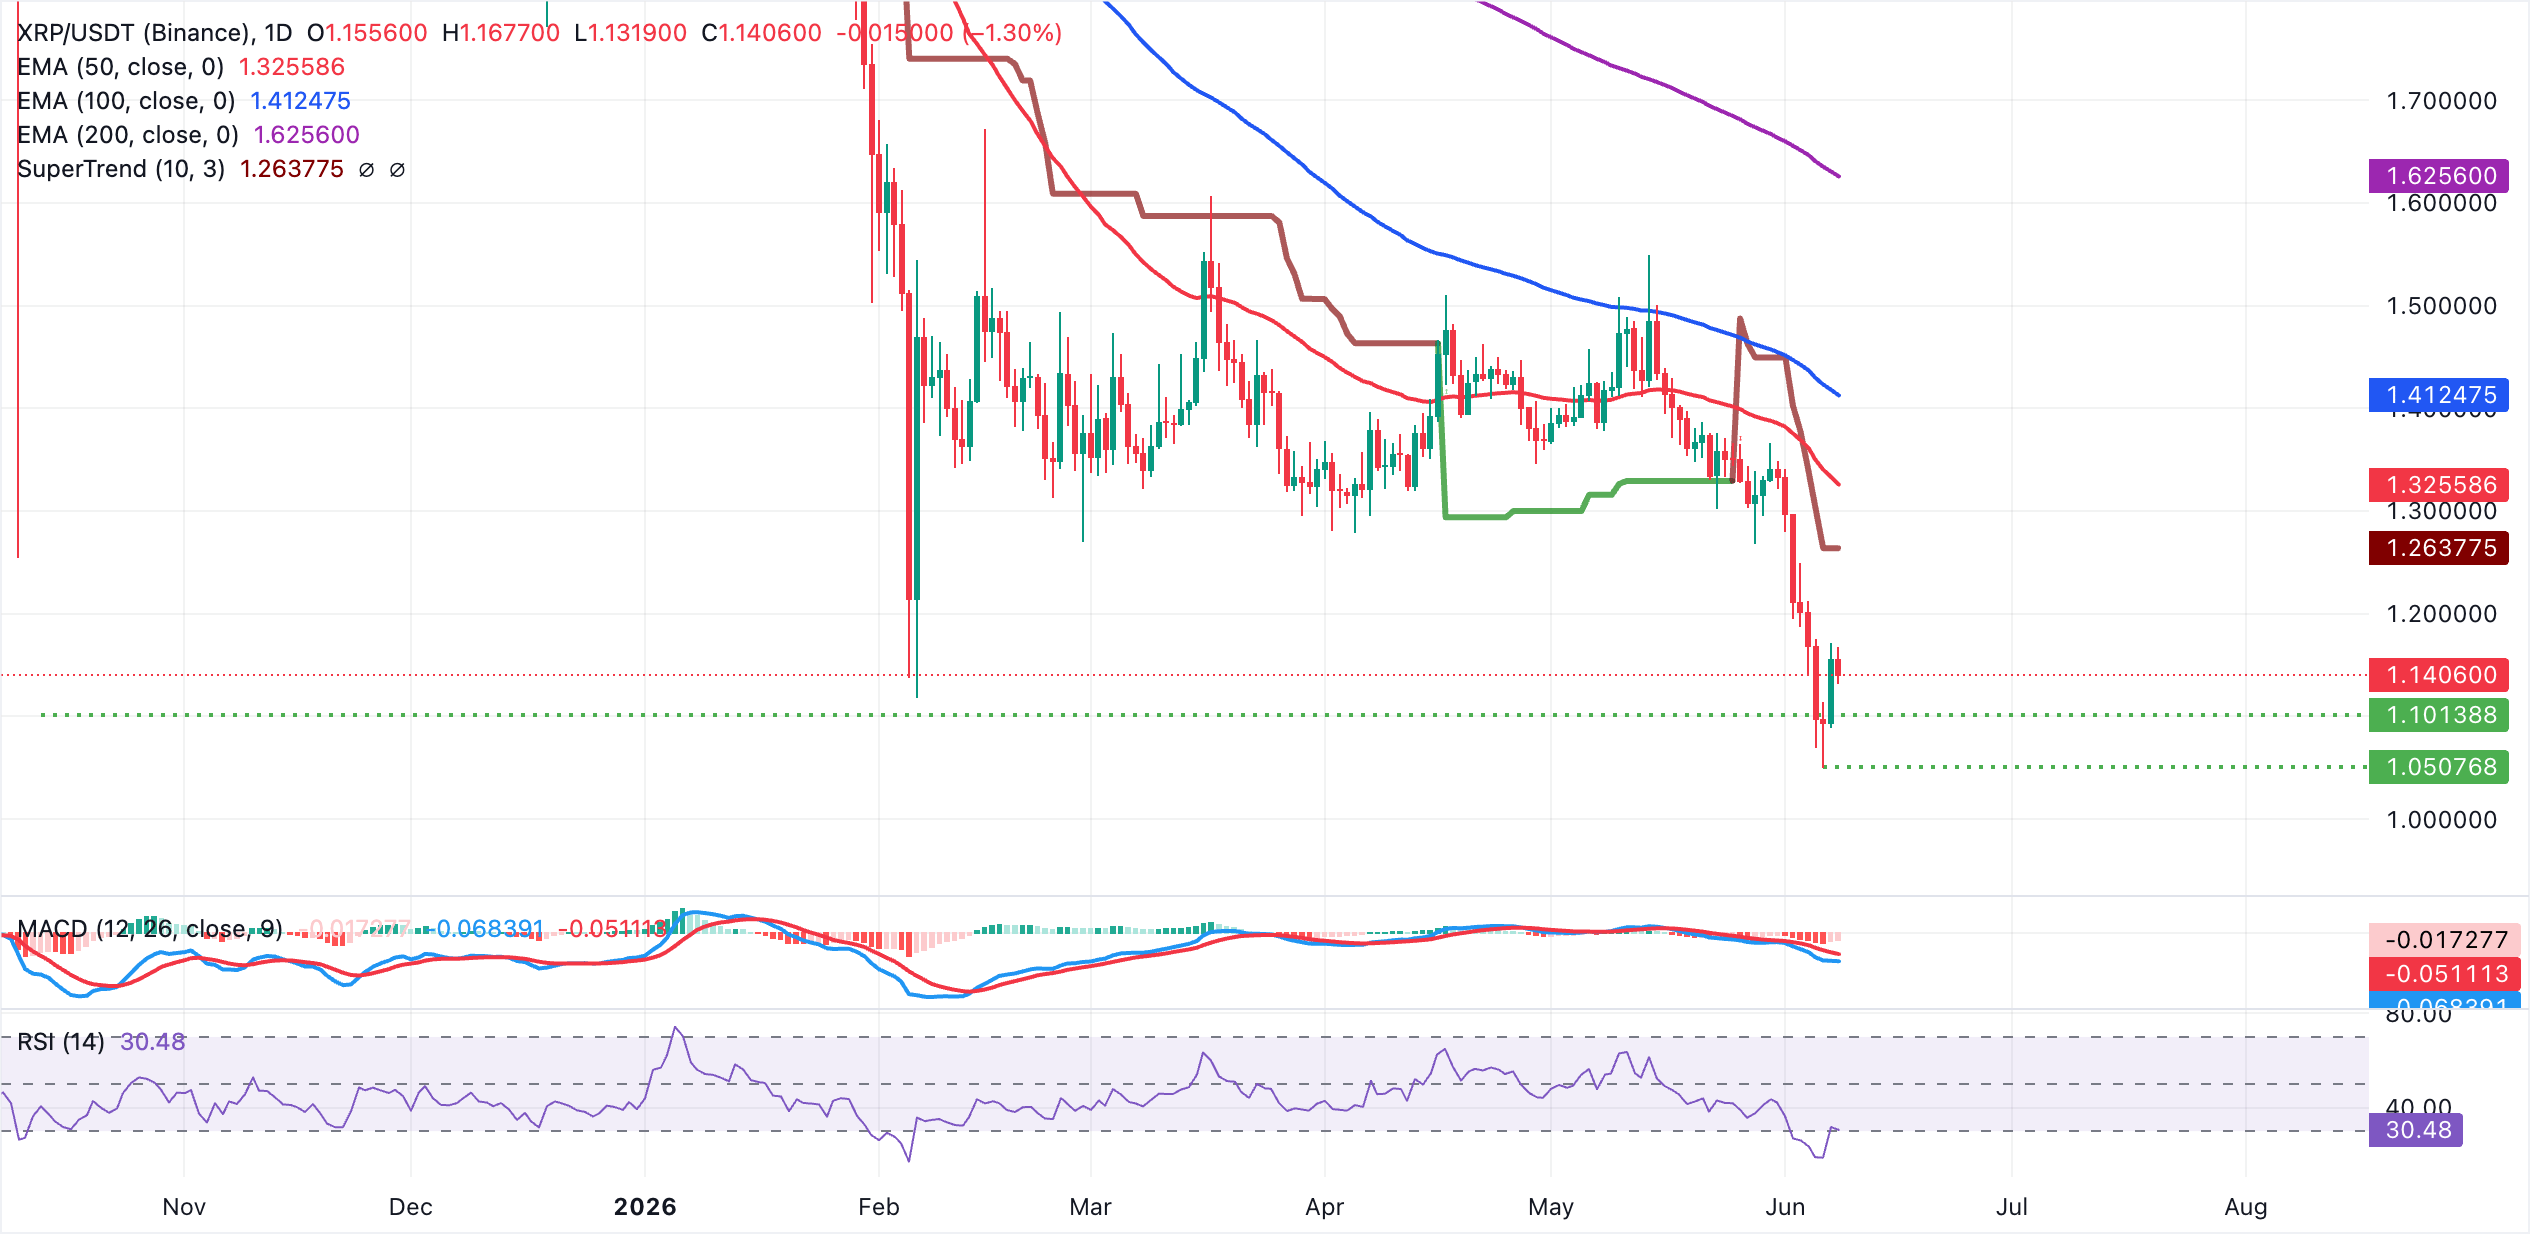
On the topside, initial resistance lies at the SuperTrend barrier around $1.26, with the 50-day EMA at $1.33 providing an additional hurdle ahead of the 100-day EMA near $1.41 and the more strategic 200-day EMA at $1.63. If the sell-off persists, XRP could drop to retest support at $1.05 while exerting pressure on the pivotal $1.00 level.
With no clear technical support levels derived from the provided indicators below the current price, any further slide would leave XRP/USDT
(The technical analysis of this story was written with the help of an AI tool.)
Crypto ETF FAQs
An Exchange-Traded Fund (ETF) is an investment vehicle or an index that tracks the price of an underlying asset. ETFs can not only track a single asset, but a group of assets and sectors. For example, a Bitcoin ETF tracks Bitcoin’s price. ETF is a tool used by investors to gain exposure to a certain asset.
Yes. The first Bitcoin futures ETF in the US was approved by the US Securities & Exchange Commission in October 2021. A total of seven Bitcoin futures ETFs have been approved, with more than 20 still waiting for the regulator’s permission. The SEC says that the cryptocurrency industry is new and subject to manipulation, which is why it has been delaying crypto-related futures ETFs for the last few years.
Yes. The SEC approved in January 2024 the listing and trading of several Bitcoin spot Exchange-Traded Funds, opening the door to institutional capital and mainstream investors to trade the main crypto currency. The decision was hailed by the industry as a game changer.
The main advantage of crypto ETFs is the possibility of gaining exposure to a cryptocurrency without ownership, reducing the risk and cost of holding the asset. Other pros are a lower learning curve and higher security for investors since ETFs take charge of securing the underlying asset holdings. As for the main drawbacks, the main one is that as an investor you can’t have direct ownership of the asset, or, as they say in crypto, “not your keys, not your coins.” Other disadvantages are higher costs associated with holding crypto since ETFs charge fees for active management. Finally, even though investing in ETFs reduces the risk of holding an asset, price swings in the underlying cryptocurrency are likely to be reflected in the investment vehicle too.

100만 명이 넘는 사용자가 FXStreet를 통해 실시간 시장 데이터, 차트 도구, 전문가 인사이트, 포렉스 뉴스를 이용합니다. 포괄적인 경제 캘린더와 교육 웨비나는 트레이더가 정보를 유지하고 신중한 결정을 내리도록 돕습니다. FXStreet는 바르셀로나 본사와 전 세계 지역에 걸쳐 약 60명의 팀으로 구성되어 있습니다.
더 읽기


