

Crypto Today: Bitcoin, Ethereum, XRP pull back amid persistent ETF outflows
- Bitcoin slides below $62,000, weighed down by sustained ETF outflows and risk-averse sentiment.
- Ethereum struggles but holds above $1,700 support as ETF outflows extend for the eighth consecutive week.
- XRP retreats following rejection near $1.20 resistance and risks extending losses toward the $1.00 psychological support level.
The cryptocurrency market is experiencing widespread weakness on Monday, with Bitcoin (BTC) sliding under the $63,000 mark amid ongoing risk aversion. Major altcoins, including Ethereum (ETH) and Ripple (XRP), are following suit, trending lower toward key support levels at $1,700 and $1.10, respectively.

Persistent capital outflows weigh on Bitcoin and Ethereum
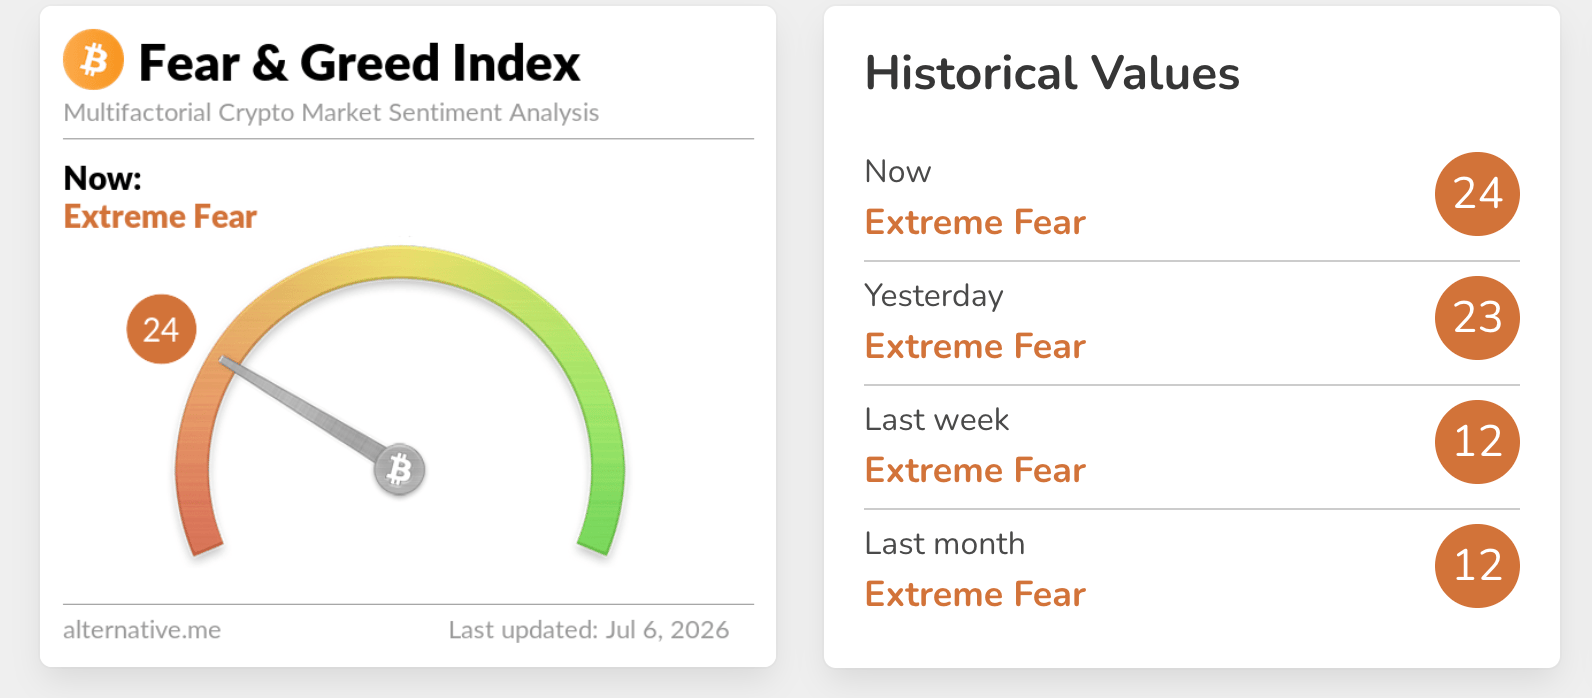
Risk sentiment in the crypto market remains significantly subdued, weighed down by macroeconomic headwinds, geopolitical uncertainties, and a dearth of clear catalysts. Despite the crypto Fear & Greed Index ticking up to 24 on Monday, from an average of 12 last week, appetite for risk assets has not improved.
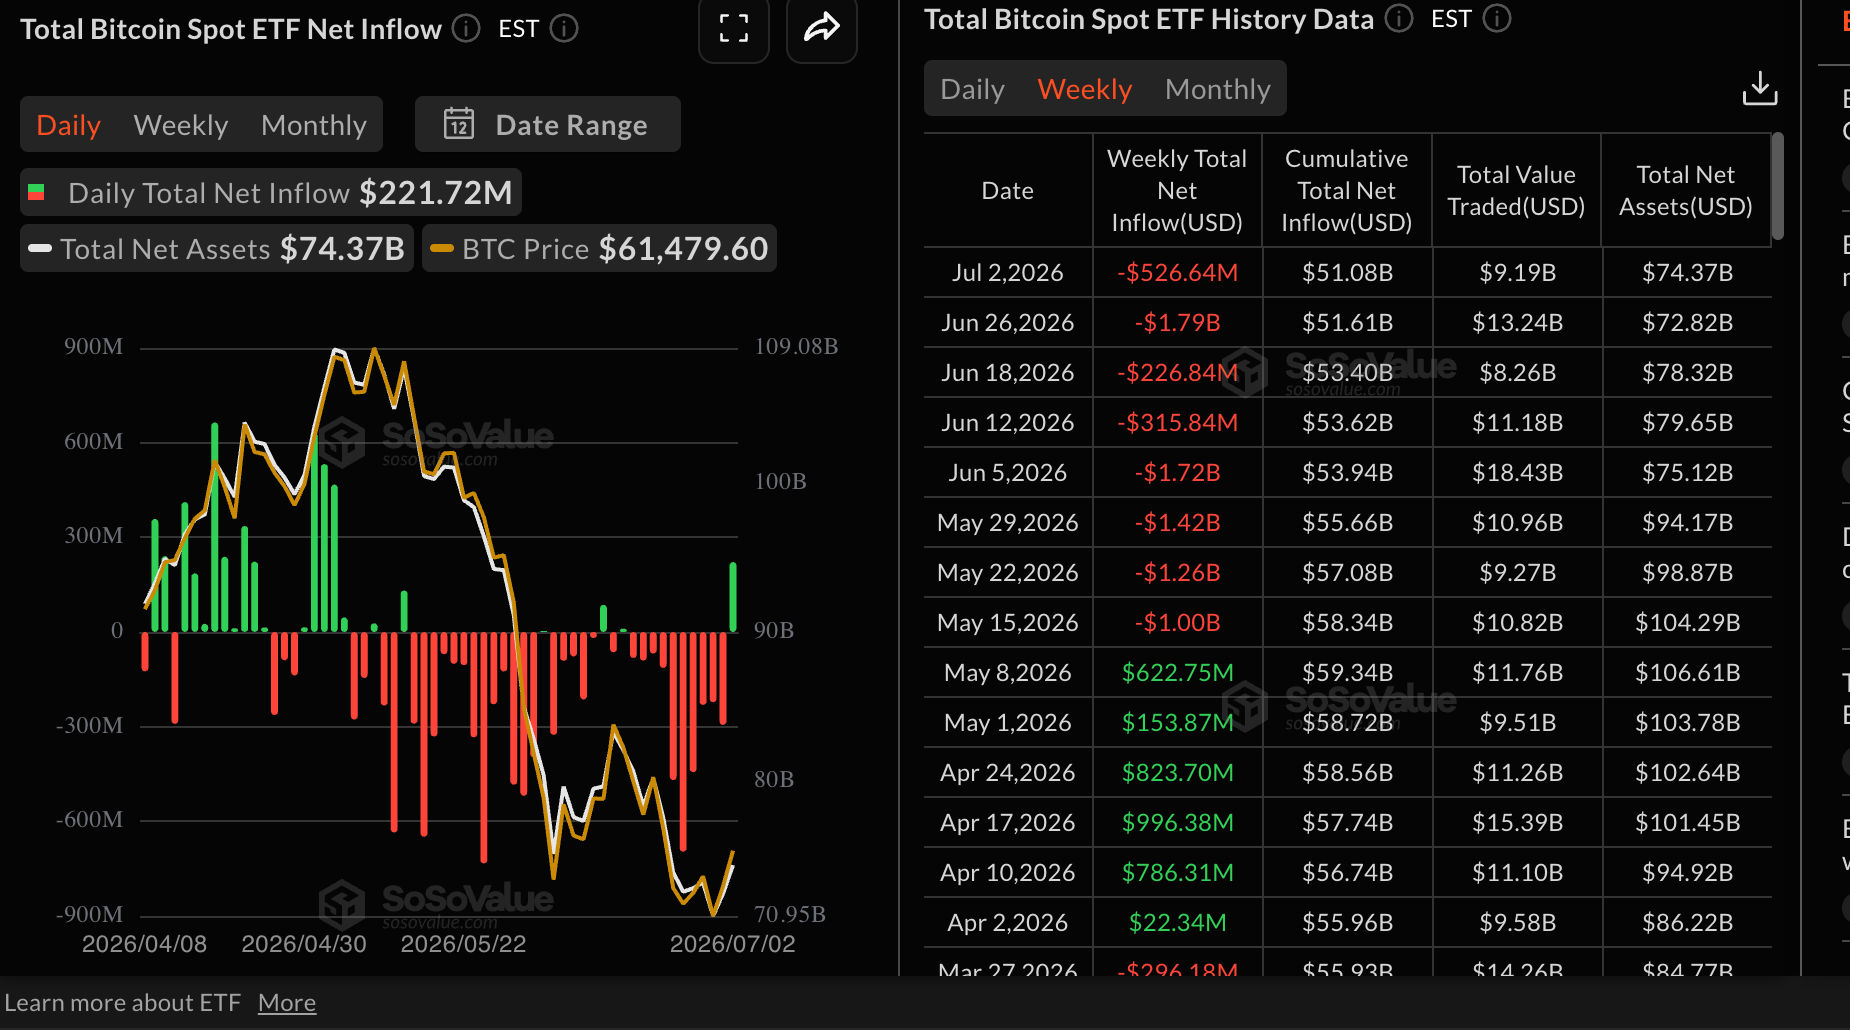
Persistent outflows from US-listed Bitcoin spot Exchange-Traded Funds (ETFs) underscore waning institutional interest, with $527 million withdrawn last week alone. This marks the eighth consecutive week of net redemptions, reinforcing the ongoing bearish narrative.
Despite the outflows, cumulative inflows remain positive at $51 billion, while net assets under management average $74 billion.
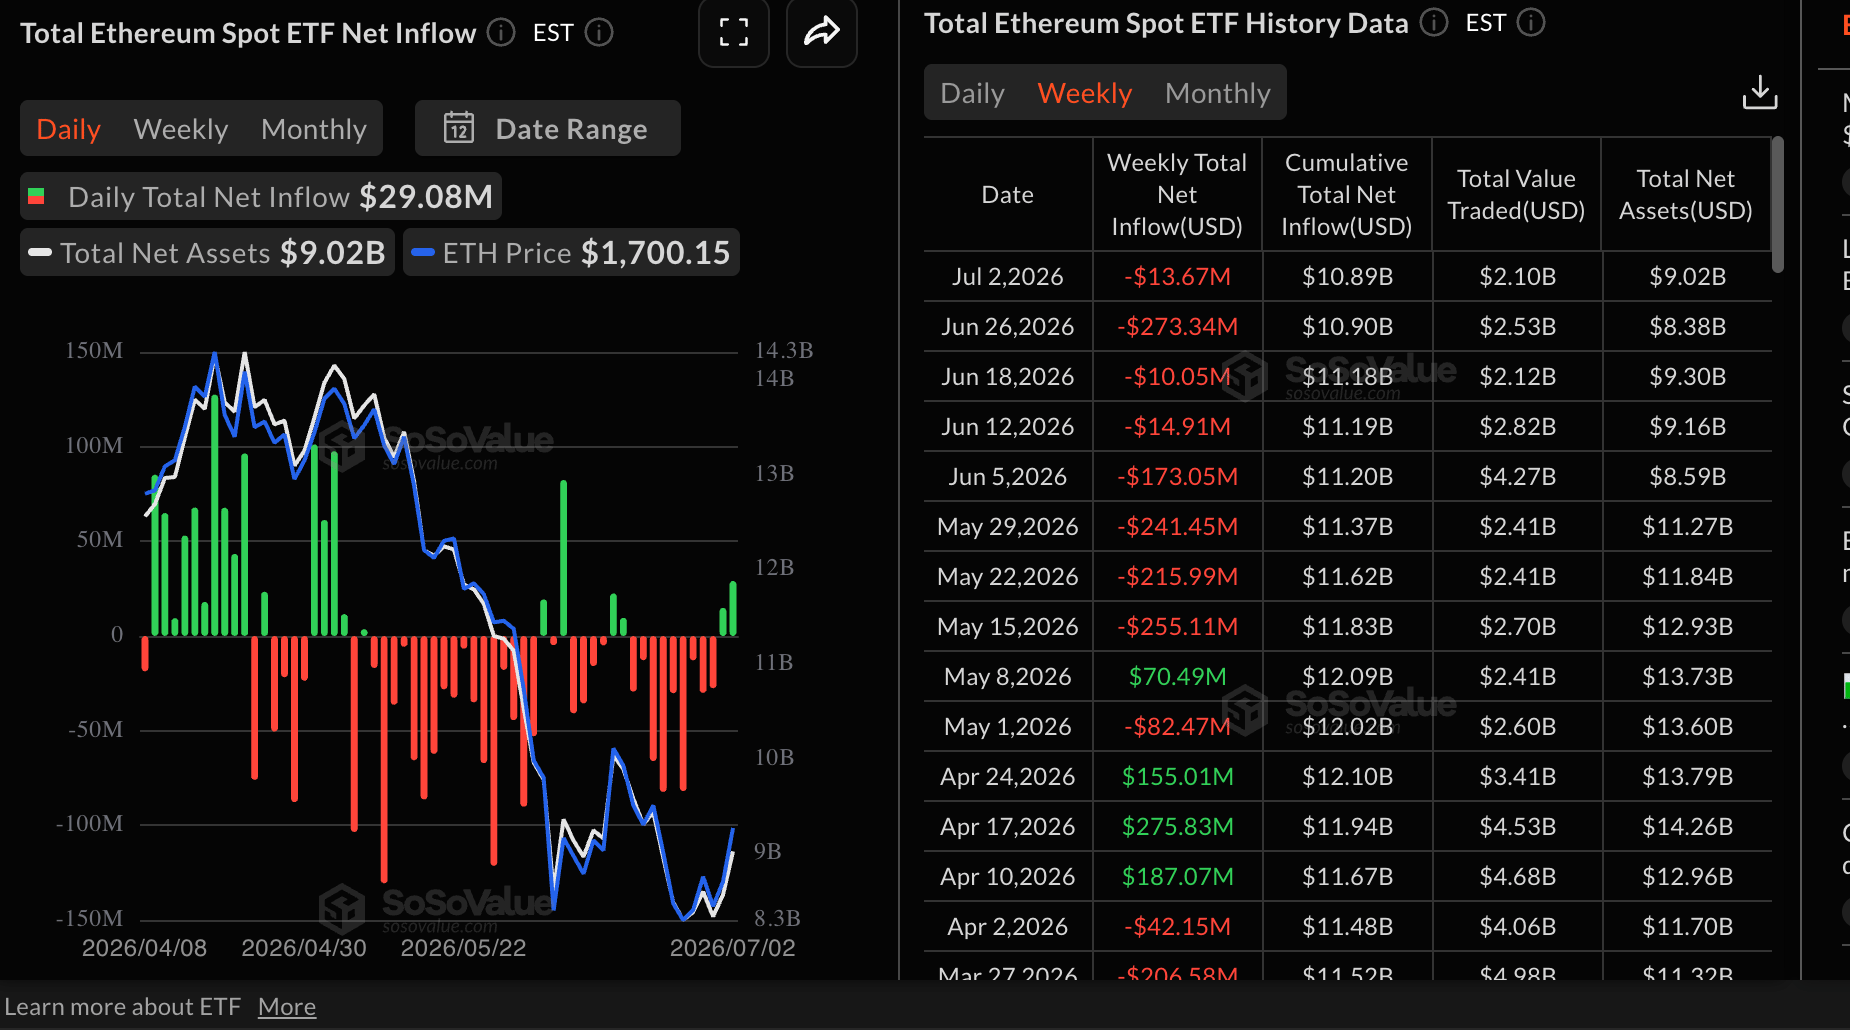
Ethereum spot ETFs present a similar grim picture to Bitcoin, with outflows totaling $14 million last week, down from $273 million the previous week. According to SoSoValue, ETH ETF outflows have persisted for the eighth consecutive week, reflecting ongoing institutional investor caution.
Despite the current market headwinds, cumulative inflows hold steady at $11 billion, with total assets under management at $9 billion, signaling that conviction among long-term investors remains resilient.
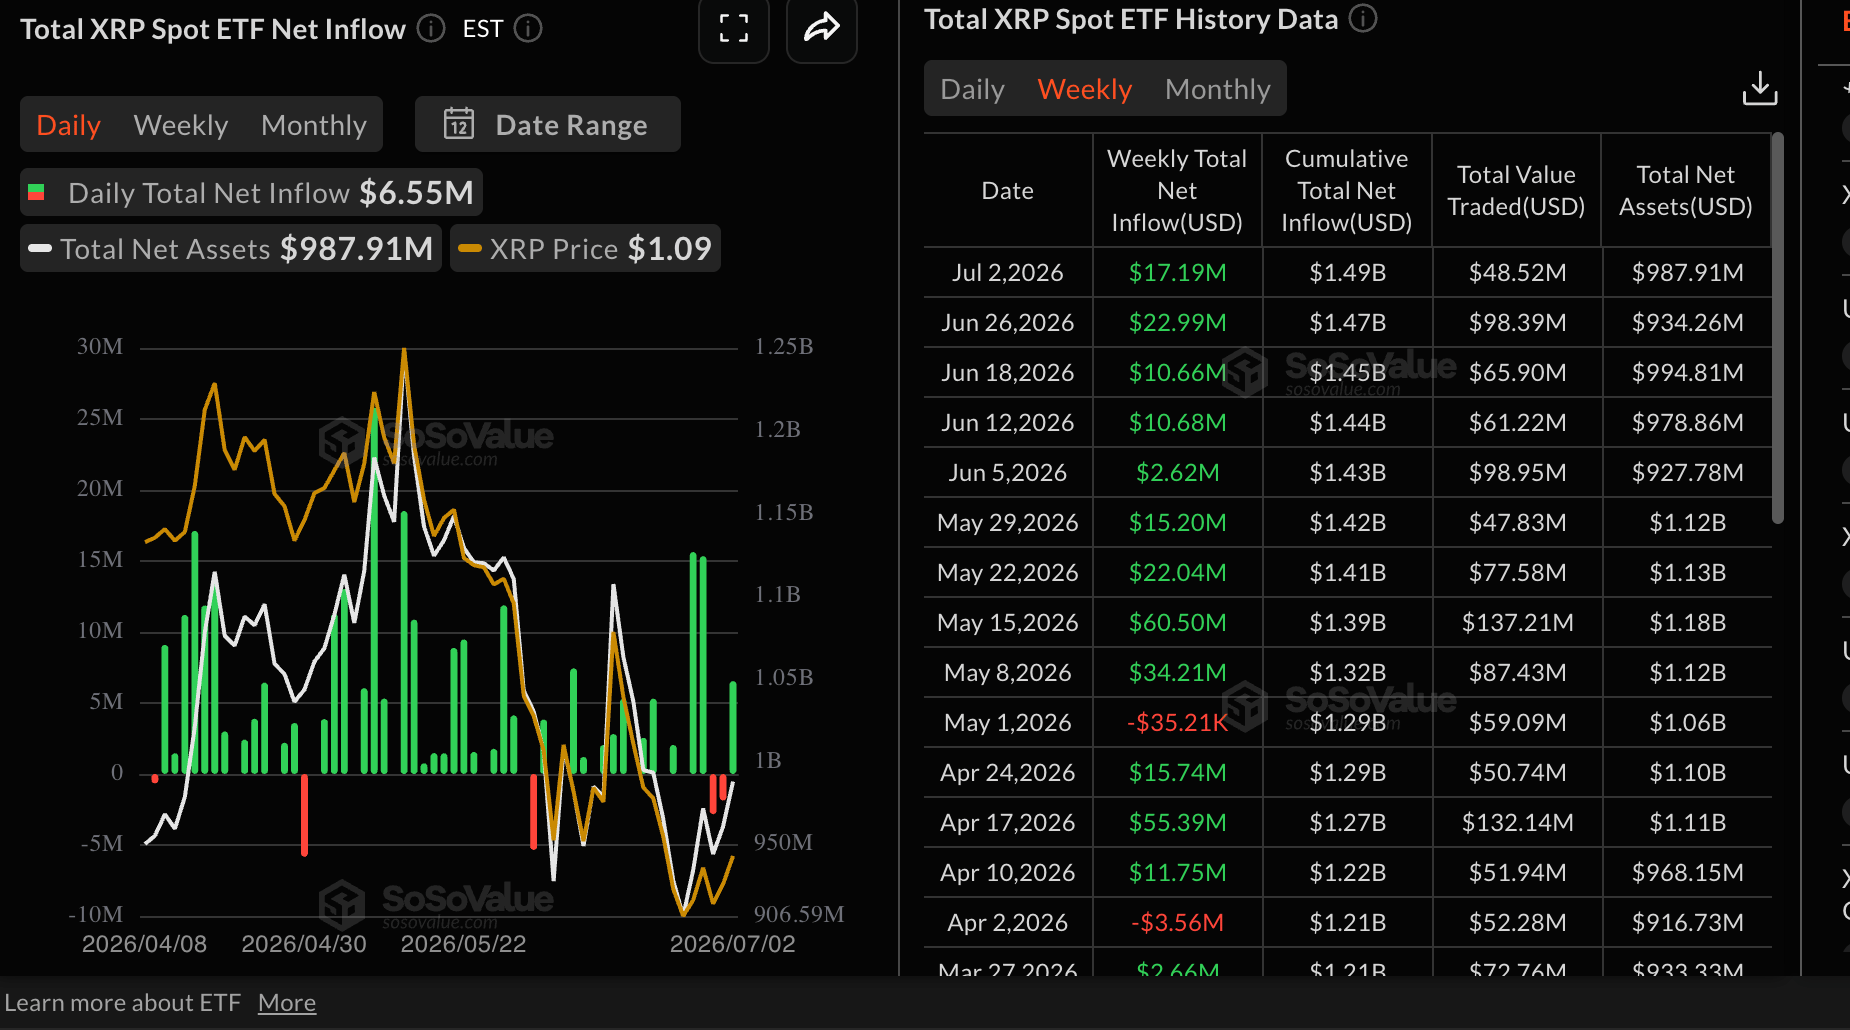
Interest in XRP spot ETFs holds steady, outperforming both Bitcoin and Ethereum to post nearly $12 million in inflows last week. With nine straight weeks of inflows, interest in XRP-related digital investment products remains intact despite the headwinds and broader risk-off sentiment.
Cumulative inflows hold steady at $1.49 billion while net assets under management average $988 million, according to SoSoValue data.
Price analysis: Bitcoin trades under increasing pressure
Bitcoin remains capped below a dense ceiling of moving averages, with the 50-day Exponential Moving Average (EMA) at $65,739 and the 100-day EMA at $69,453 reinforcing a broader downtrend defined by the resistance trendline near $71,371.
The Crypto King holds just above the Bollinger middle band around $61,936, suggesting tentative near-term support, while the Relative Strength Index (RSI) hovers around 49, pointing to neutral momentum despite a still-positive Moving Average Convergence Divergence (MACD) histogram, which hints that bullish pressure is not yet strong enough to reclaim the overhead structure.
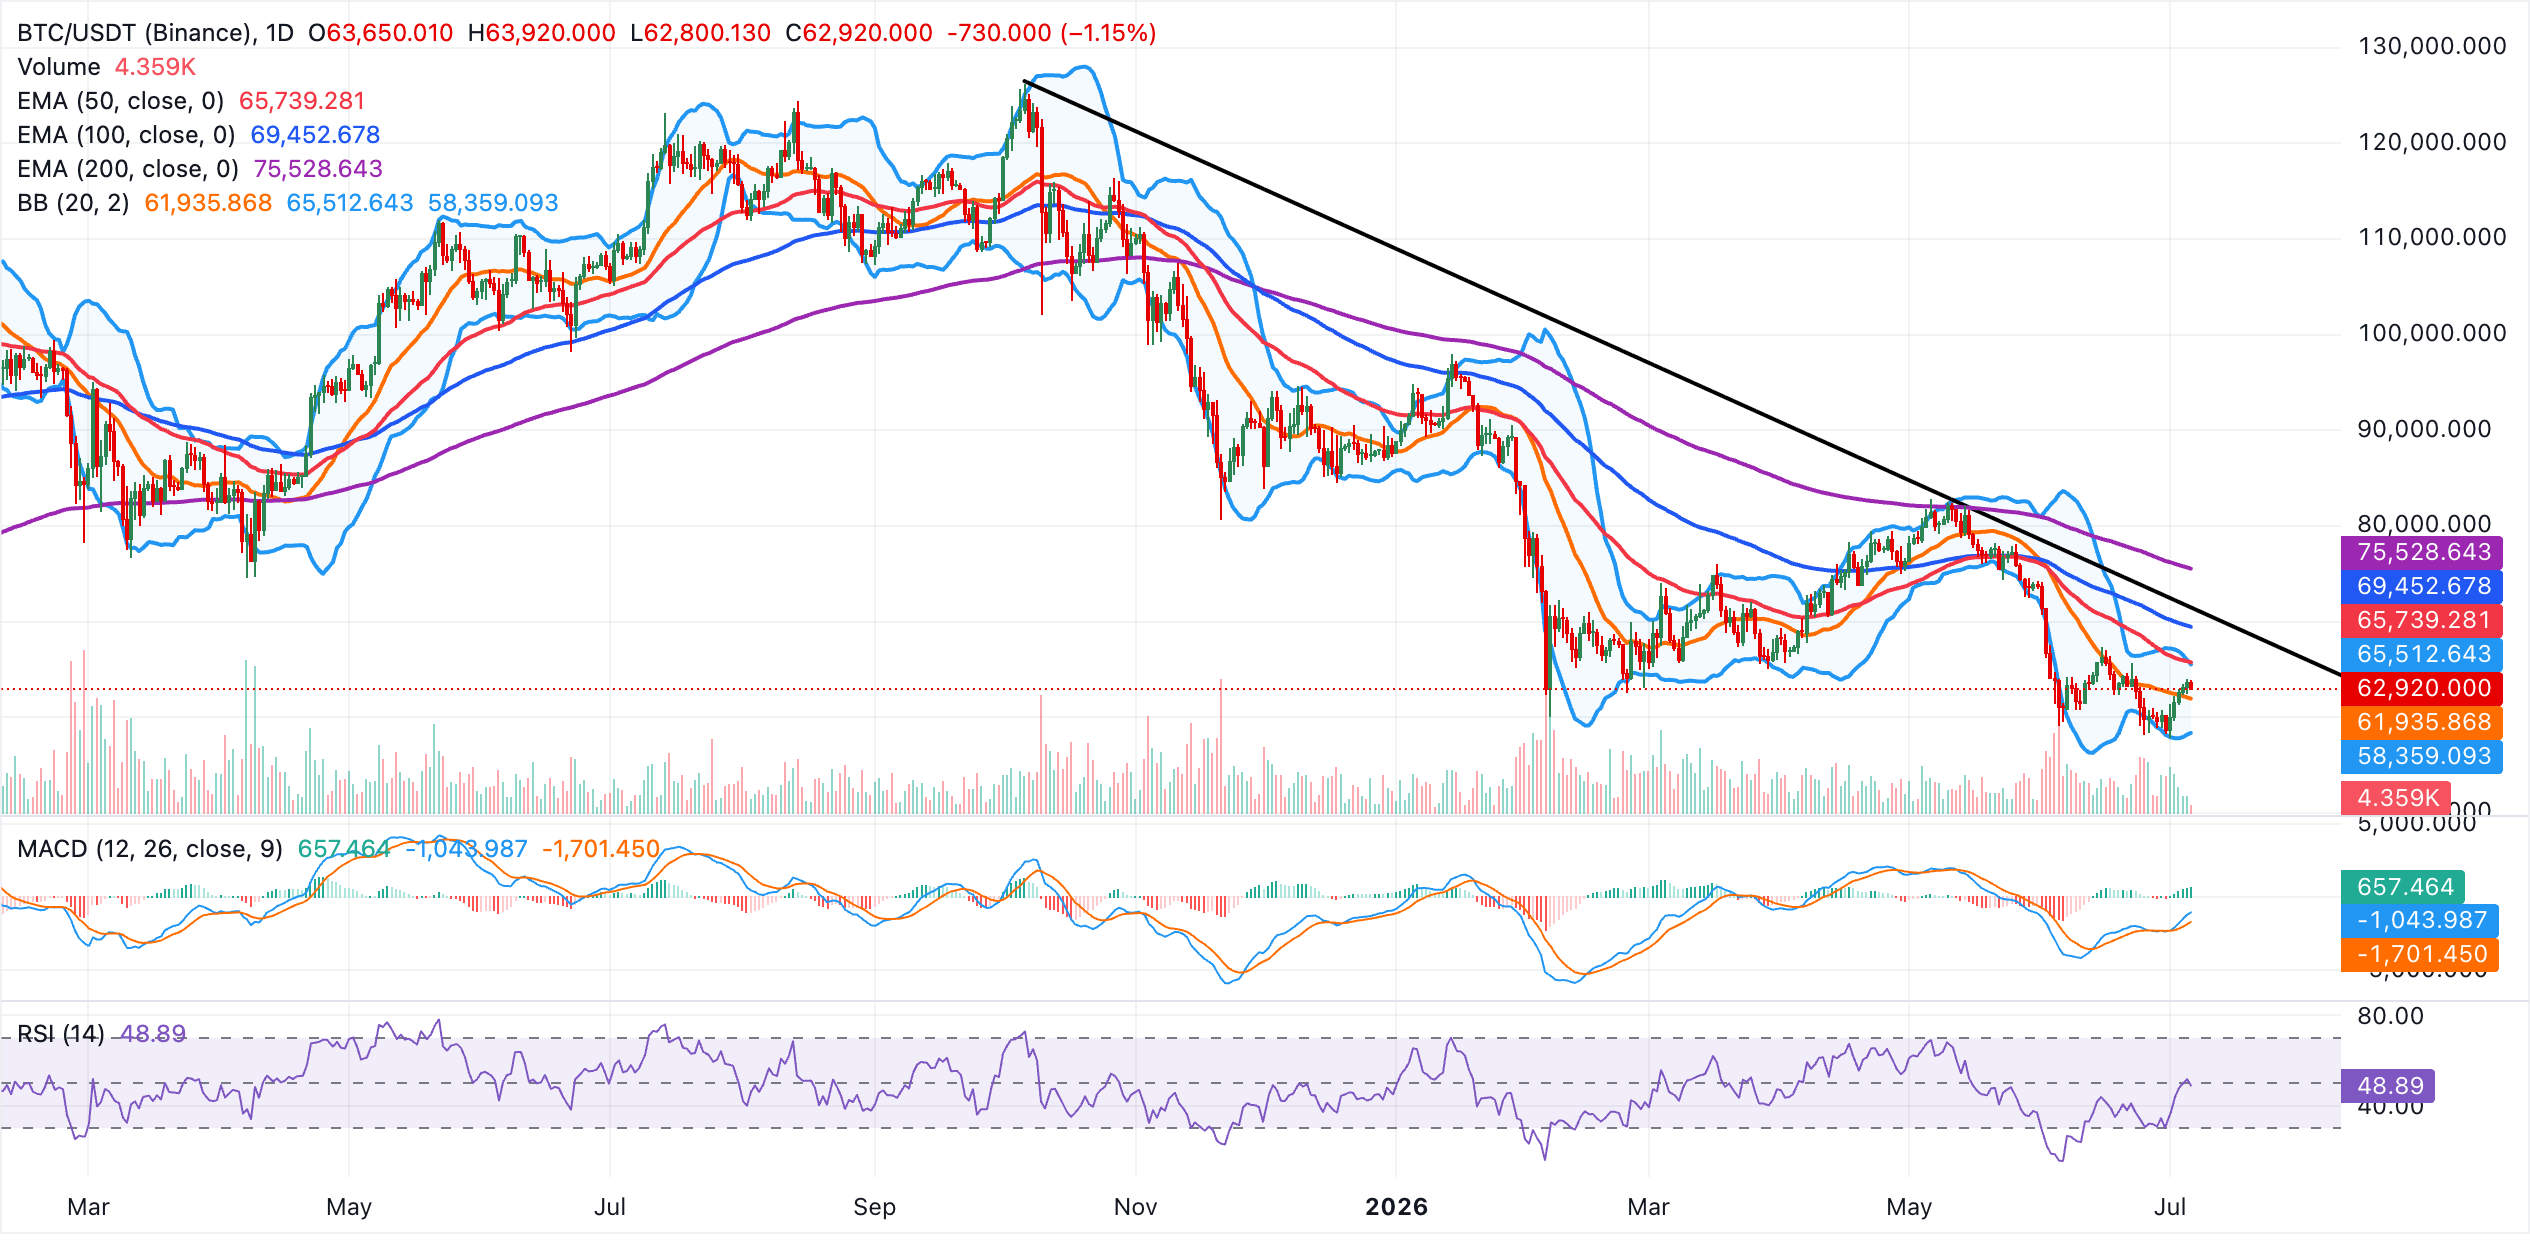
On the topside, initial resistance emerges at the Bollinger upper band near $65,513, followed by the 50-day EMA around $65,739 and the 100-day EMA close to $69,453. Beyond these levels, the downtrend break zone at $71,371 and the 200-day EMA near $75,529 form a broader supply region.
On the downside, immediate support is lies at the Bollinger middle band around $61,936, with further demand near the lower Bollinger band at approximately $58,359. A sustained break below these levels would expose the pair to a deeper leg lower within the prevailing bearish bias.
Ethereum bears tighten grip amid deepening
Ethereum trades at $1,756, keeping a bearish near-term bias as price holds below key EMAs. The 50-day EMA at $1,805 and the SuperTrend line around $1,805 form a tight resistance cluster just overhead, while the 100-day and 200-day EMAs at $1,972 and $2,256 respectively sit well above the market, reinforcing a broader downtrend.
Still, momentum has improved, with the MACD line above its signal and in positive territory and the RSI hovering slightly above 50, hinting that recent buying pressure is attempting to challenge this overhead supply.
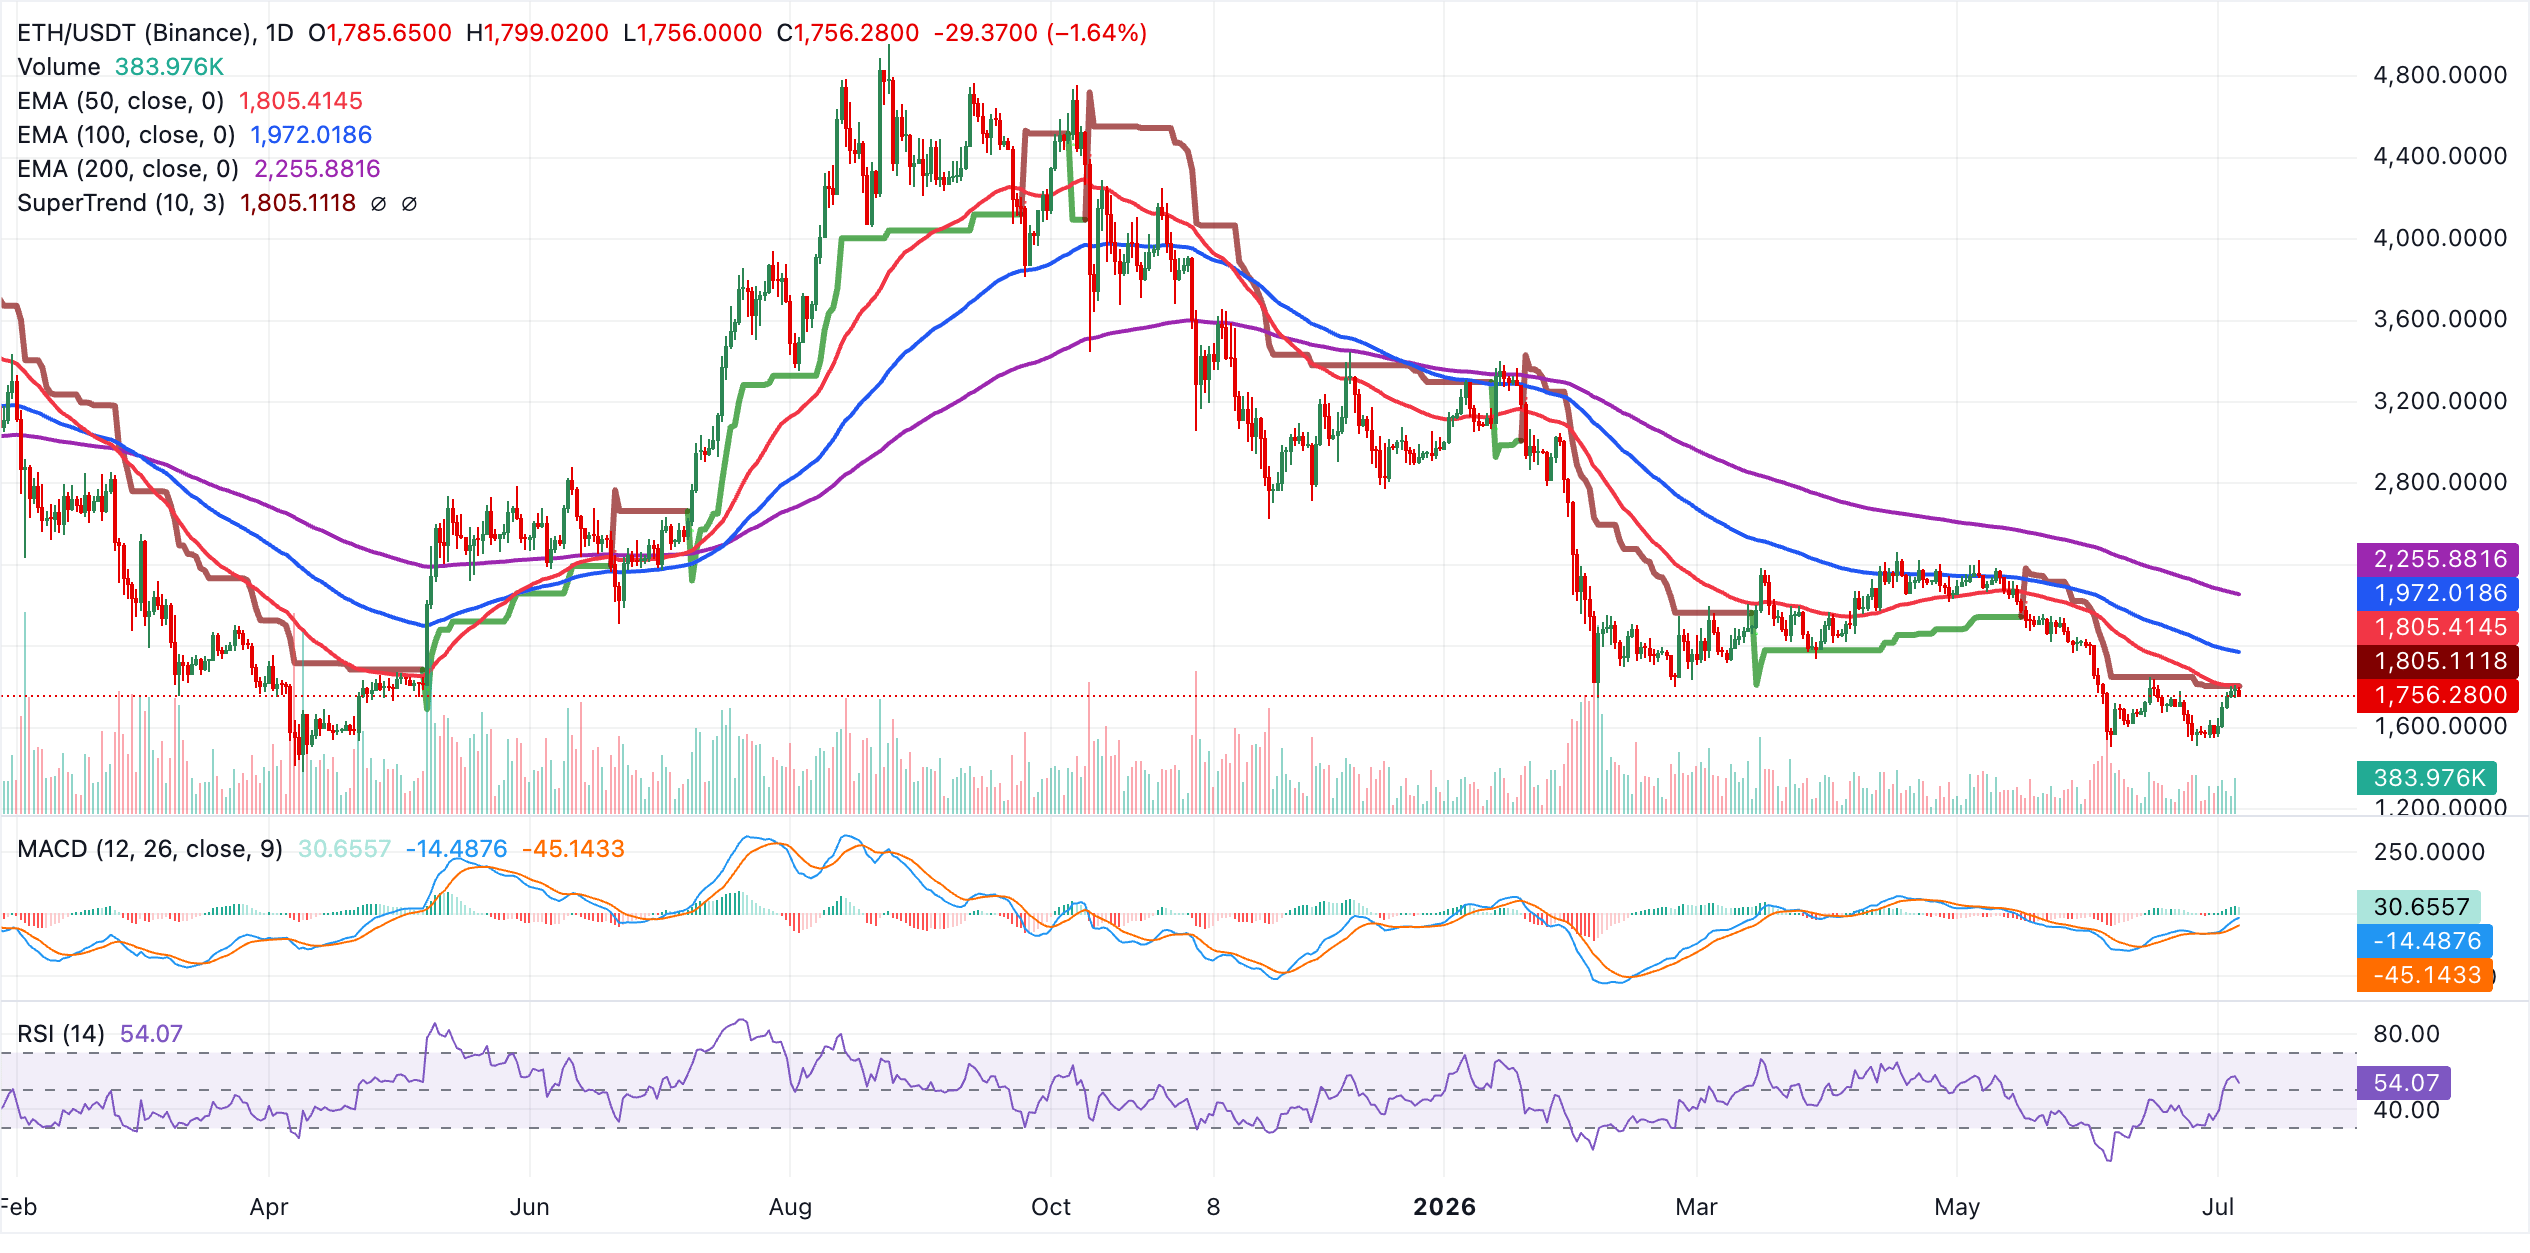
On the topside, immediate resistance is defined by the $1,805 zone, where the SuperTrend and 50-day EMA converge. A sustained break above this area would expose the next hurdle at the 100-day EMA near $1,972, ahead of the more substantial 200-day EMA barrier around $2,256.
The smart contracts token remains vulnerable to persistent headwinds, with traders likely watching price behavior around the $1,700–$1,750 band for signs of whether the nascent momentum can persist or the dominant bearish trend reasserts itself.
XRP eyes short-term support as headwinds intensify
XRP remains capped in the near term, with price holding below the 50-day EMA at $1.18 and well under the 100-day and 200-day EMAs at $1.29 and $1.50 respectively, reinforcing a broader bearish structure despite the recent bounce.
The MACD has turned positive and is edging higher, while the RSI hovers around the neutral 50 line, suggesting improving but still fragile momentum as price oscillates between the Bollinger Bands’ midline and upper layers.
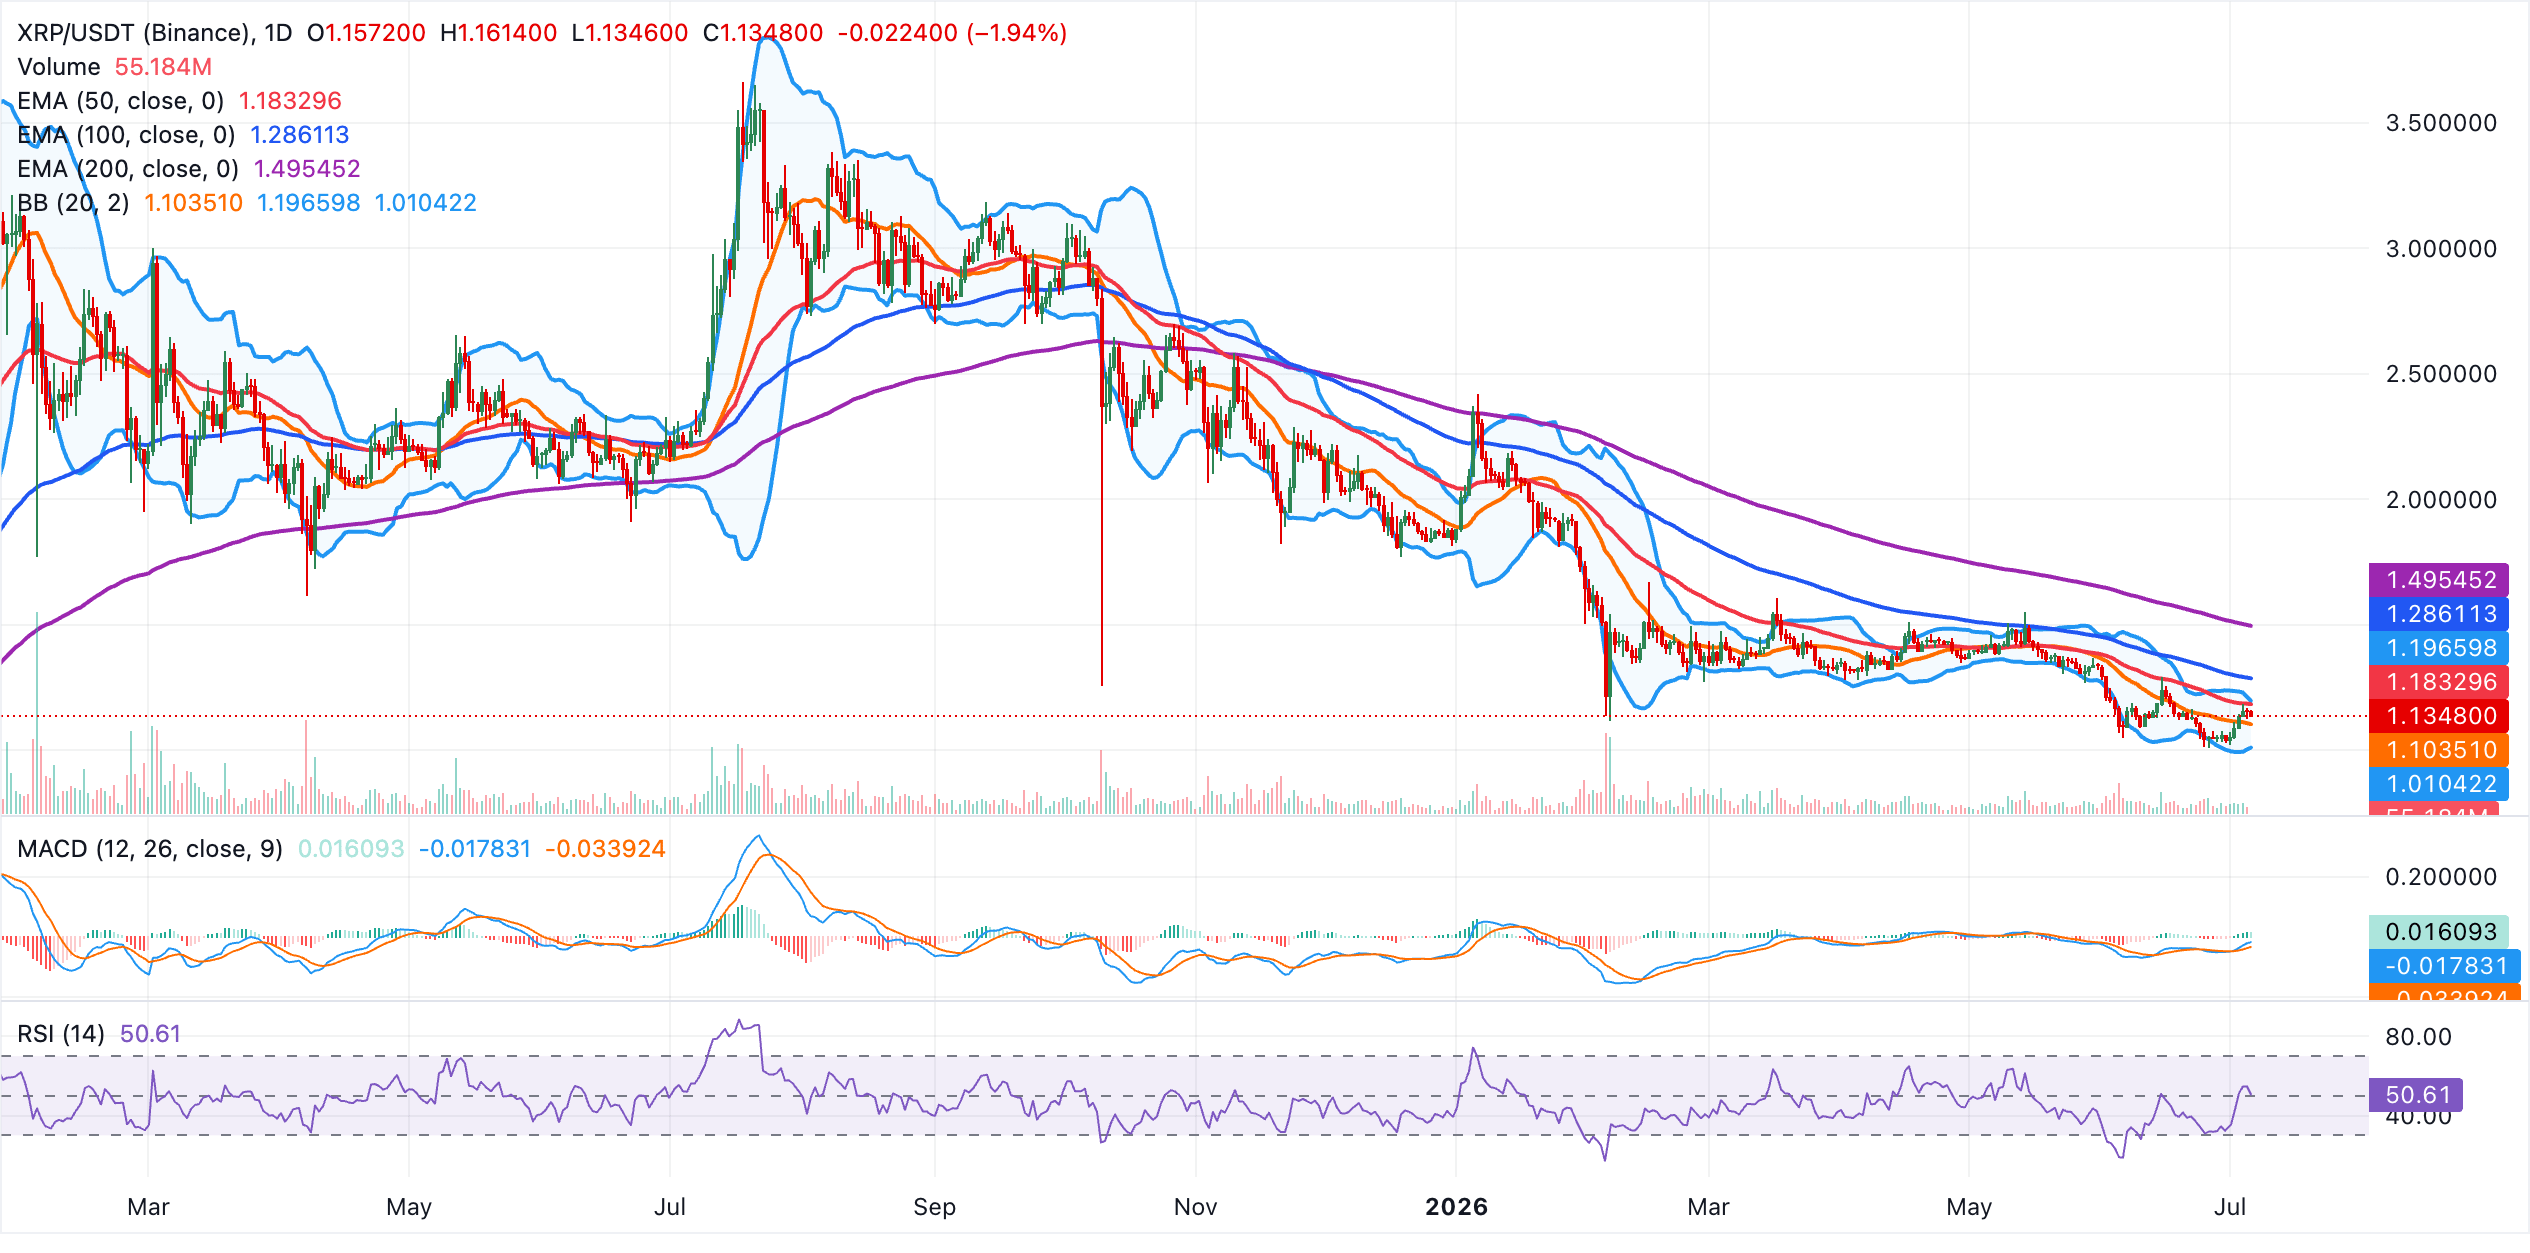
On the topside, initial resistance is seen at the upper Bollinger Band near $1.20, with the 50-day EMA at $1.18 acting as a nearby dynamic barrier that needs to be reclaimed to ease downside pressure. Above these barriers, the 100-day EMA at $1.29 and the 200-day EMA at $1.50 define subsequent resistance layers. Looking down, the Bollinger middle band around $1.10 provides the first notable support, ahead of the lower band near $1.01, where a break would likely reopen the bearish leg toward lower levels.
(This article was created with the help of an Artificial Intelligence tool and reviewed by an editor. Know more.)
Bitcoin, altcoins, stablecoins FAQs
Bitcoin is the largest cryptocurrency by market capitalization, a virtual currency designed to serve as money. This form of payment cannot be controlled by any one person, group, or entity, which eliminates the need for third-party participation during financial transactions.
Altcoins are any cryptocurrency apart from Bitcoin, but some also regard Ethereum as a non-altcoin because it is from these two cryptocurrencies that forking happens. If this is true, then Litecoin is the first altcoin, forked from the Bitcoin protocol and, therefore, an “improved” version of it.
Stablecoins are cryptocurrencies designed to have a stable price, with their value backed by a reserve of the asset it represents. To achieve this, the value of any one stablecoin is pegged to a commodity or financial instrument, such as the US Dollar (USD), with its supply regulated by an algorithm or demand. The main goal of stablecoins is to provide an on/off-ramp for investors willing to trade and invest in cryptocurrencies. Stablecoins also allow investors to store value since cryptocurrencies, in general, are subject to volatility.
Bitcoin dominance is the ratio of Bitcoin's market capitalization to the total market capitalization of all cryptocurrencies combined. It provides a clear picture of Bitcoin’s interest among investors. A high BTC dominance typically happens before and during a bull run, in which investors resort to investing in relatively stable and high market capitalization cryptocurrency like Bitcoin. A drop in BTC dominance usually means that investors are moving their capital and/or profits to altcoins in a quest for higher returns, which usually triggers an explosion of altcoin rallies.













