
Crypto Today: Bitcoin, Ethereum, XRP rebound amid mixed ETF flows
작성자 John Isige
게시일: 4 Mar 2026 | 수정일: 4 Mar 2026


인기 기사

The cryptocurrency market is showing subtle recovery signs despite heightened global uncertainty following the United States (US) and Israel attacks on Iran and the subsequent retaliations that have morphed into a wider Middle East war.
- Bitcoin edges up above $71,000 as crypto prices broadly recover, supported by $225 million in ETF inflows on Tuesday.
- Ethereum rises above $2,000 despite muted institutional interest.
- XRP holds above $1.40, supported by an uptrending MACD and continued inflows into ETFs.
The cryptocurrency market is showing subtle recovery signs despite heightened global uncertainty following the United States (US) and Israel attacks on Iran and the subsequent retaliations that have morphed into a wider Middle East war.
Bitcoin (BTC) has resumed its recovery, holding above $71,000 at the time of writing on Wednesday, following a short-lived correction to $66,158 the previous day.
Like Bitcoin, Ethereum (ETH) and Ripple (XRP) are recovering, trading above $2,000 and $1.40, respectively. A steady uptrend in major crypto assets could reinforce positive market sentiment, likely increasing the odds of a broader rebound.
ETF flows favor Bitcoin and XRP ETFs as Ethereum lags
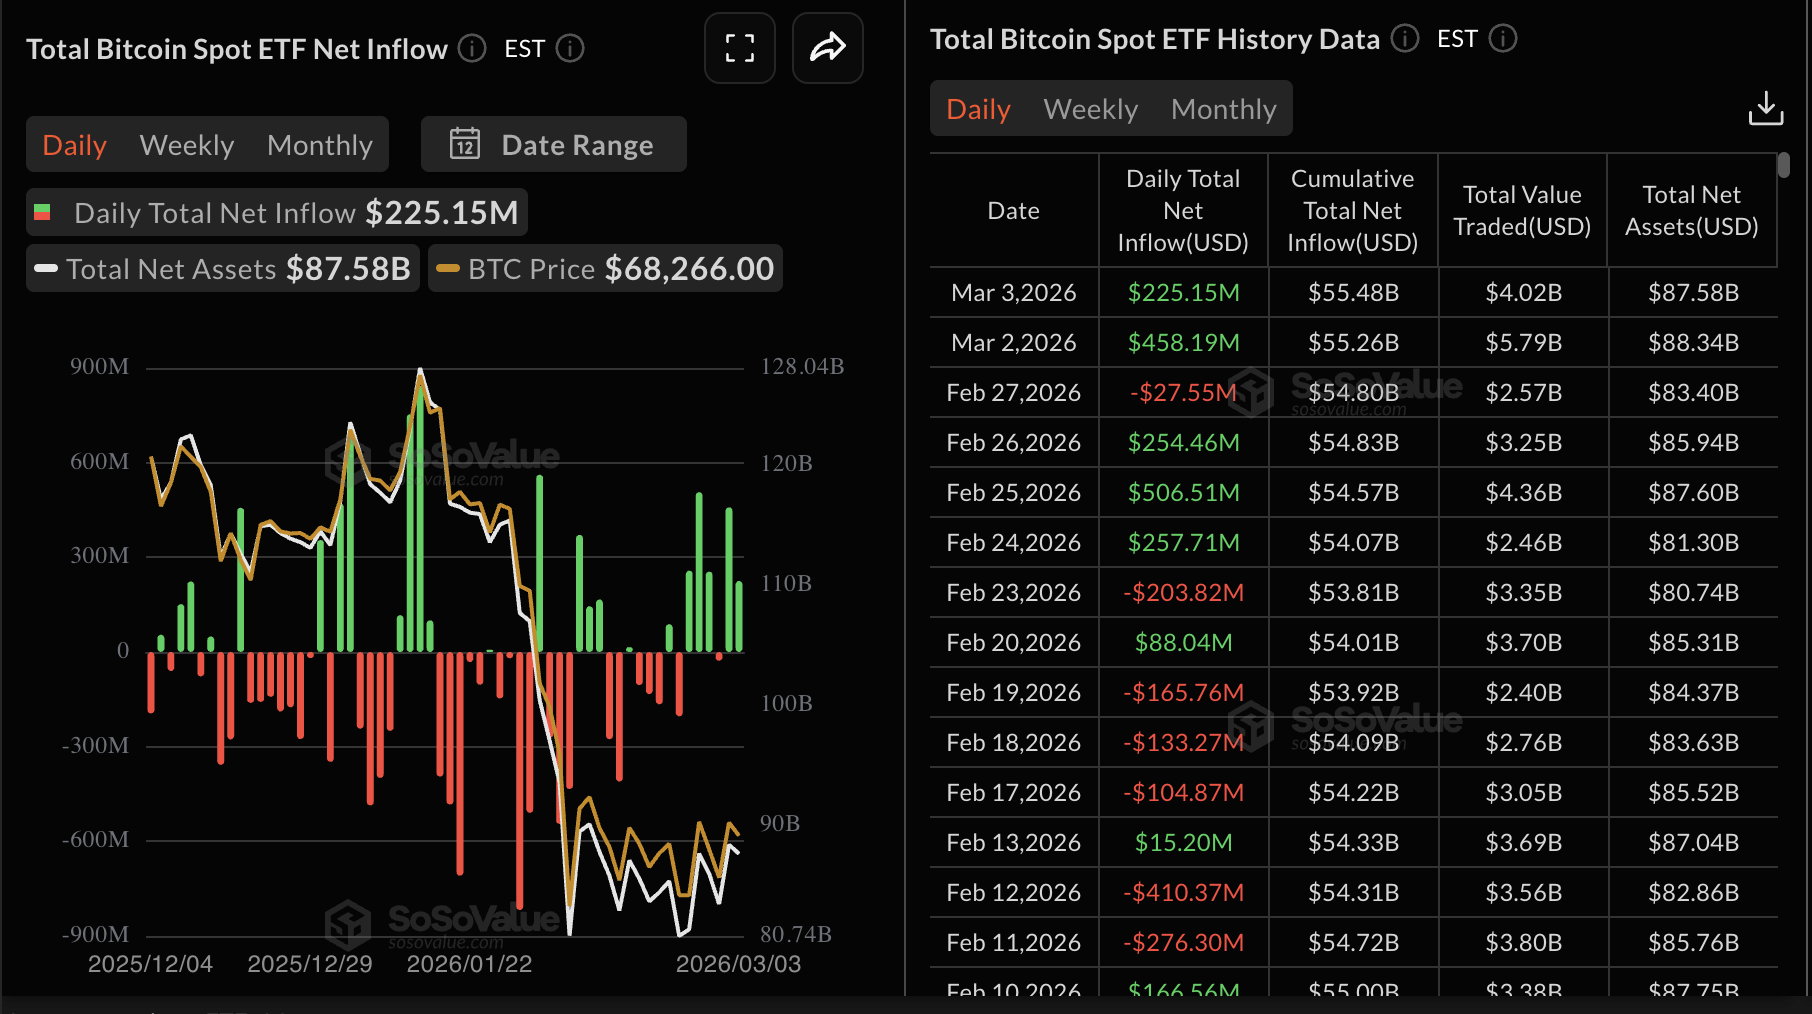
Institutional interest in Bitcoin has remained steady this week, as spot Exchange-Traded Funds (ETFs) recorded inflows of $225 million on Tuesday – a significant drop from $458 million the previous day.
Cumulative inflows increased to $55.48 billion on Tuesday, from $55.26 billion on Monday, while net assets under management averaged $87.58 billion, down from $88.43 billion in the same period.
Steady inflows indicate that appetite for risk assets such as Bitcoin is improving despite uncertainty stemming from the war in the Middle East.
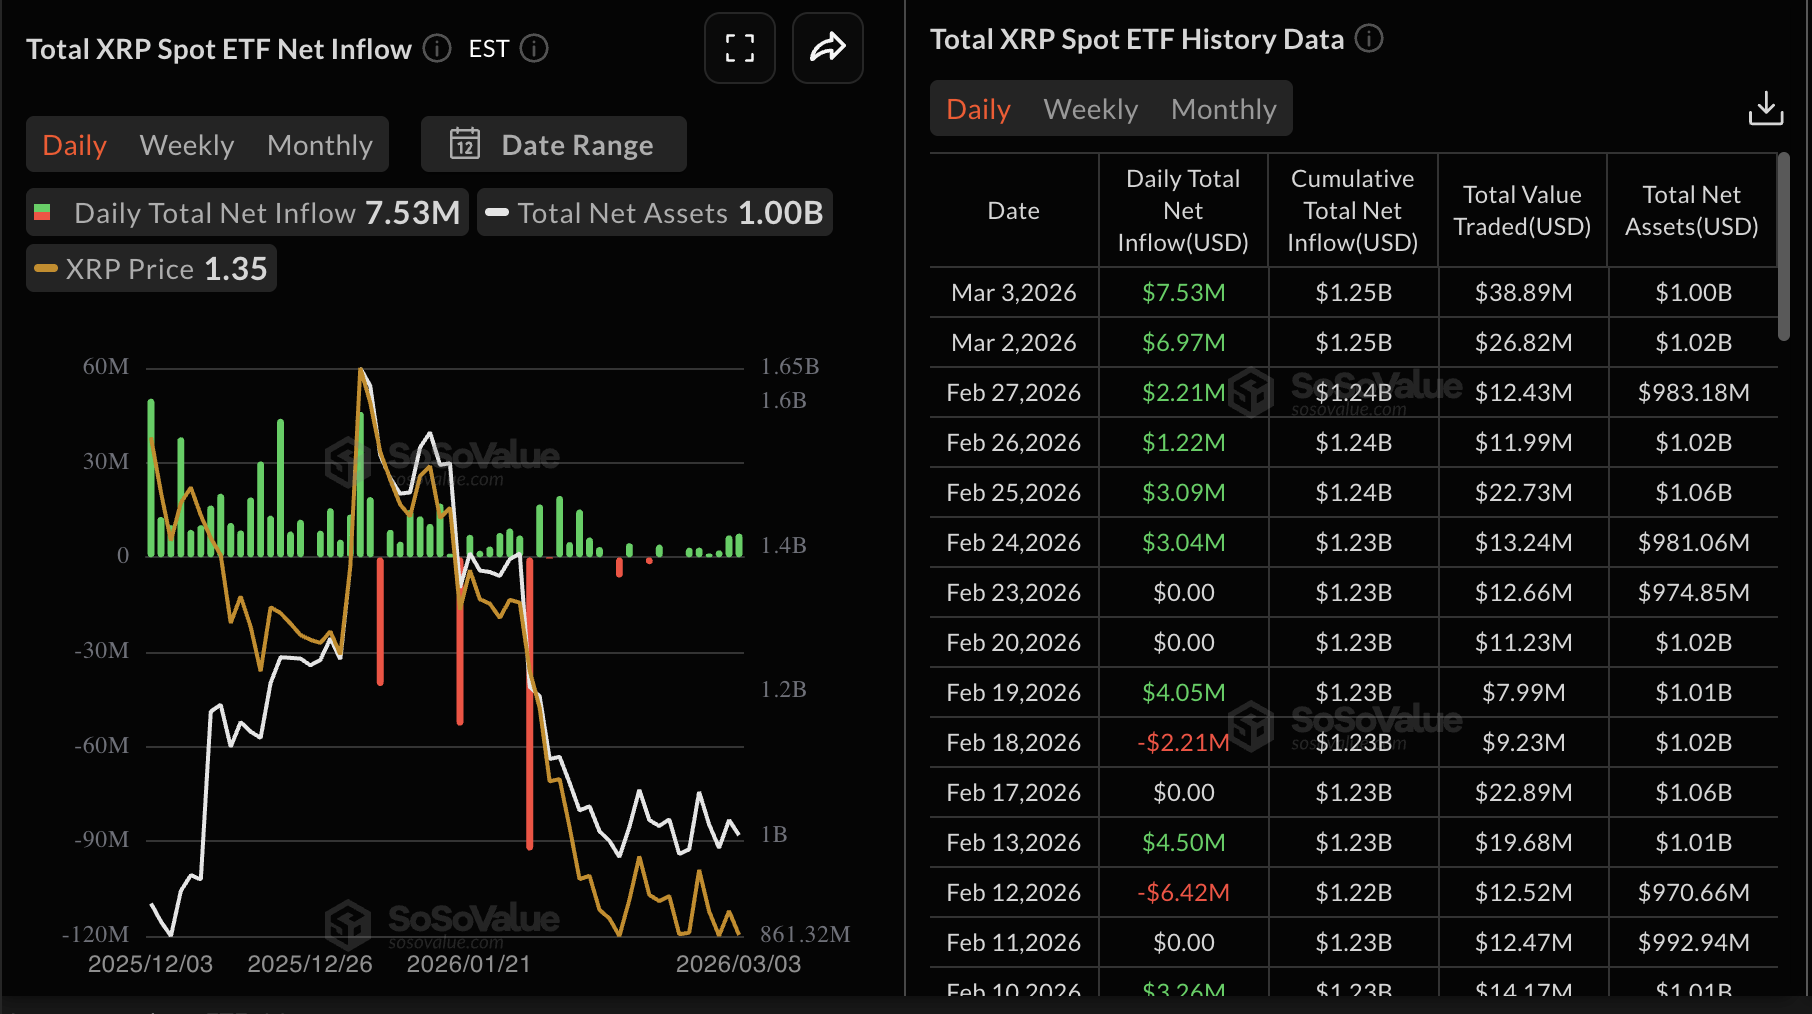
XRP is also mirroring Bitcoin’s steady ETF inflows this week, as evidenced by the US-listed products attracting approximately $7.5 million on Tuesday. Bitwise and Canary Capital ETFs accounted for all the inflows, totaling $6 million and $1.45 million, respectively.
Steady inflows have continued to characterise the remittance token since February 24, bringing cumulative inflows to $1.25 billion and net assets under management to $1 billion.
As for Ethereum, spot ETFs lagged behind their Bitcoin and XRP peers, recording nearly $11 million in outflows on Tuesday. BlackRock and Grayscale ETFs accounted for all inflows, totaling approximately $42 million and $19 million, respectively.
Fidelity’s FETH ETF was deep in the red with outflows totaling $67 million, according to SoSoValue data. Cumulative inflows average $11.63 billion and net assets $11.31 billion.
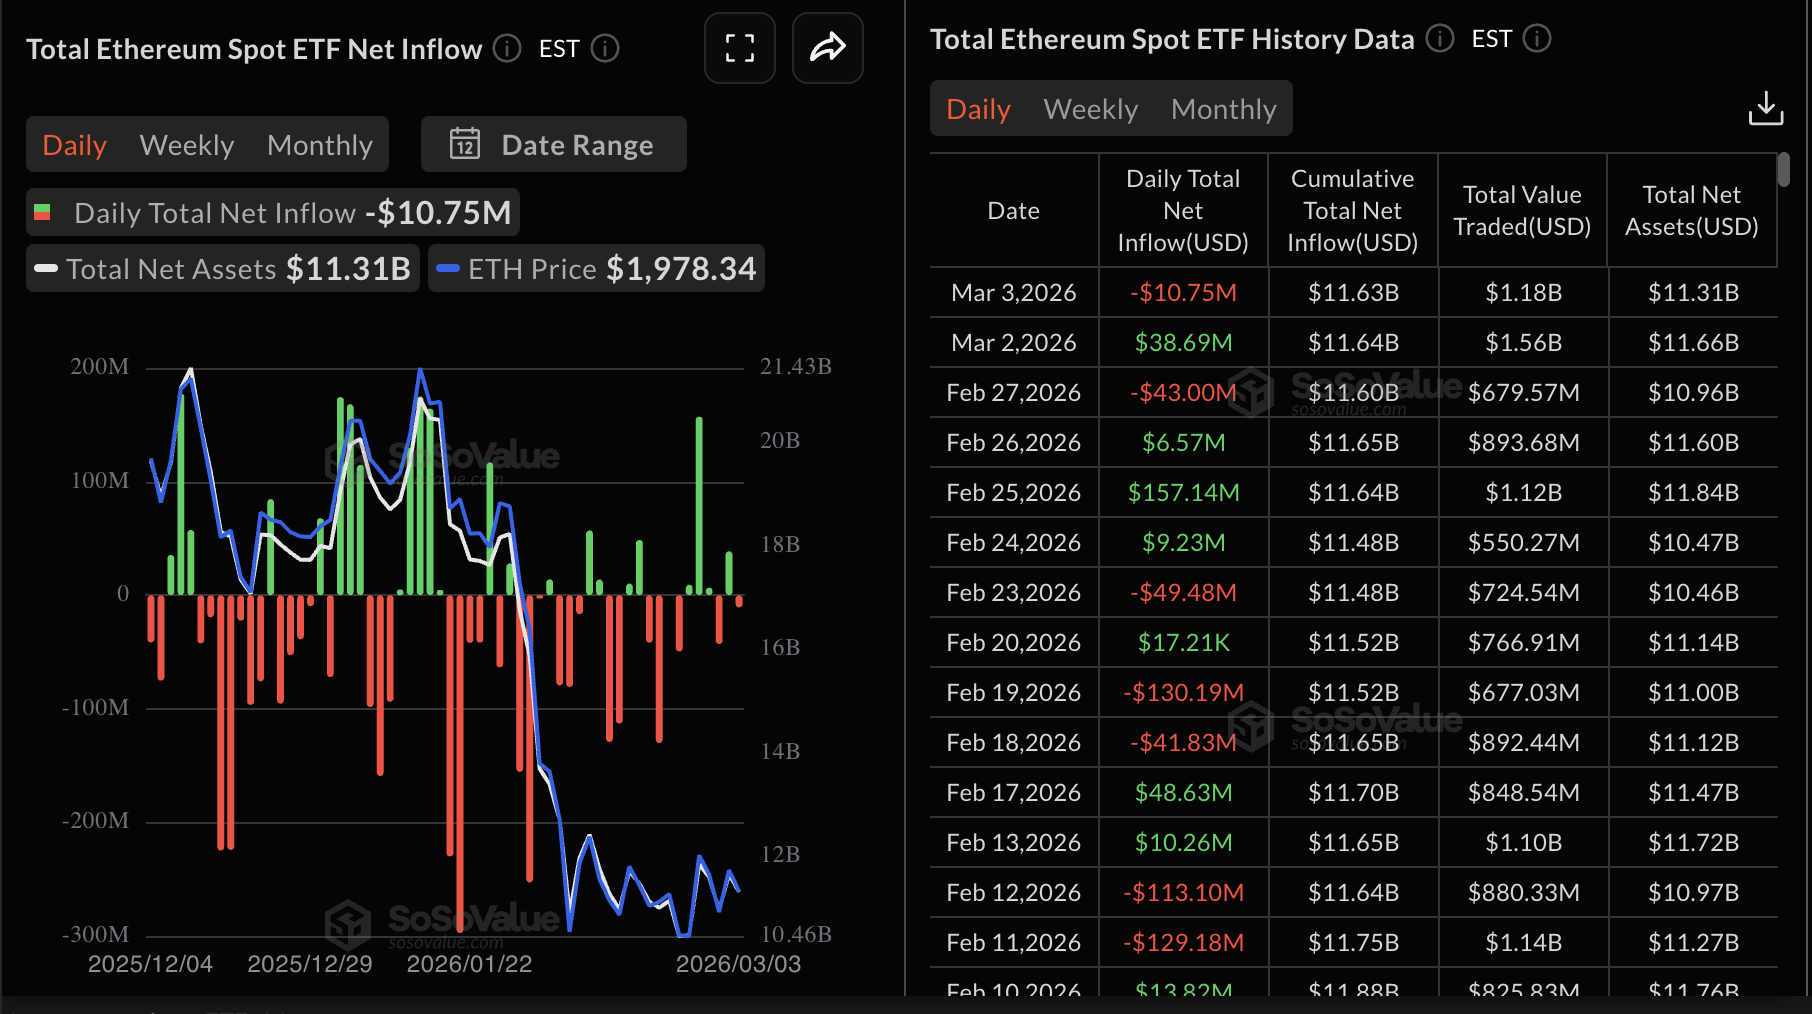
Chart of the day: Bitcoin buyers tighten their grip
Bitcoin is rising above $71,000 at the time of writing on Wednesday, with near-term bias turning mildly bullish as price rebounds from the previous day’s dip and extends toward the upper end of the range with resistance at the February 8 high of $72,271.
Momentum is improving, with the Moving Average Convergence Divergence (MACD) holding above its signal line alongside expanding green histogram bars on the daily chart. This outlook suggests strengthening upside pressure.
The Relative Strength Index (RSI) is around 53 on the same chart, reinforcing the recovery tone. Despite this short-term positive outlook, Bitcoin still trades well below the descending 50-day, 100-day, and 200-day Exponential Moving Averages (EMAs). Thus, the broader trend backdrop remains bearish, and rallies may face overhead supply.
-1772617053721-1772617053722.png)
Initial support emerges around the daily open of $68,338, followed by a deeper floor at Tuesday's low of $66,158 if sellers regain control. On the topside, the $72,271 area acts as first resistance, coinciding with the SuperTrend baseline and a prior reaction high. A daily close above this level would open the way toward the 50-day EMA at $74,398.
Altcoins technical update: Ethereum, XRP show subtle recovery signs
Ethereum is trading above the pivotal $2,000 level, with near-term bias remaining cautiously bullish. The RSI has recovered toward neutral on the daily chart, signaling fading bearish pressure and improving demand after the prior correction.
At the same time, the MACD indicator sits above its signal line on the same chart, with the histogram expanding, suggesting strengthening upside momentum despite price remaining well below the clustered 50-day, 100-day, and 200-day EMAs.
-1772618023356-1772618023359.png)
Immediate support is highlighted by the daily low of $1,945. A break below this level would expose the next downside band toward the Saturday low of $1,835. On the upside, initial resistance is seen in the $2,150 region, which aligns with the February 25 high of $2,148. A stronger supply zone is expected around the 50-day EMA at $2,294.
XRP, on the other hand, is similarly in bullish hands, rising above $1.41 from the daily open of $1.36. Momentum indicators such as the RSI and MACD support the short-term bullish thesis. The RSI, for example, is at 46 on the daily chart and is pointing upward, suggesting that bearish momentum is easing as buyers push to regain control. Moreover, the MACD remains above its signal line on the same chart while green histogram bars expand, hinting at a potentially steady momentum.
-1772618647608-1772618647610.png)
Still, immediate resistance lies around last Wednesday's high of $1.49, followed by the 50-day EMA at $1.57 and the SuperTrend barrier near $1.61. A daily close above this supply range would be needed to soften the bearish tone and open the way toward the 100-day EMA at $1.79 and then the 200-day EMA at $2.03.
Crypto ETF FAQs
An Exchange-Traded Fund (ETF) is an investment vehicle or an index that tracks the price of an underlying asset. ETFs can not only track a single asset, but a group of assets and sectors. For example, a Bitcoin ETF tracks Bitcoin’s price. ETF is a tool used by investors to gain exposure to a certain asset.
Yes. The first Bitcoin futures ETF in the US was approved by the US Securities & Exchange Commission in October 2021. A total of seven Bitcoin futures ETFs have been approved, with more than 20 still waiting for the regulator’s permission. The SEC says that the cryptocurrency industry is new and subject to manipulation, which is why it has been delaying crypto-related futures ETFs for the last few years.
Yes. The SEC approved in January 2024 the listing and trading of several Bitcoin spot Exchange-Traded Funds, opening the door to institutional capital and mainstream investors to trade the main crypto currency. The decision was hailed by the industry as a game changer.
The main advantage of crypto ETFs is the possibility of gaining exposure to a cryptocurrency without ownership, reducing the risk and cost of holding the asset. Other pros are a lower learning curve and higher security for investors since ETFs take charge of securing the underlying asset holdings. As for the main drawbacks, the main one is that as an investor you can’t have direct ownership of the asset, or, as they say in crypto, “not your keys, not your coins.” Other disadvantages are higher costs associated with holding crypto since ETFs charge fees for active management. Finally, even though investing in ETFs reduces the risk of holding an asset, price swings in the underlying cryptocurrency are likely to be reflected in the investment vehicle too.
(The technical analysis of this story was written with the help of an AI tool.)

100만 명이 넘는 사용자가 FXStreet를 통해 실시간 시장 데이터, 차트 도구, 전문가 인사이트, 포렉스 뉴스를 이용합니다. 포괄적인 경제 캘린더와 교육 웨비나는 트레이더가 정보를 유지하고 신중한 결정을 내리도록 돕습니다. FXStreet는 바르셀로나 본사와 전 세계 지역에 걸쳐 약 60명의 팀으로 구성되어 있습니다.
더 읽기


