
Crypto Today: Bitcoin, Ethereum, XRP recovery gathers strength as US-Iran reach peace agreement
작성자 John Isige
수정됨: 15 Jun 2026


인기 기사

Cryptocurrency prices remain broadly elevated on Monday, led by Bitcoin’s (BTC) upswing toward $66,000.
- Bitcoin nears $66,000, extending three consecutive days of steady gains fueled by US-Iran agreement on preliminary peace deal.
- Ethereum rises and settles above $1,700, buoyed by broader improving sentiment and appetite for risk assets.
- XRP remains above $1.18, supported by a progressive technical structure with a MACD buy signal.
Cryptocurrency prices remain broadly elevated on Monday, led by Bitcoin’s (BTC) upswing toward $66,000. Altcoins, including Ethereum (ETH) and Ripple (XRP), mirror Bitcoin’s momentum, trading above $1,700 and $1.18, anchored by improving sentiment after the United States (US) and Iran agreed on a preliminary peace deal to end the war in the Middle East.
Investors embrace risk as US-Iran move toward a peace deal
The US and Iran have announced a peace deal that could lead to the reopening of the Strait of Hormuz. Iran’s deputy foreign minister confirmed the deal expected to be signed on Friday on state TV. Tehran’s top military command described the news as a victory.
Details of the peace agreement are yet to be released; however, according to CNN, the ceasefire that began in early April will be extended in both duration and scope, paving the way for 60 days of continued peace talks.
Meanwhile, Iran’s National Security Council said the US naval blockade will be lifted immediately, and the war will end on all fronts, including Israel’s offensive in Lebanon. Nevertheless, Israel has widened its attacks in southern Lebanon, according to the National News Agency (NNA).
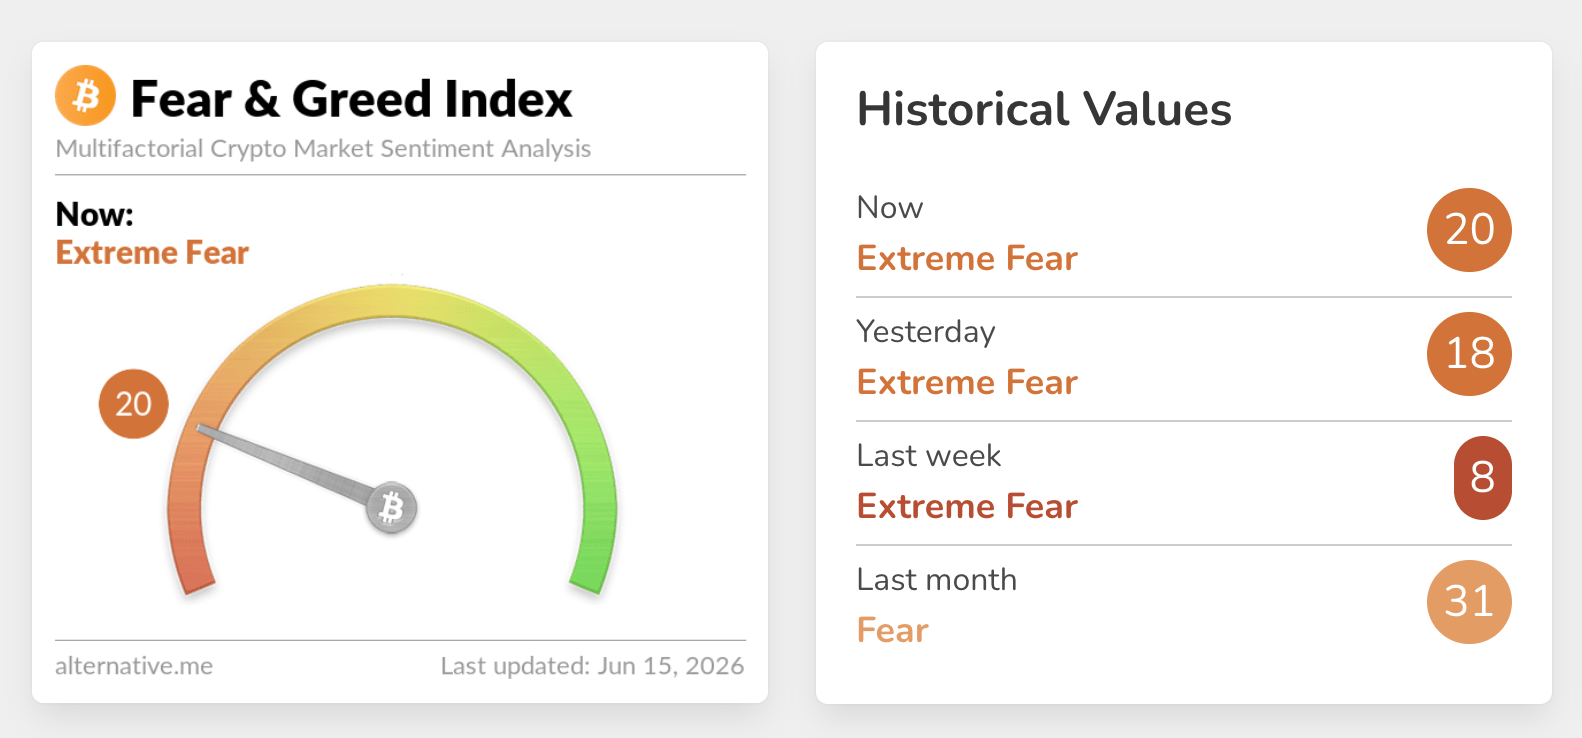
Crypto markets exhibit recovery strength as investors increase their appetite for risk assets. This is reflected in the crypto Fear & Greed Index, which climbed to 20 in the Extreme Fear territory on Monday, up from 18 the previous day and 8 the week before. If the risk-on mood steadily improves, demand will likely raise the odds of a sustained recovery with Bitcoin eyeing a break above $70,000, Ethereum $2,000 and XRP $2.00.
Price analysis: Bitcoin upholds modest rebound
Bitcoin trades at $65,762, keeping a bearish near-term tone as price holds below the 50-day, 100-day and 200-day Exponential Moving Averages (EMAs), which now stack as a layered cap from roughly $70,703 up to $78,755. The Parabolic SAR sits well below the spot price near $60,237, hinting at residual trend support.
Moreover, the Relative Strength Index (RSI) around 42 on the daily chart, reflects a modest recovery from oversold territory even as the Moving Average Convergence Divergence (MACD) histogram turns positive, suggesting improving momentum that still faces heavy overhead supply.
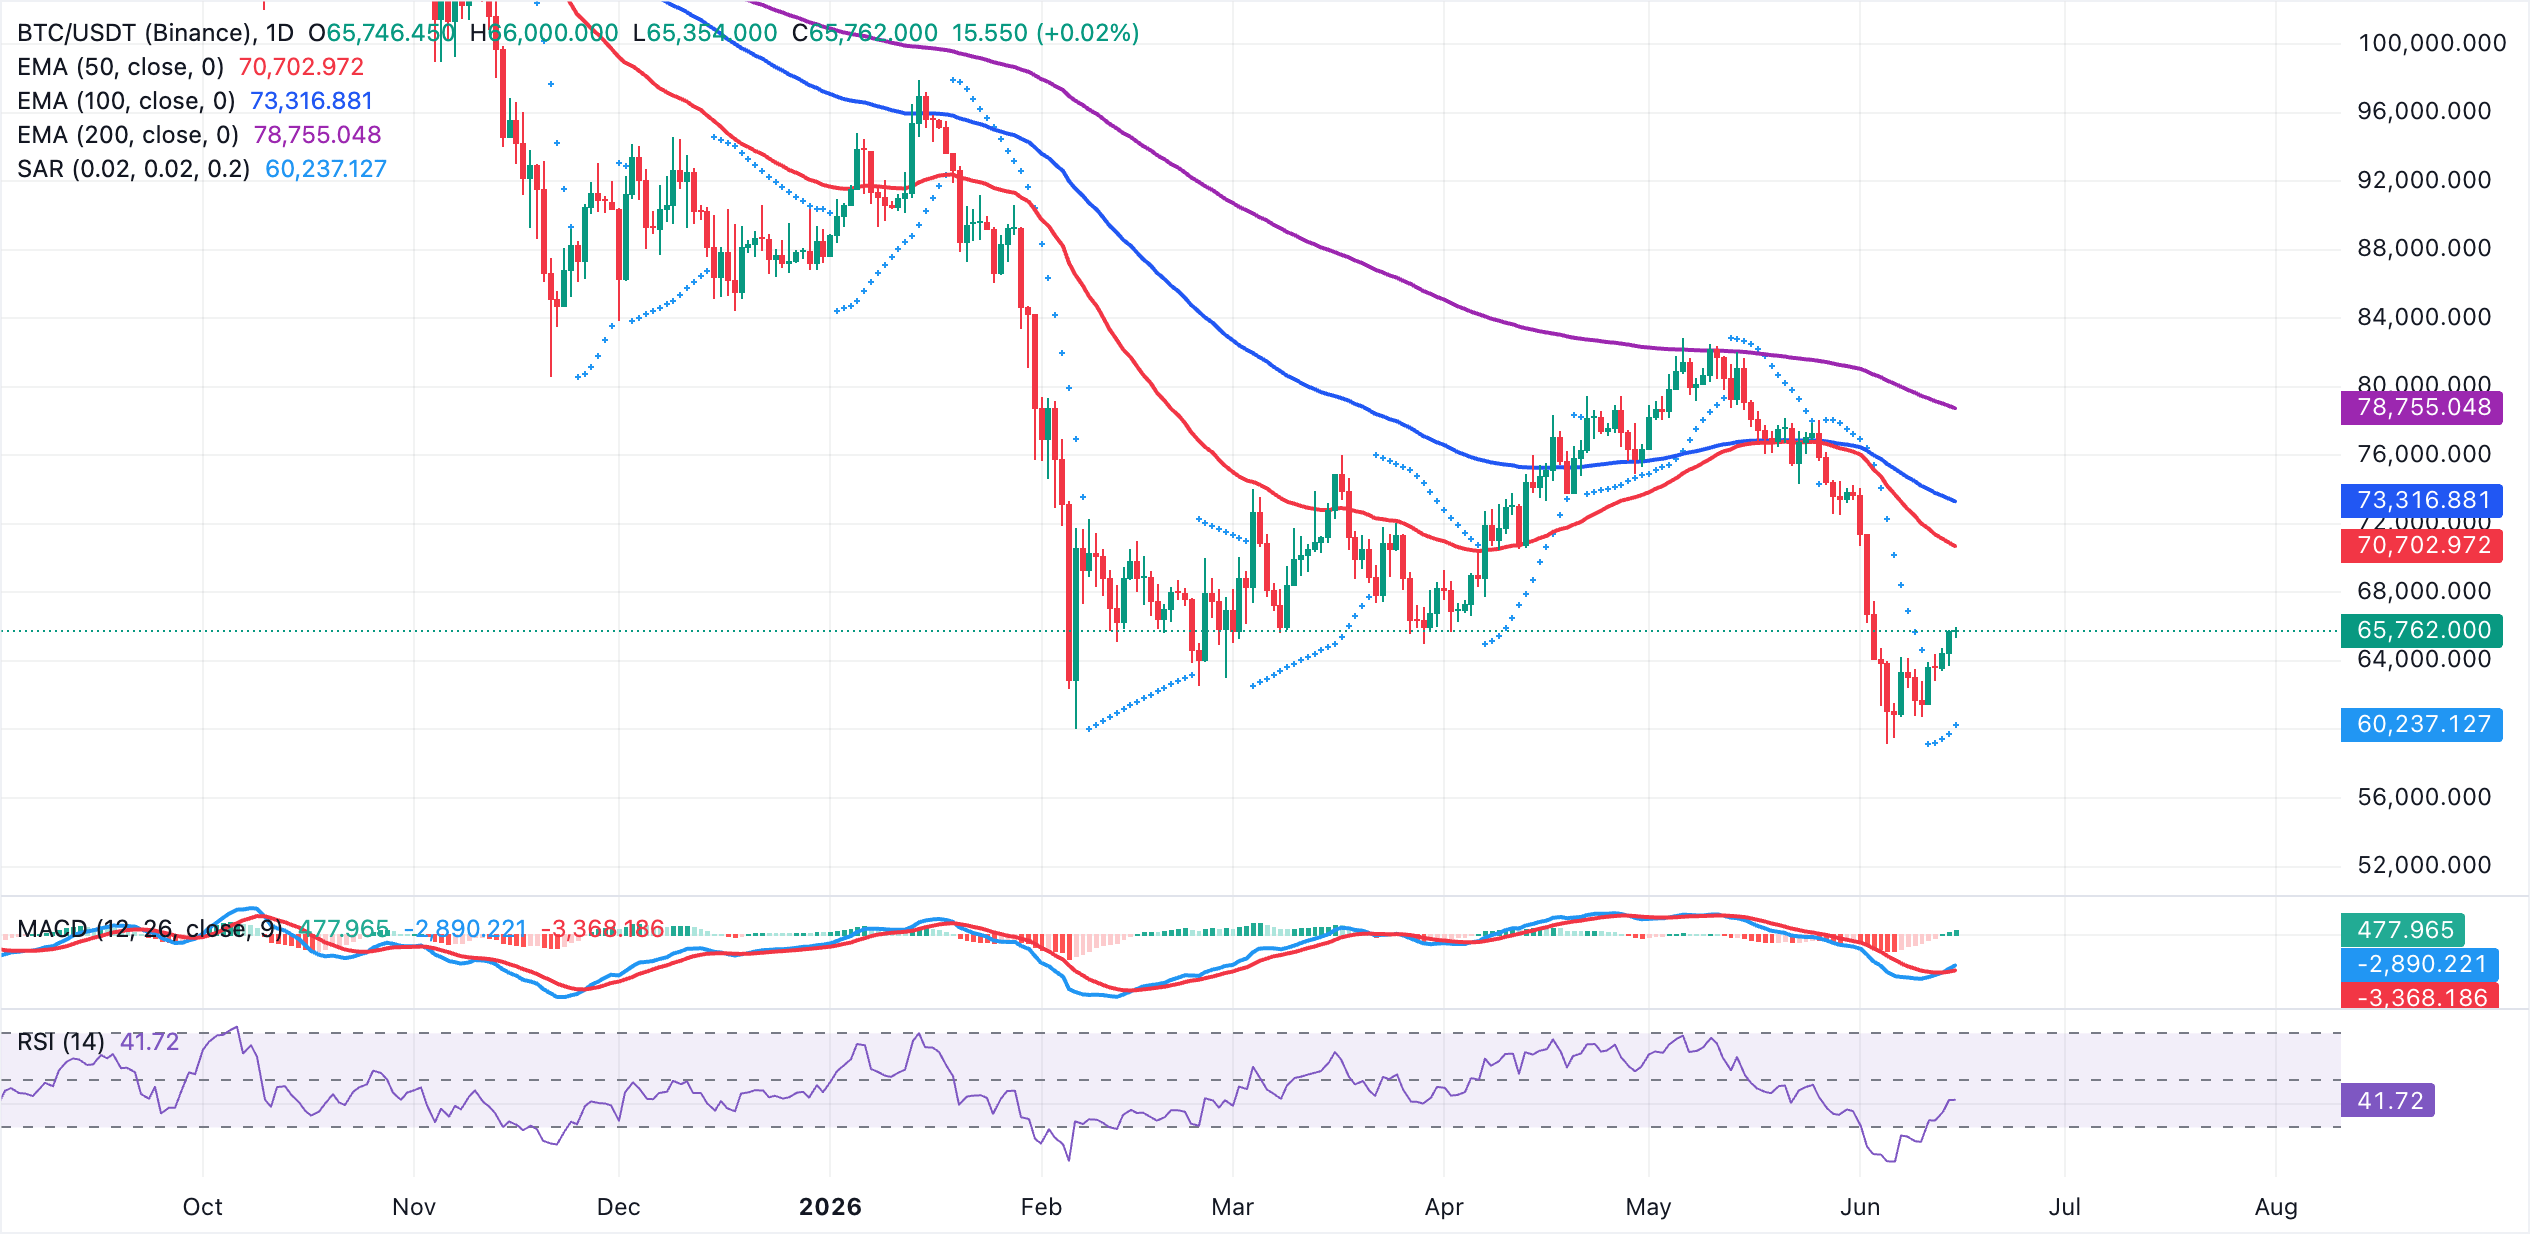
On the topside, initial resistance emerges at the 50-day EMA around $70,703, followed by the 100-day EMA near $73,317 and the 200-day EMA close to $78,755, a dense zone that would need to be reclaimed to ease the prevailing downside bias. On the downside, the first notable structural support from the current setup appears at the Parabolic SAR level near $60,237, where buyers may attempt to arrest a deeper pullback if the pair resumes its decline.
Altcoins technical outlook: Ethereum and XRP extend fragile upswing
Ethereum trades at $1,720 at the time of writing on Monday. The pair remains in a bearish near-term bias as price holds well below the 20-day Bollinger middle band around $1,790 and key moving averages. The 50-day EMA near $1,966, the 100-day EMA around $2,122 and the 200-day EMA close to $2,392 act as overhead supply.
Momentum is attempting to stabilize, with the MACD histogram turning modestly positive on the daily chart while the RSI hovers in the high-30s, suggesting a fragile recovery within a broader capped environment.
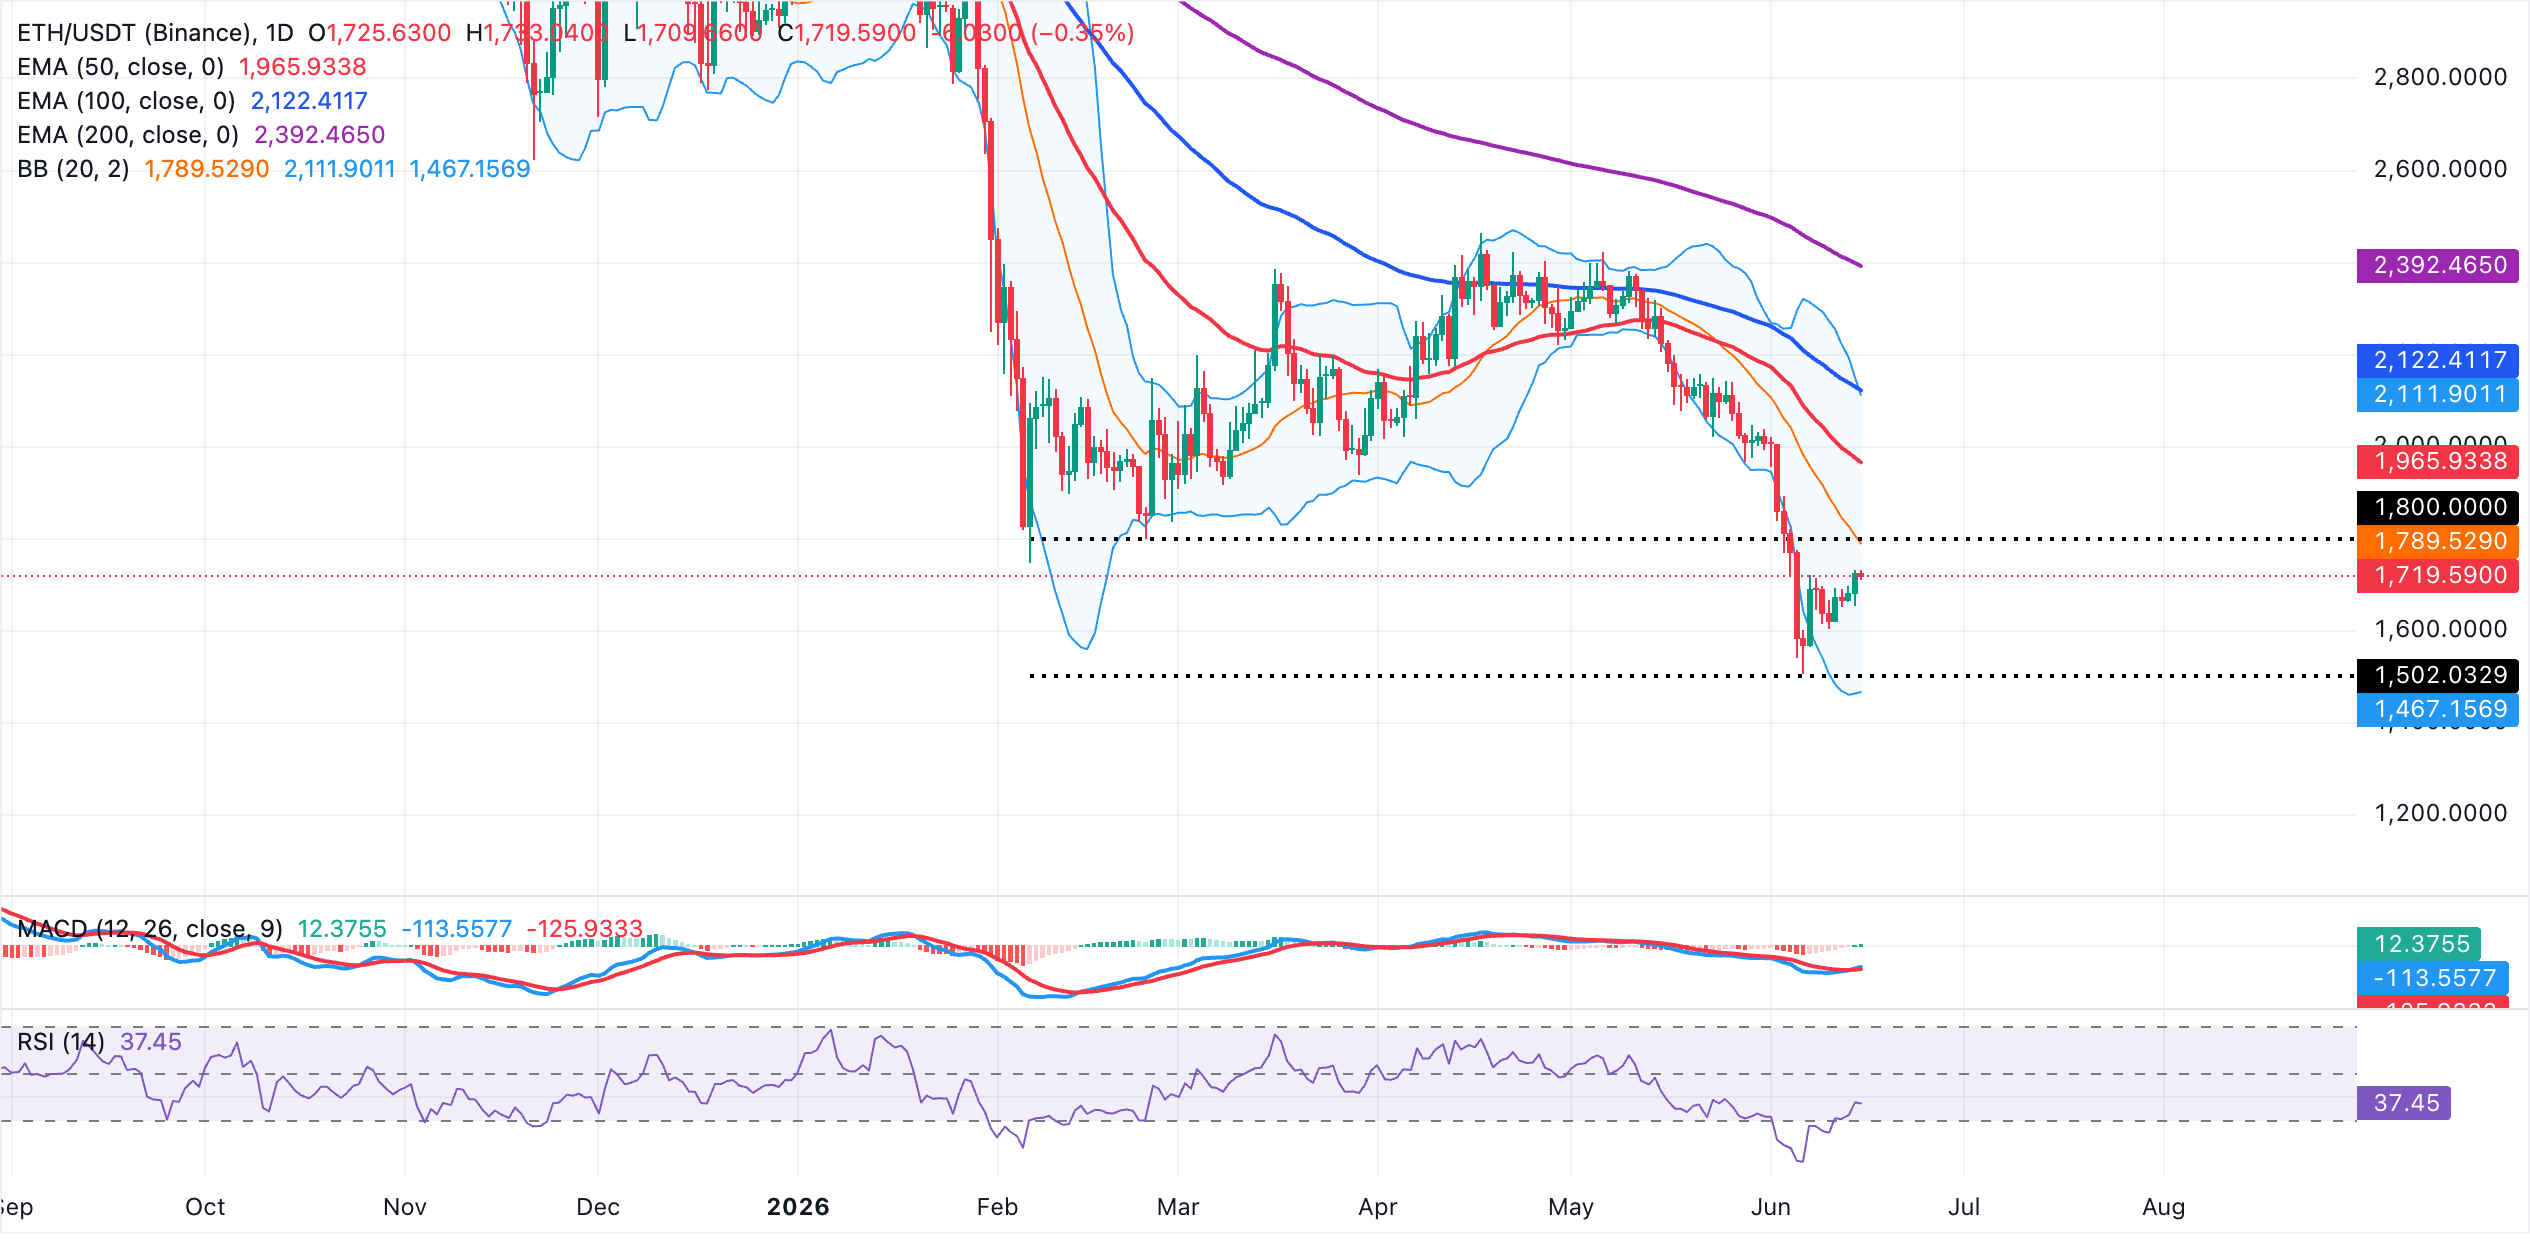
On the topside, initial resistance aligns with the Bollinger Bands' midline boundary roughly $1,790, followed by the 50-day EMA near $1,966 and the upper Bollinger band around $2,111 before stronger barriers emerge at the 100-day EMA at $2,122 and the 200-day EMA at $2,392. On the downside, the lower Bollinger band near $1,467 is the next notable support. A break beneath this floor would open the door to further downside extension despite the tentative improvement in MACD.
XRP, on the other hand, trades at $1.18. The pair remains capped in a bearish near-term bias, with price holding below the 20-day Bollinger Bands' middle boundary at roughly $1.20 and key moving averages, including the 50-day EMA at $1.28, the 100-day EMA near $1.38 and the 200-day EMA around $1.59.
While the MACD histogram has turned mildly positive on the daily chart, hinting at nascent recovery attempts, the RSI around 43 still sits below the neutral line, suggesting that rallies are more likely to face selling pressure beneath the prevailing overhead structure.
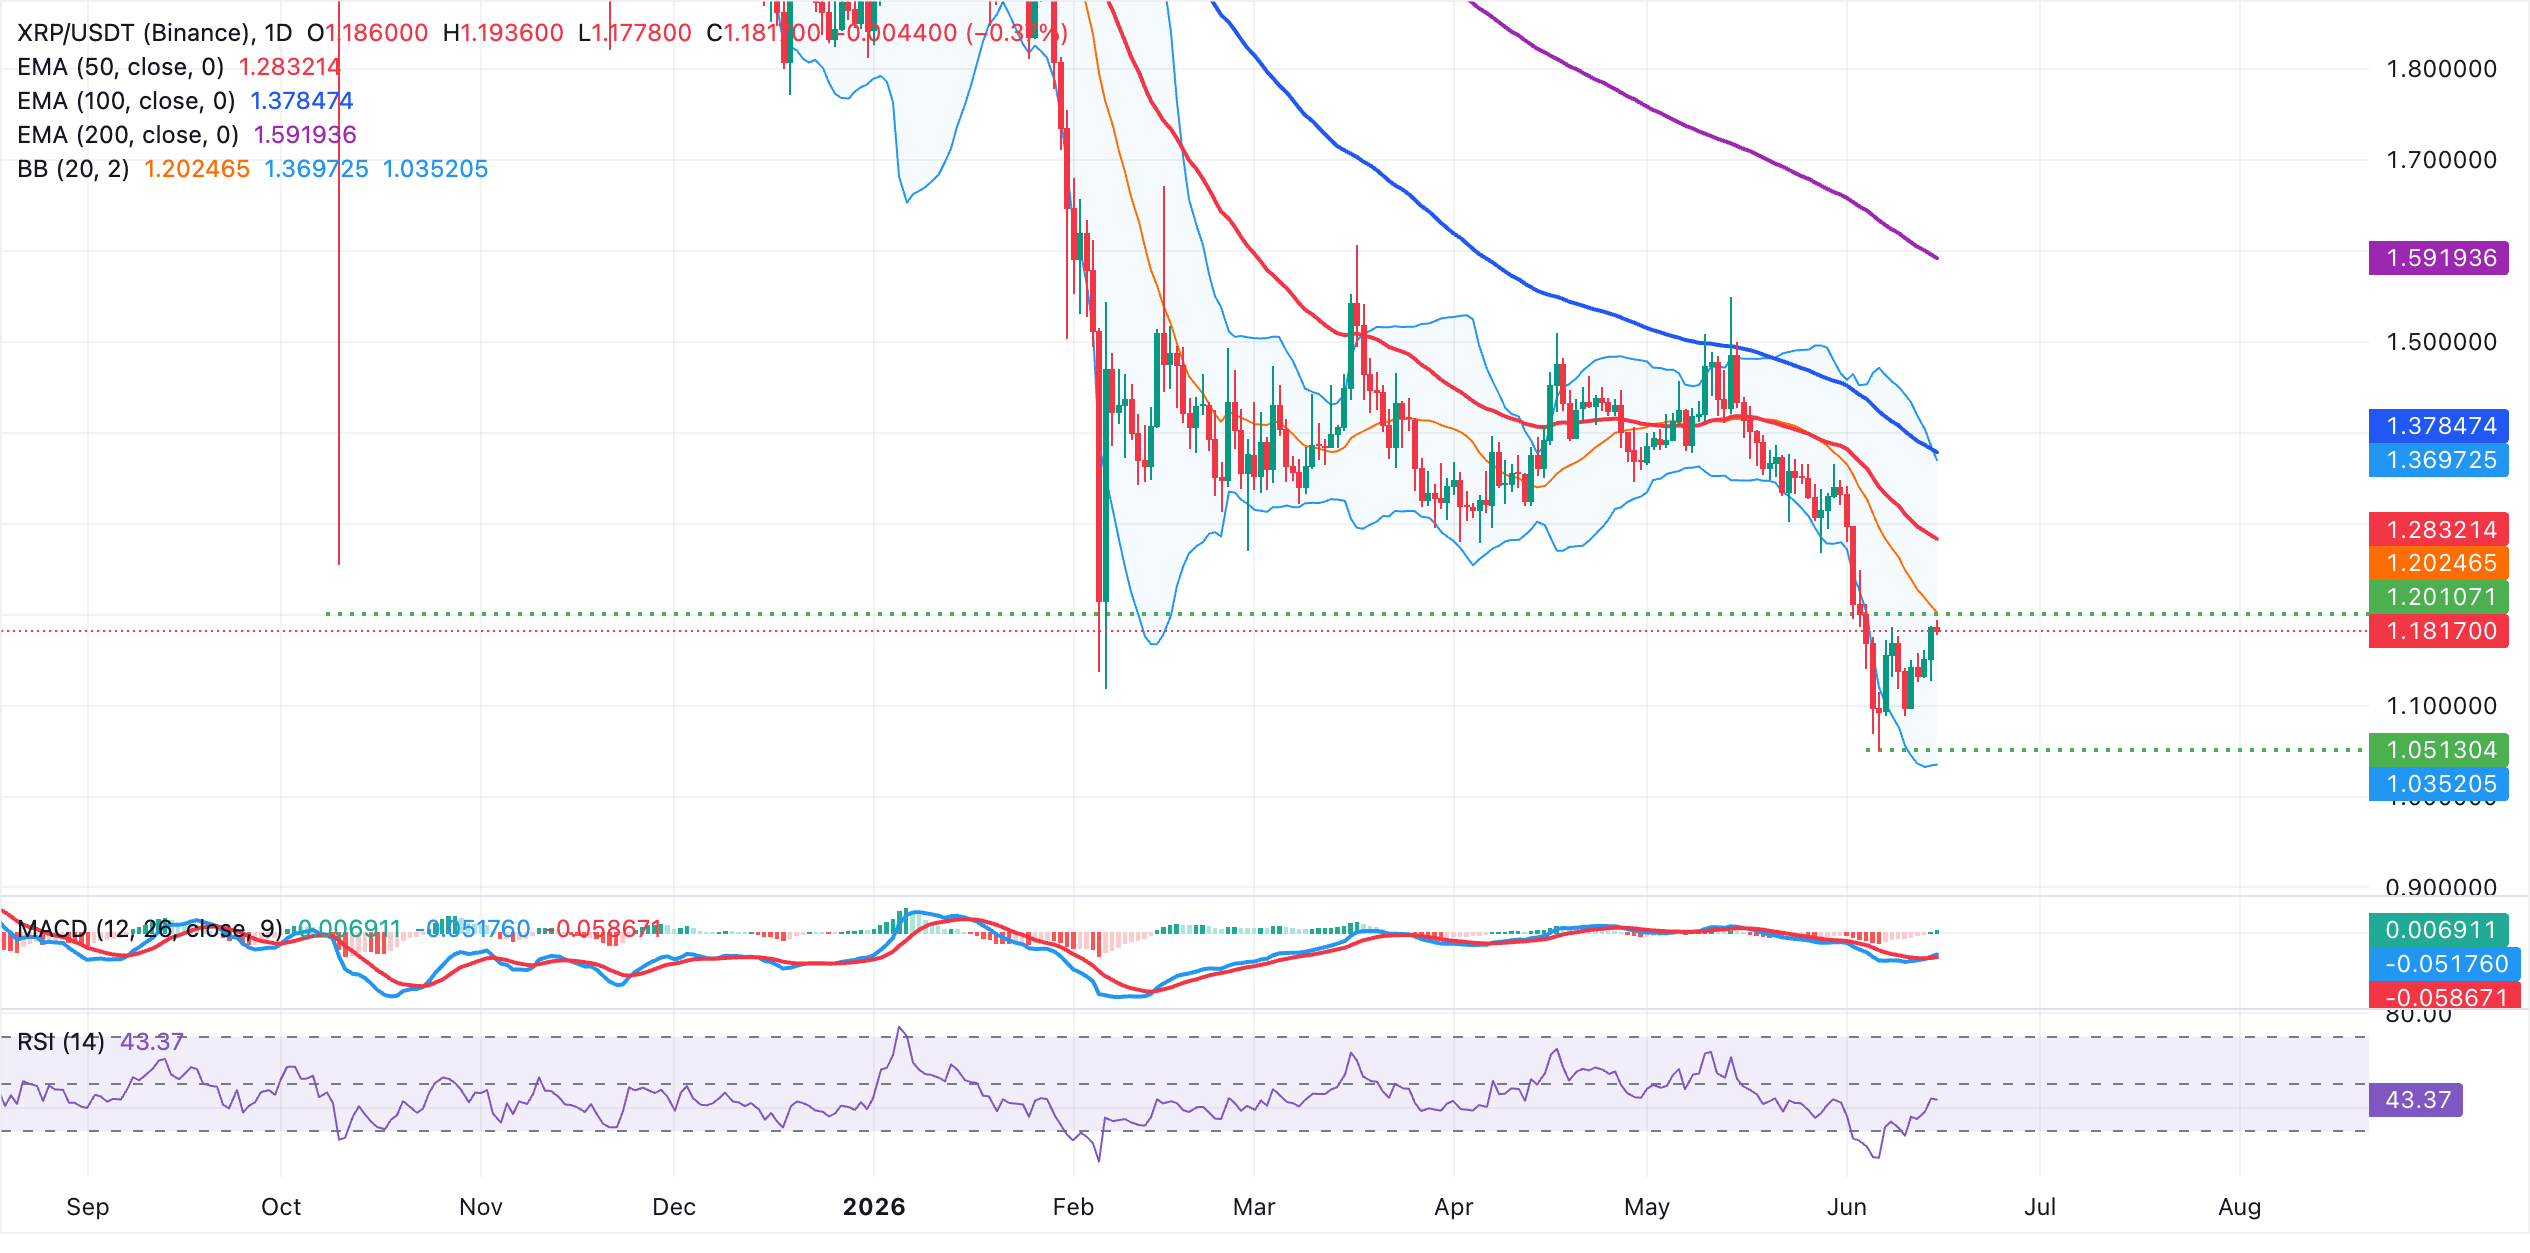
On the topside, initial resistance emerges at the Bollinger Bands' midline around $1.20, with a subsequent cap at the 50-day EMA near $1.28 if buyers extend a bounce. Further up, the upper Bollinger band around $1.37 aligns ahead of the 100-day EMA at $1.38, forming a broader supply zone before the longer-term 200-day EMA at $1.59. On the downside, the next notable support lies at the lower Bollinger band near $1.03, and the psychological demand at $1.00 where downside momentum could pause if the current decline resumes.
(The technical analysis of this story was written with the help of an AI tool.)
Bitcoin, altcoins, stablecoins FAQs
Bitcoin is the largest cryptocurrency by market capitalization, a virtual currency designed to serve as money. This form of payment cannot be controlled by any one person, group, or entity, which eliminates the need for third-party participation during financial transactions.
Altcoins are any cryptocurrency apart from Bitcoin, but some also regard Ethereum as a non-altcoin because it is from these two cryptocurrencies that forking happens. If this is true, then Litecoin is the first altcoin, forked from the Bitcoin protocol and, therefore, an “improved” version of it.
Stablecoins are cryptocurrencies designed to have a stable price, with their value backed by a reserve of the asset it represents. To achieve this, the value of any one stablecoin is pegged to a commodity or financial instrument, such as the US Dollar (USD), with its supply regulated by an algorithm or demand. The main goal of stablecoins is to provide an on/off-ramp for investors willing to trade and invest in cryptocurrencies. Stablecoins also allow investors to store value since cryptocurrencies, in general, are subject to volatility.
Bitcoin dominance is the ratio of Bitcoin's market capitalization to the total market capitalization of all cryptocurrencies combined. It provides a clear picture of Bitcoin’s interest among investors. A high BTC dominance typically happens before and during a bull run, in which investors resort to investing in relatively stable and high market capitalization cryptocurrency like Bitcoin. A drop in BTC dominance usually means that investors are moving their capital and/or profits to altcoins in a quest for higher returns, which usually triggers an explosion of altcoin rallies.

100만 명이 넘는 사용자가 FXStreet를 통해 실시간 시장 데이터, 차트 도구, 전문가 인사이트, 포렉스 뉴스를 이용합니다. 포괄적인 경제 캘린더와 교육 웨비나는 트레이더가 정보를 유지하고 신중한 결정을 내리도록 돕습니다. FXStreet는 바르셀로나 본사와 전 세계 지역에 걸쳐 약 60명의 팀으로 구성되어 있습니다.
더 읽기


