
Crypto Today: Bitcoin, Ethereum, XRP recovery slows amid incessant capital outflows
작성자 John Isige
수정됨: 12 Jun 2026


인기 기사

The cryptocurrency remains in a broader corrective bias on Friday, despite majors such as Bitcoin (BTC), Ethereum (ETH), and Ripple (XRP) holding slightly higher than early-week support levels. Bitcoin hovers around $63,500 amid a capped upside.
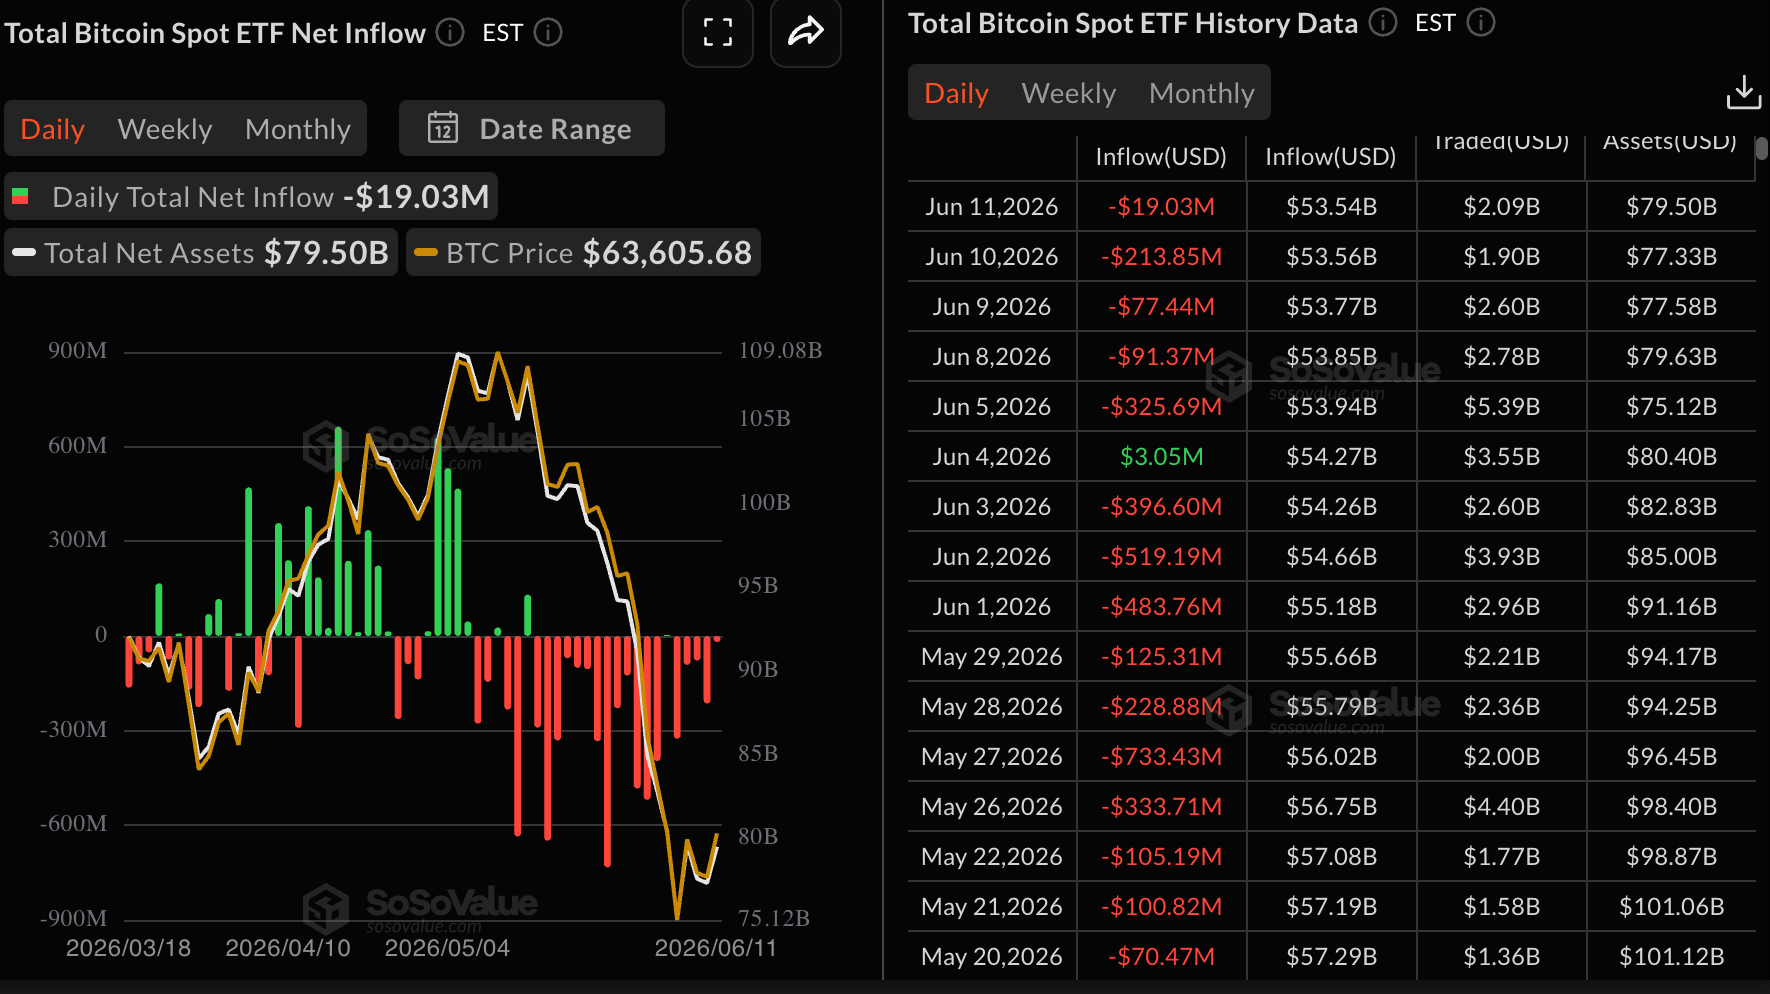
- Bitcoin trades around $63,500 as its rebound stalls amid five consecutive days of ETF outflows.
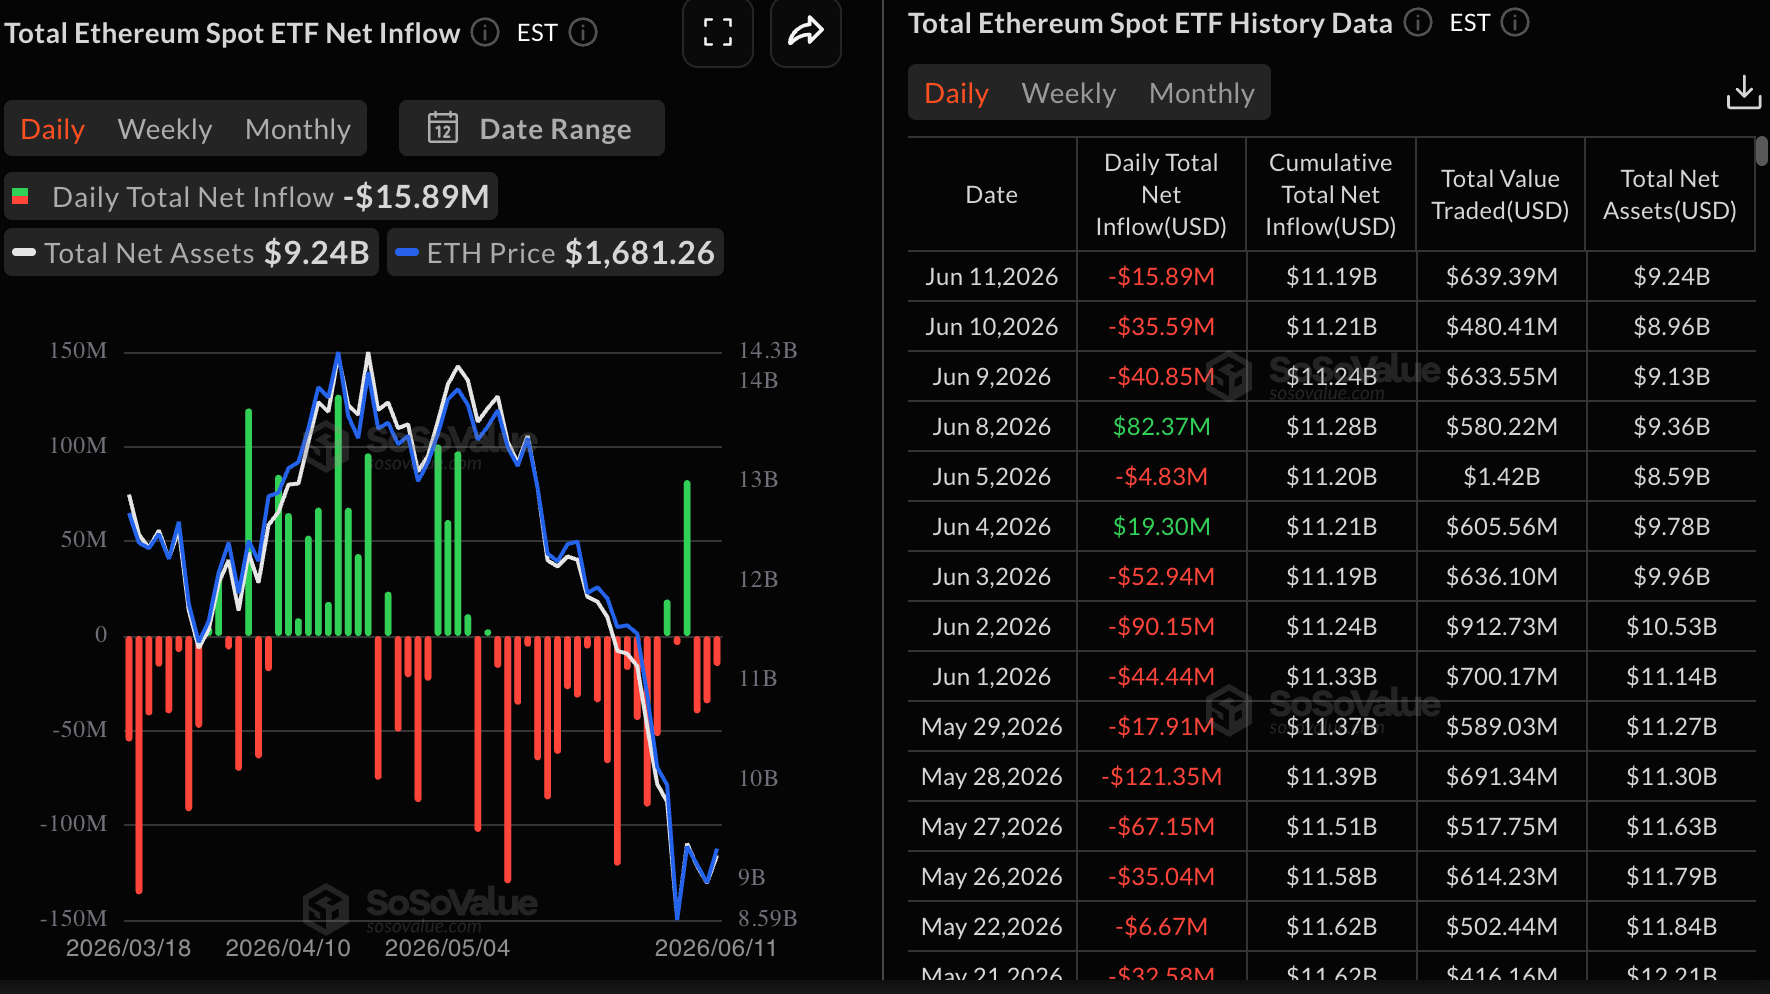
- Ethereum shows signs of recovery but remains below the $1,700 psychological resistance amid persistent risk-off sentiment.
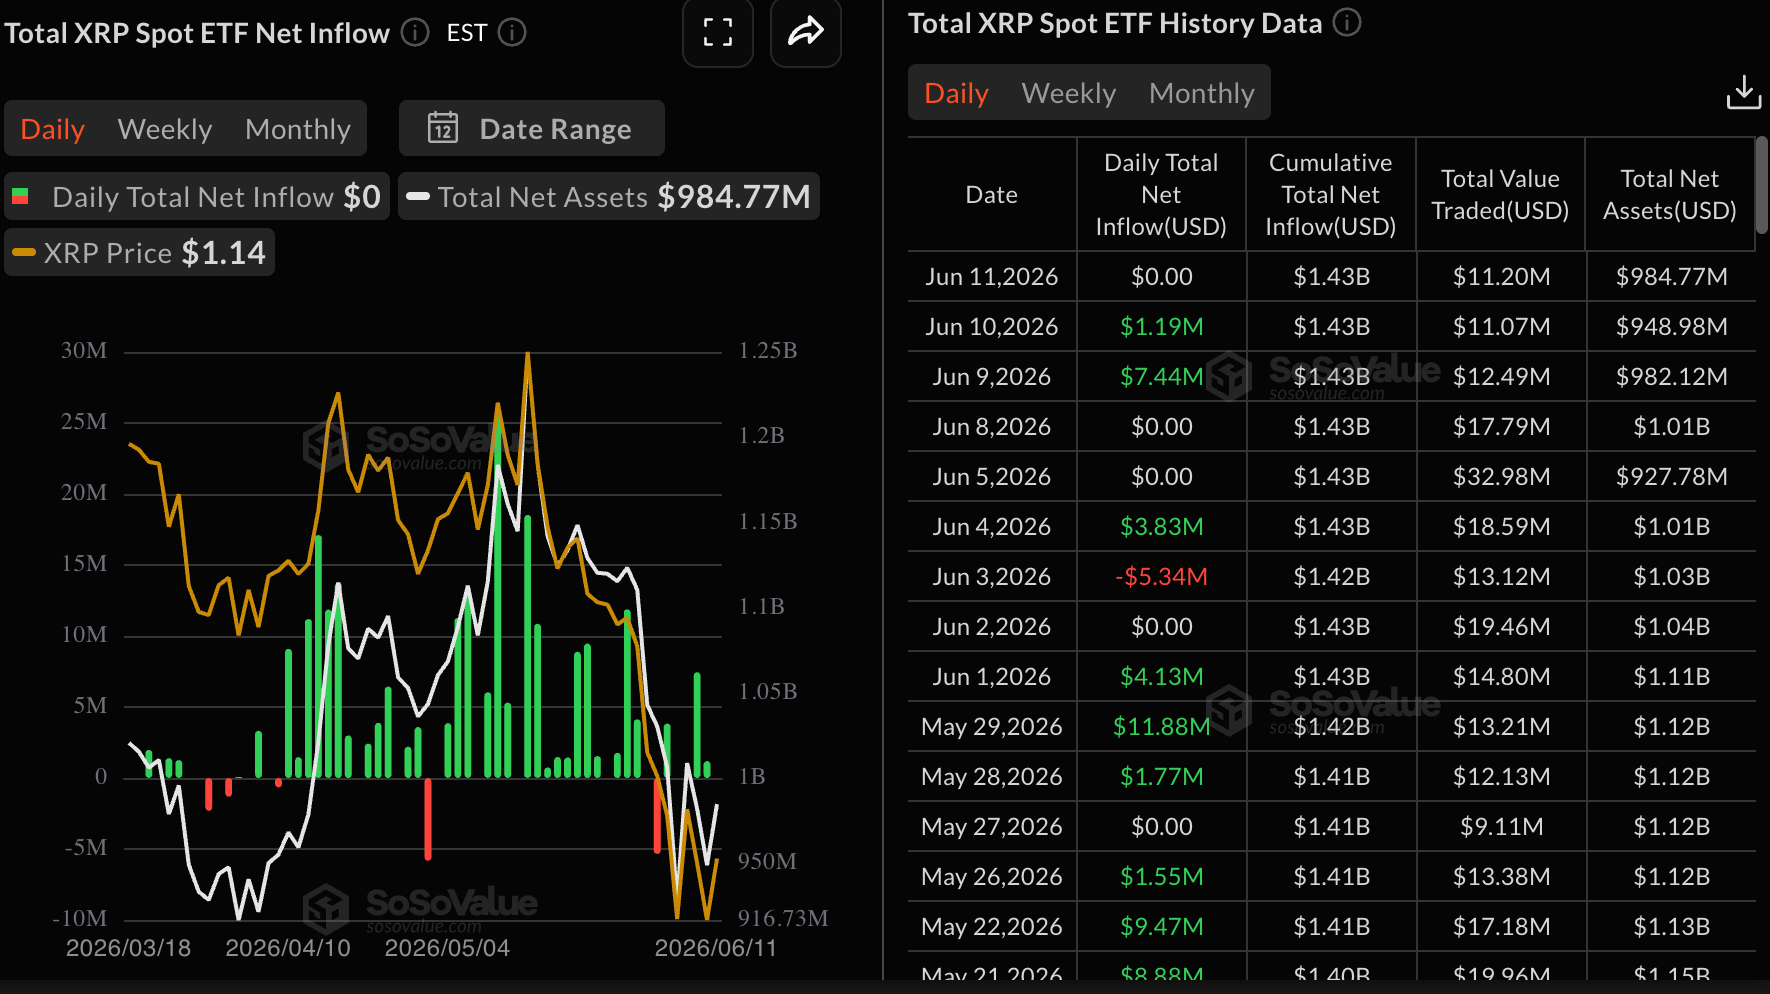
- XRP holds onto support at $1.14, remaining below major moving averages and the dynamic SuperTrend line resistance.
The cryptocurrency remains in a broader corrective bias on Friday, despite majors such as Bitcoin (BTC), Ethereum (ETH), and Ripple (XRP) holding slightly higher than early-week support levels. Bitcoin hovers around $63,500 amid a capped upside. Ethereum eyes a breakout past $1,700, while XRP hovers above $1.40.
Institutional selling persists amid ETF outflows
Bitcoin spot Exchange-Traded Funds (ETFs) saw five days of outflows totaling $19 million on Thursday, suggesting that risk-off remains sticky in the broader crypto market. Cumulative outflows now stand at $53.54 billion, down from $55.18 billion recorded on June 1, while net assets under management average $79.50 billion, falling from $91.18 billion in the same period. Continued selling among institutions weighs on sentiment, reducing the odds of a steady uptrend.
Ethereum spot ETFs extended their bearish streak for the third consecutive day, with outflows totaling $16 million on Thursday. SoSoValue data shows nearly $41 million in outflows on Tuesday and approximately $36 million on Wednesday, undermining risk appetite for related digital investment products. Cumulative inflows average $11.19 million while net assets stand at $9.24 million.
Meanwhile, demand for XRP spot ETFs remained quiet, with zero flows recorded on Thursday, leaving cumulative inflows steady at $1.43 billion and net assets under management at $985 million. Sustained demand for spot ETFs is critical for supporting a broader recovery.
Price analysis: Bitcoin pares short-term gains
Bitcoin trades at $63,471, retaining a bearish near-term bias as it holds decisively below all key Exponential Moving Averages (EMA). The 50-day EMA at $71,383, the 100-day EMA at $73,811, and the 200-day EMA at $79,062 all sit well overhead, suggesting rallies are likely to meet supply rather than extend the uptrend, while the SuperTrend line at $68,416 reinforces a cap above spot.
Momentum remains fragile, with the Relative Strength Index (RSI) hovering near 33 on the daily chart and recovering only slowly from oversold territory, and the Moving Average Convergence Divergence (MACD) histogram still negative despite contracting downside pressure.
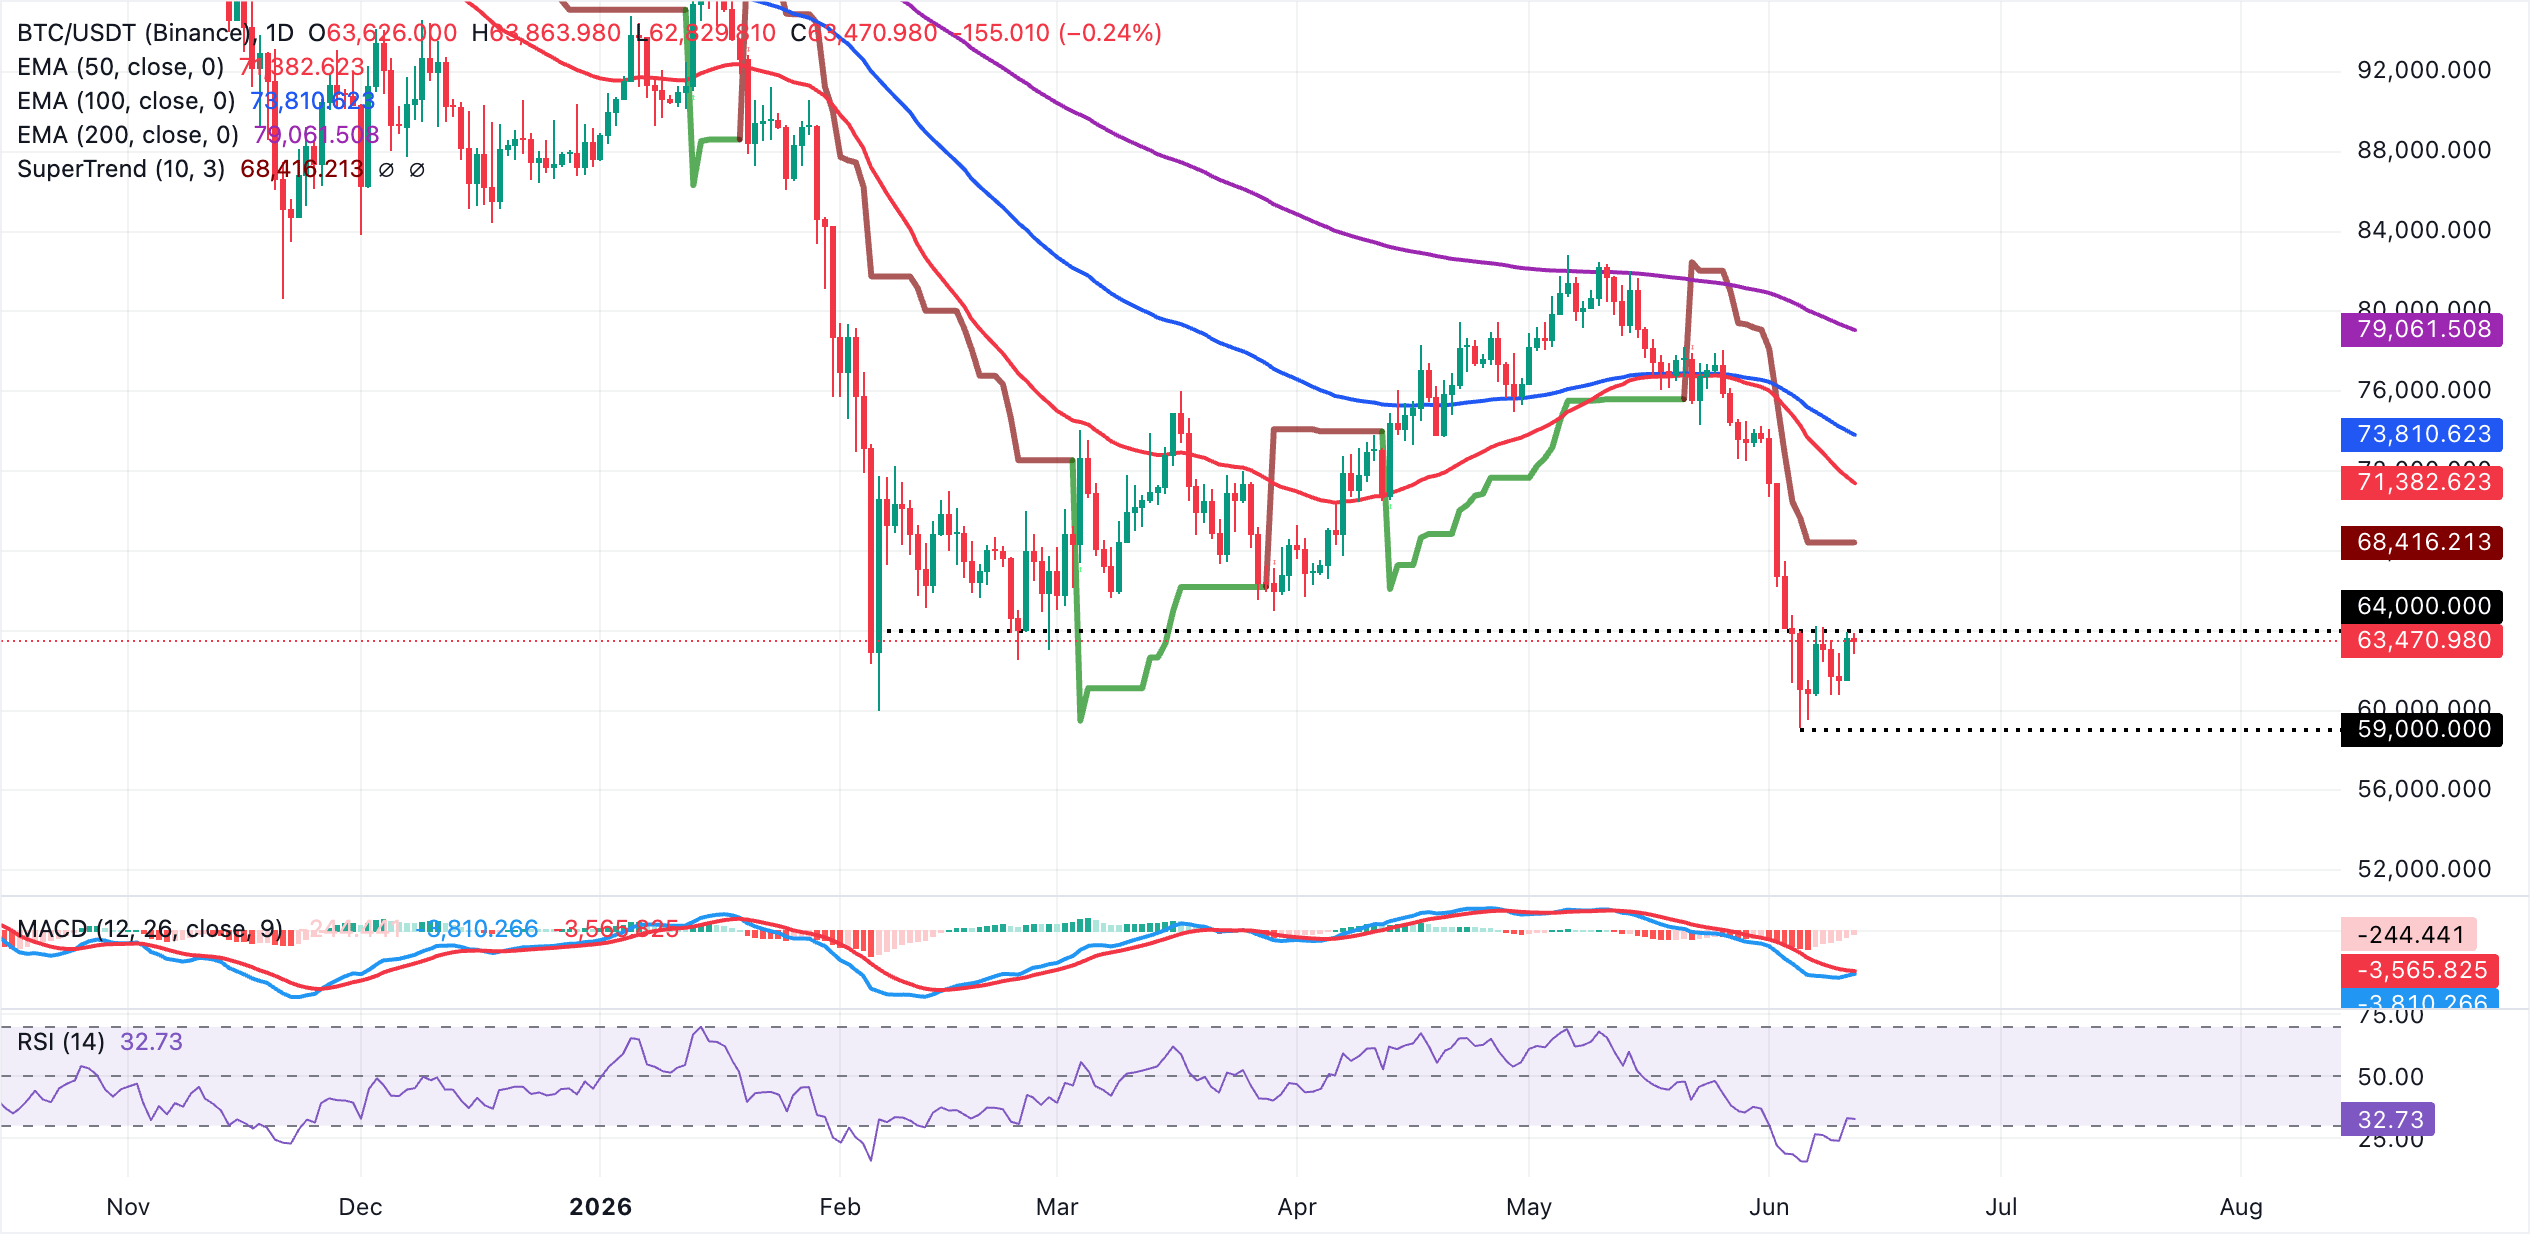
On the topside, initial resistance lies at the SuperTrend barrier near $68,416, ahead of the 50-day EMA around $71,383 and the 100-day EMA at roughly $73,811. A daily close above this cluster would be needed to ease immediate downside pressure, while the 200-day EMA near $79,062 marks a more strategic hurdle.
On the downside, immediate focus stays on recent lows around $61,056 and $60,885 as the next probable demand zones. A break beneath that band would expose deeper retracement and keep BTC anchored in a corrective phase despite any short-lived oversold bounces.
Altcoins technical outlook: Ethereum and XRP remain under a broader bearish outlook
Ethereum trades at $1,673, keeping a clear bearish near-term bias as price holds well below the 50-day, 100-day and 200-day EMAs. The nearest dynamic cap emerges from the SuperTrend line at $1,850, with additional supply reinforced by the 50-day EMA at $1,999 and the 100-day EMA at $2,148, framing a broad overhead resistance band.
Momentum remains fragile, with the MACD histogram still negative on the daily chart and the RSI hovering just above oversold territory near 31, which hints at persistent downside pressure despite a risk of short-lived corrective bounces.
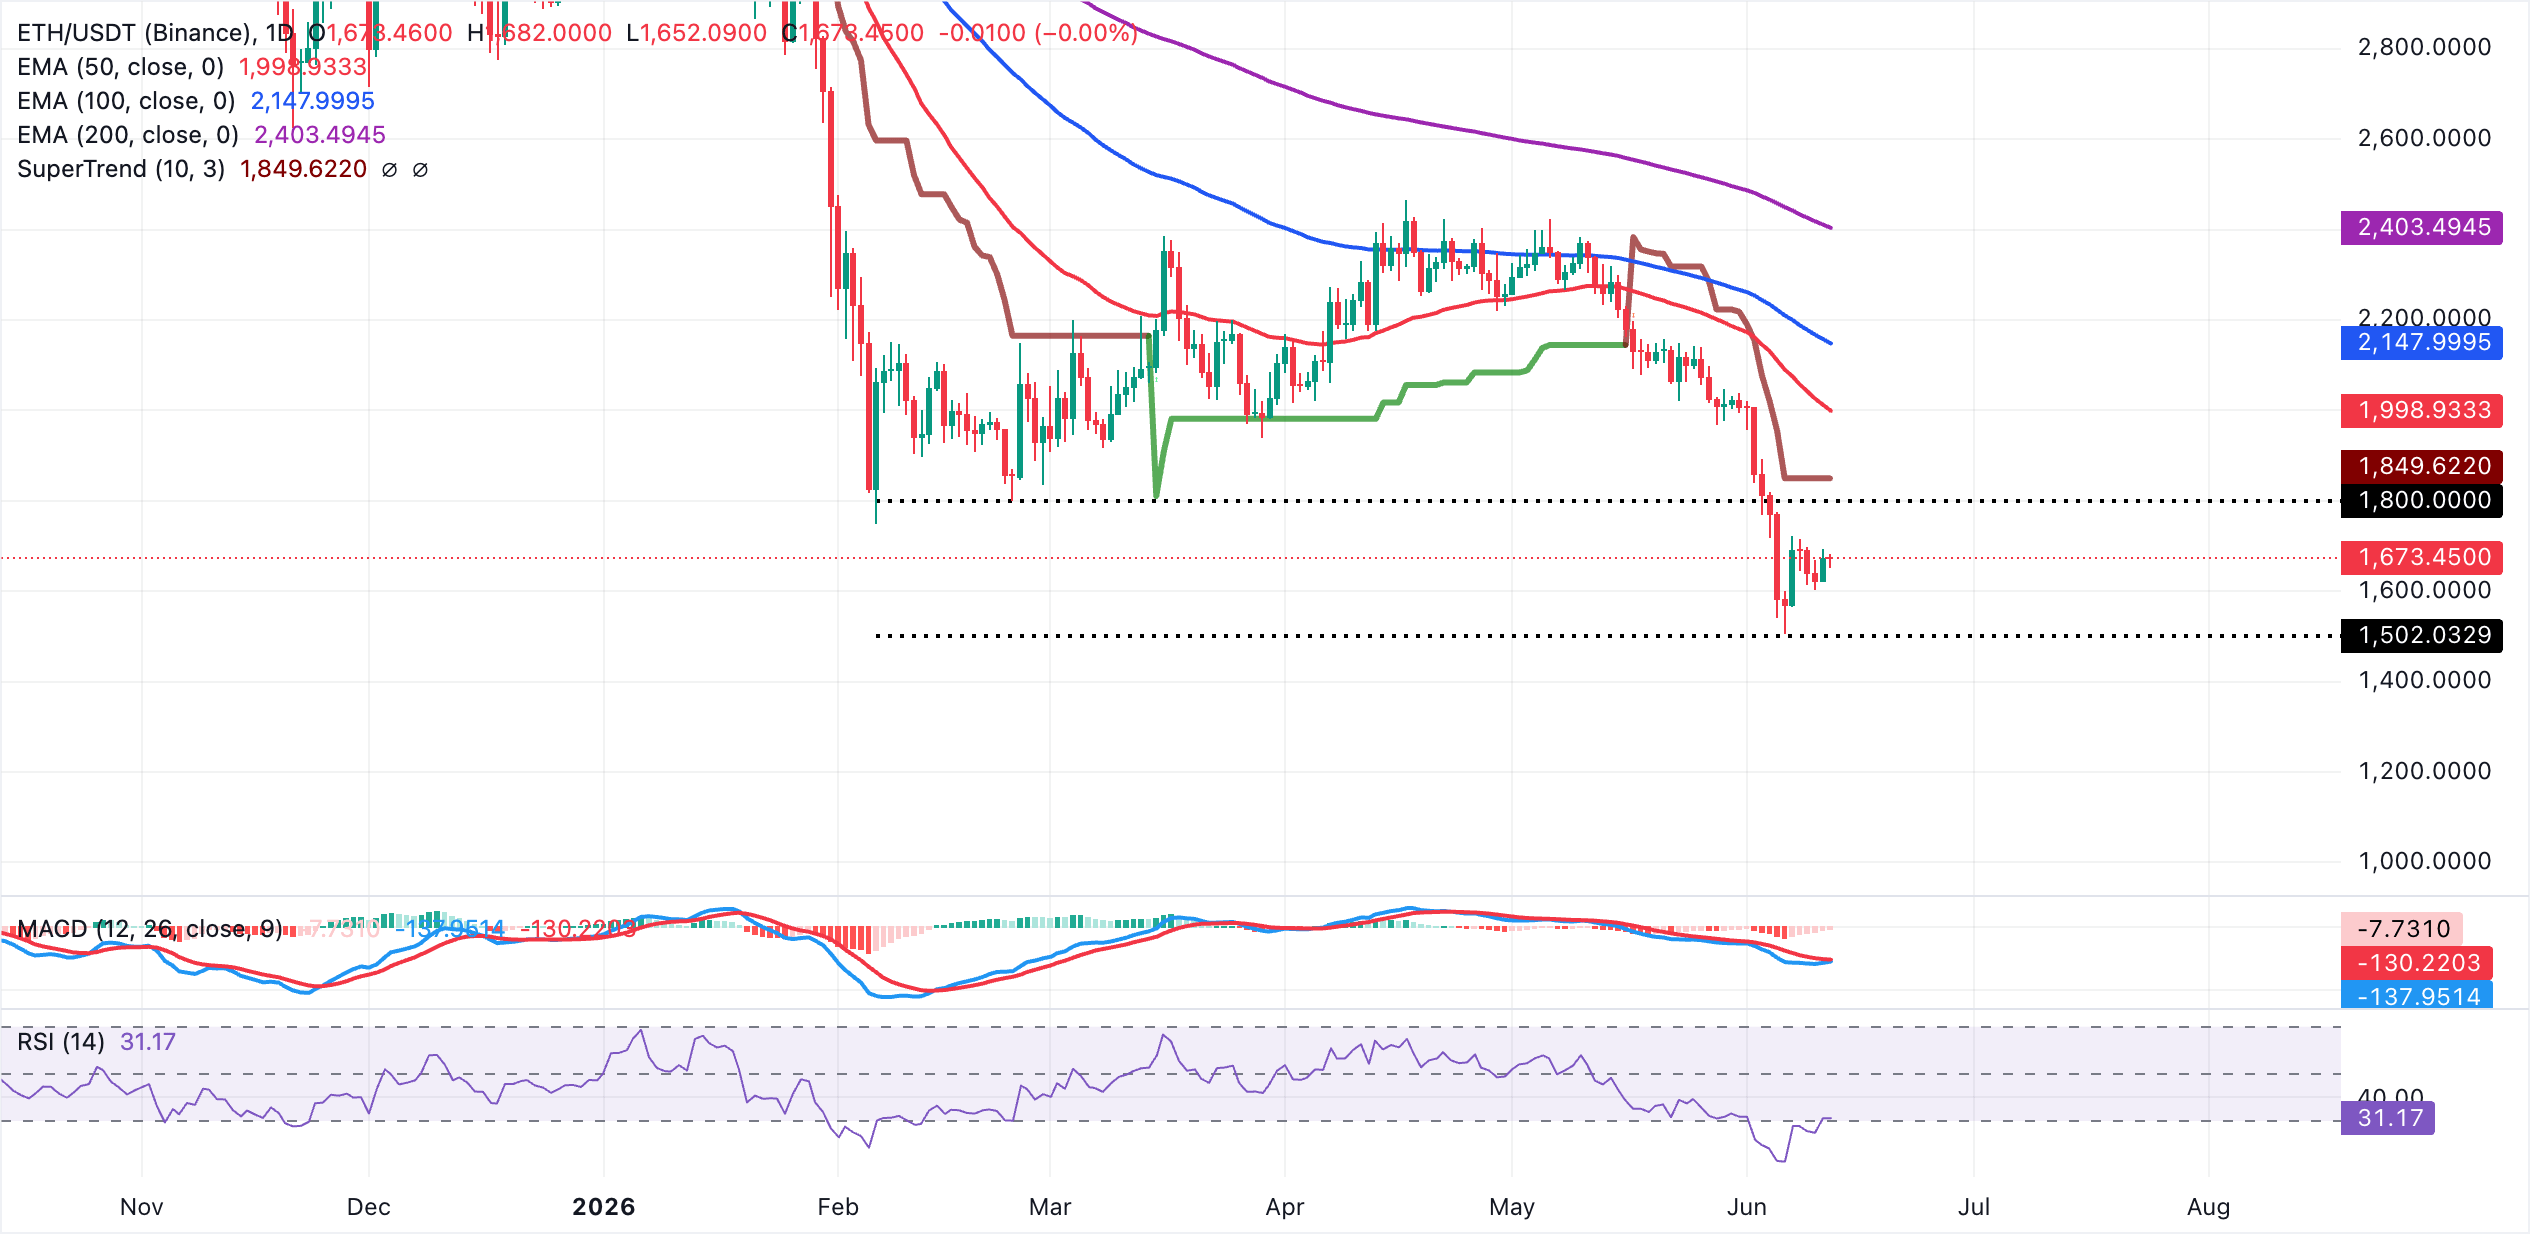
On the topside, immediate resistance is seen at the SuperTrend barrier around $1,850, ahead of the 50-day EMA at $1,999 and the 100-day EMA at $2,148, levels that would need to be reclaimed to ease the current bearish tone.
A more durable shift in structure would only be suggested if buyers manage to advance the price back toward the 200-day EMA at $2,403, while failure to challenge these successive caps keeps ETH vulnerable to further weakness, with traders forced to infer support from prior lows rather than any nearby technical floor in the present dataset.
XRP, on the other hand, trades at $1.14. The pair remains under clear bearish pressure as price holds beneath the SuperTrend line at $1.26 and all the key moving averages (50-day EMA at $1.30, 100-day EMA at $1.39 and 200-day EMA at $1.61), keeping the broader trend capped from above.
Momentum remains weak, with the RSI hovering in the mid-30s and the MACD histogram still negative, which together suggest that any rebounds are likely to struggle while these overhead levels remain intact.
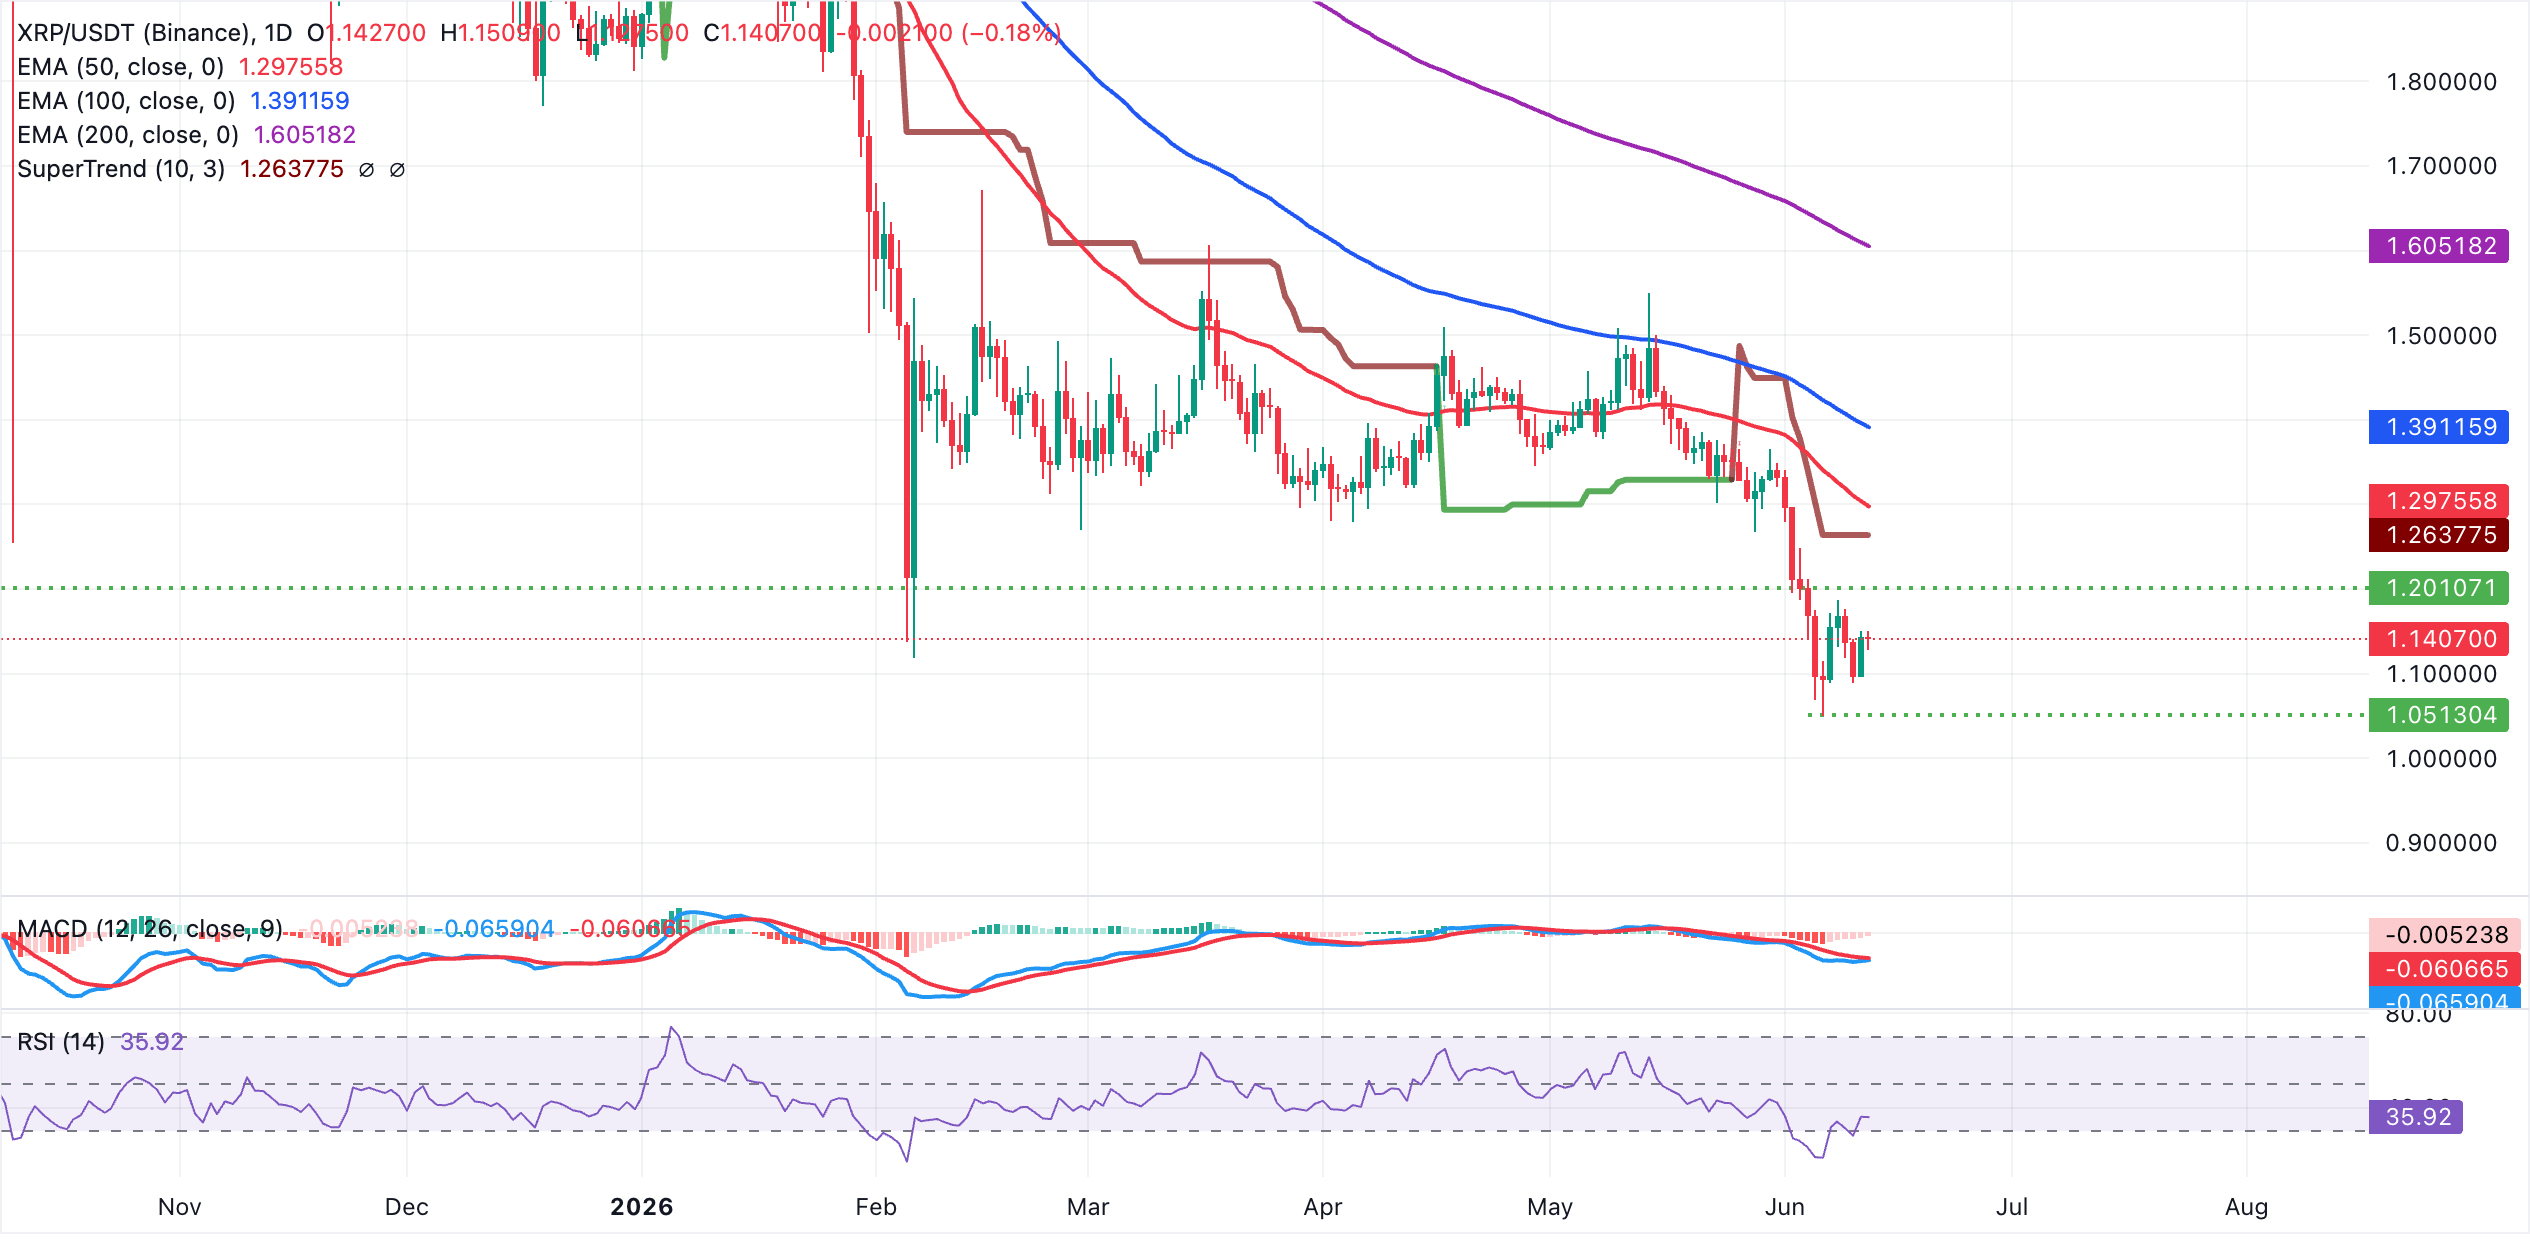
On the topside, initial resistance is aligned at the SuperTrend barrier near $1.26, with the 50-day EMA at $1.30 adding to selling pressure slightly higher up. A sustained break above there would expose the next resistance layers at the 100-day EMA around $1.39 and then the more strategic 200-day EMA at $1.60. With no clear structural supports derived from the provided indicators, the next support levels are recent lows and psychological levels at $1.05, and $1.00.
(The technical analysis of this story was written with the help of an AI tool.)
Crypto ETF FAQs
An Exchange-Traded Fund (ETF) is an investment vehicle or an index that tracks the price of an underlying asset. ETFs can not only track a single asset, but a group of assets and sectors. For example, a Bitcoin ETF tracks Bitcoin’s price. ETF is a tool used by investors to gain exposure to a certain asset.
Yes. The first Bitcoin futures ETF in the US was approved by the US Securities & Exchange Commission in October 2021. A total of seven Bitcoin futures ETFs have been approved, with more than 20 still waiting for the regulator’s permission. The SEC says that the cryptocurrency industry is new and subject to manipulation, which is why it has been delaying crypto-related futures ETFs for the last few years.
Yes. The SEC approved in January 2024 the listing and trading of several Bitcoin spot Exchange-Traded Funds, opening the door to institutional capital and mainstream investors to trade the main crypto currency. The decision was hailed by the industry as a game changer.
The main advantage of crypto ETFs is the possibility of gaining exposure to a cryptocurrency without ownership, reducing the risk and cost of holding the asset. Other pros are a lower learning curve and higher security for investors since ETFs take charge of securing the underlying asset holdings. As for the main drawbacks, the main one is that as an investor you can’t have direct ownership of the asset, or, as they say in crypto, “not your keys, not your coins.” Other disadvantages are higher costs associated with holding crypto since ETFs charge fees for active management. Finally, even though investing in ETFs reduces the risk of holding an asset, price swings in the underlying cryptocurrency are likely to be reflected in the investment vehicle too.

100만 명이 넘는 사용자가 FXStreet를 통해 실시간 시장 데이터, 차트 도구, 전문가 인사이트, 포렉스 뉴스를 이용합니다. 포괄적인 경제 캘린더와 교육 웨비나는 트레이더가 정보를 유지하고 신중한 결정을 내리도록 돕습니다. FXStreet는 바르셀로나 본사와 전 세계 지역에 걸쳐 약 60명의 팀으로 구성되어 있습니다.
더 읽기


