

Crypto Today: Bitcoin, Ethereum, XRP run into resistance as retail buying cools
- Bitcoin falls toward $64,000, pressured by a weak technical outlook and softening retail demand.
- Ethereum bulls take a breath, following an early-week rally that stalled at the 100-day EMA.
- XRP extends its consolidation above the reclaimed $1.10 support as futures Open Interest steadies around 2.2 billion XRP.
Cryptocurrencies are broadly consolidating on Thursday, while Bitcoin (BTC) retreats toward support at $64,000. Ethereum (ETH) hovers below $1,800, with its upside seemingly limited, following a macro-driven rally. Meanwhile, Ripple (XRP) sits on top of the reclaimed $1.10 support, reflecting the broader cool-down in the market.

Retail interest softens, weighing on broader market sentiment
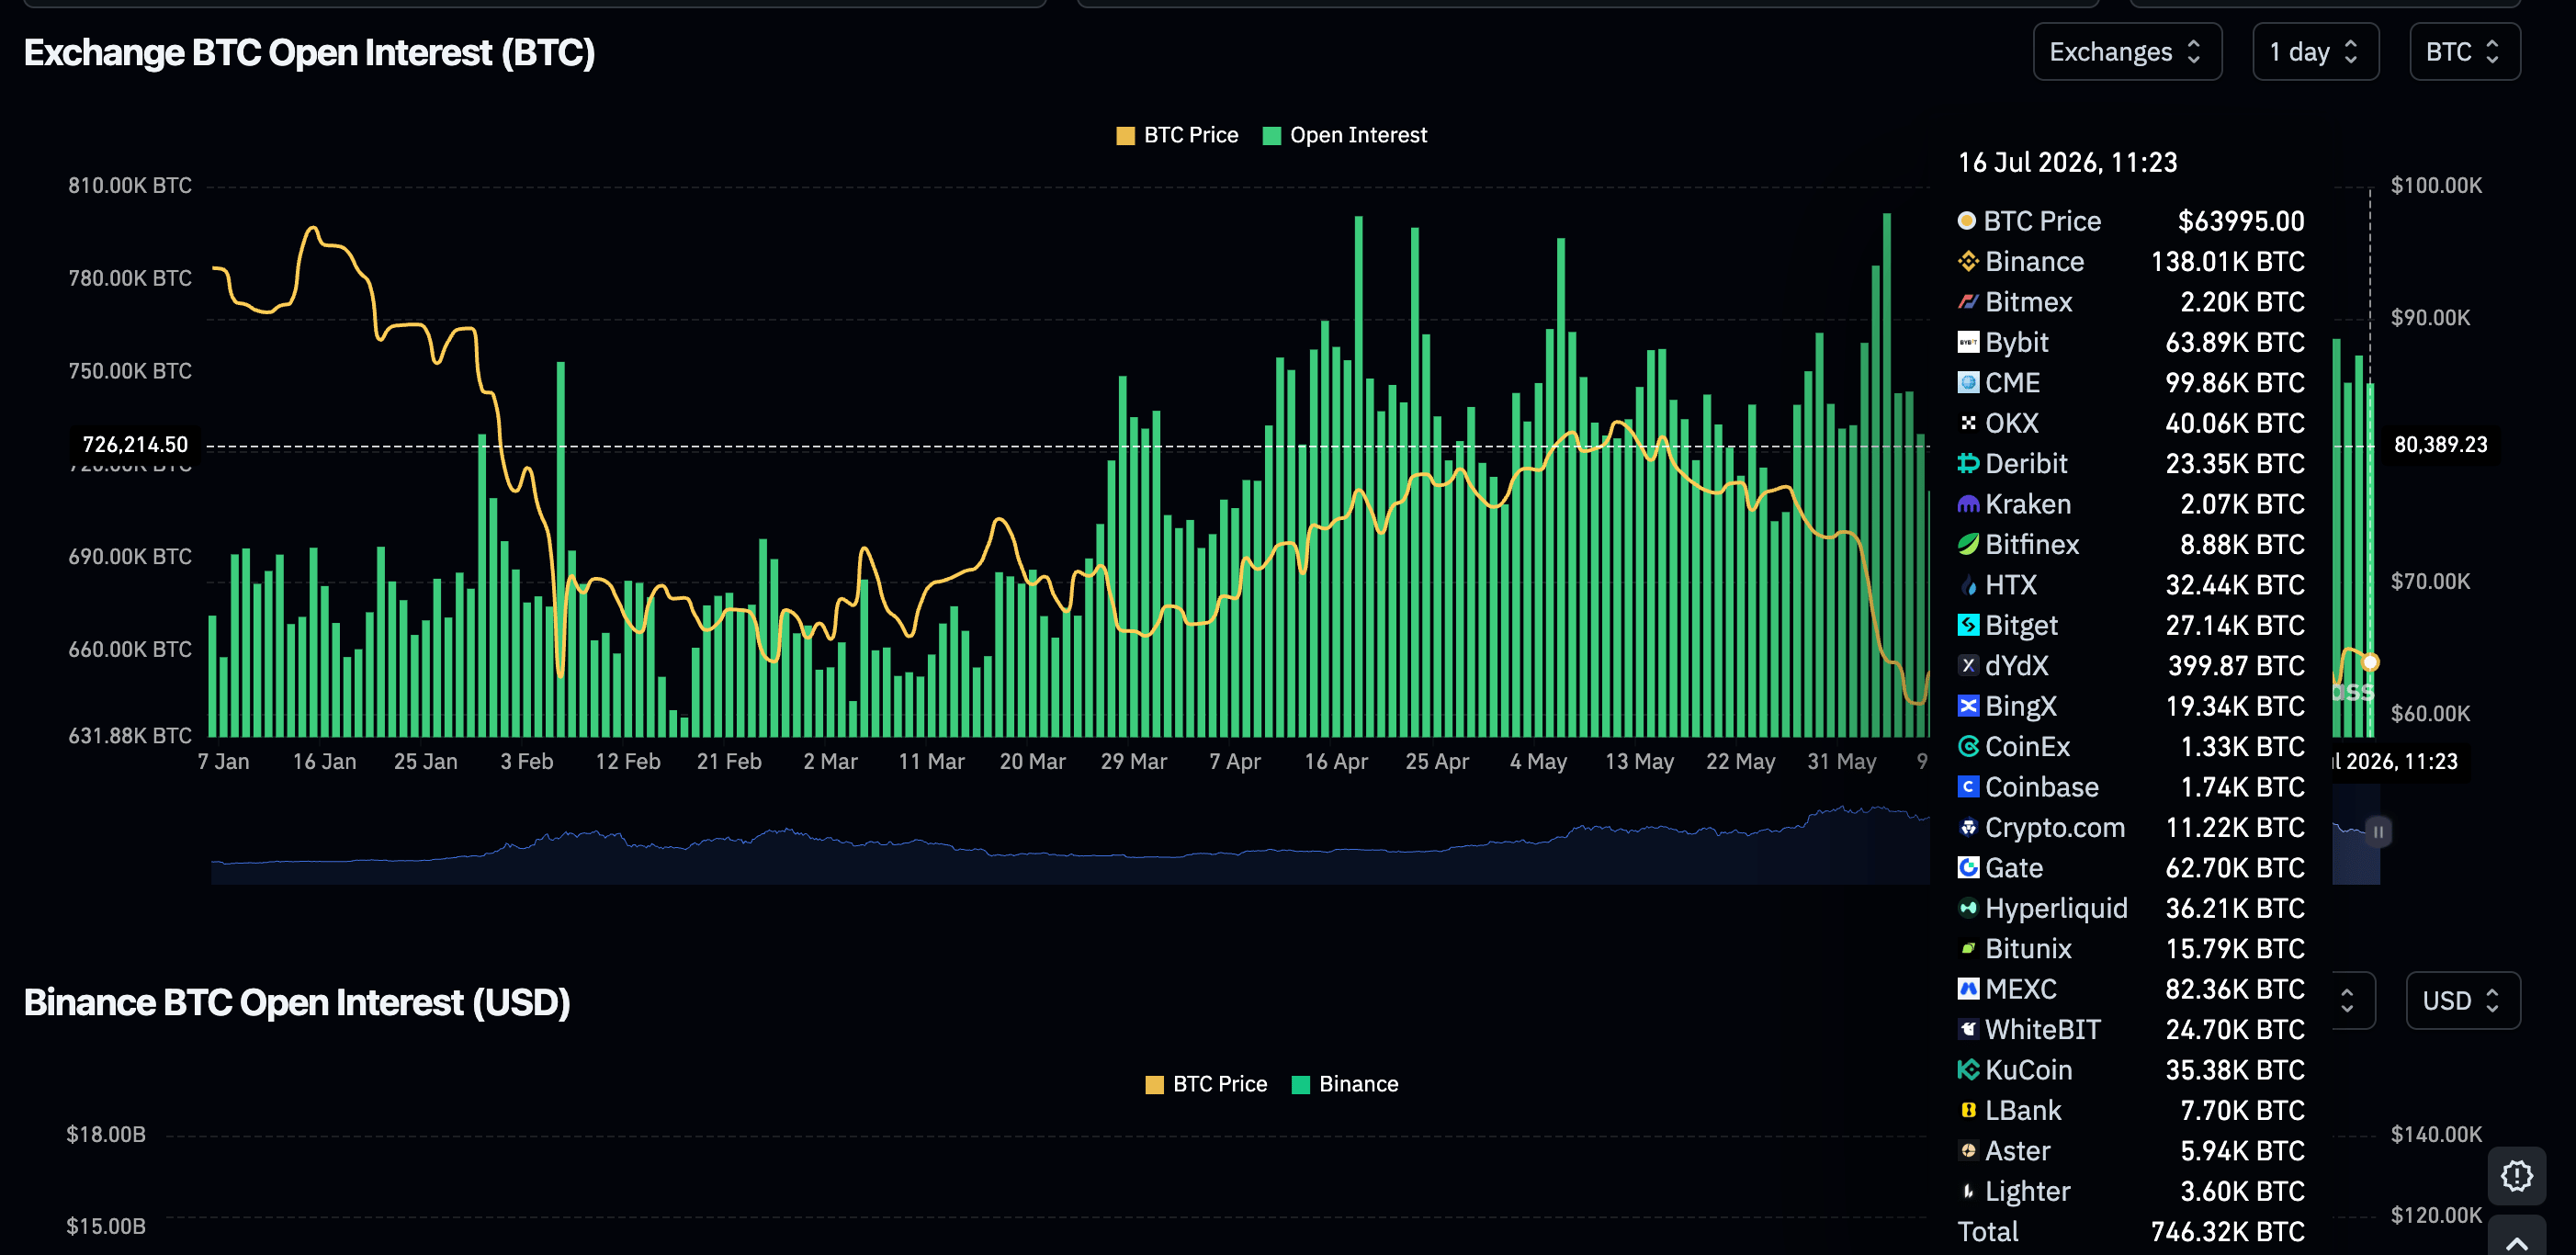
Retail interest in Bitcoin is losing momentum, as the perpetual futures Open Interest (OI) has shrunk to 747,000 BTC on Thursday, down from 755,000 BTC the previous day. If the current correction persists, overhead pressure could limit BTC’s recovery and deepen the pullback below $64,000.
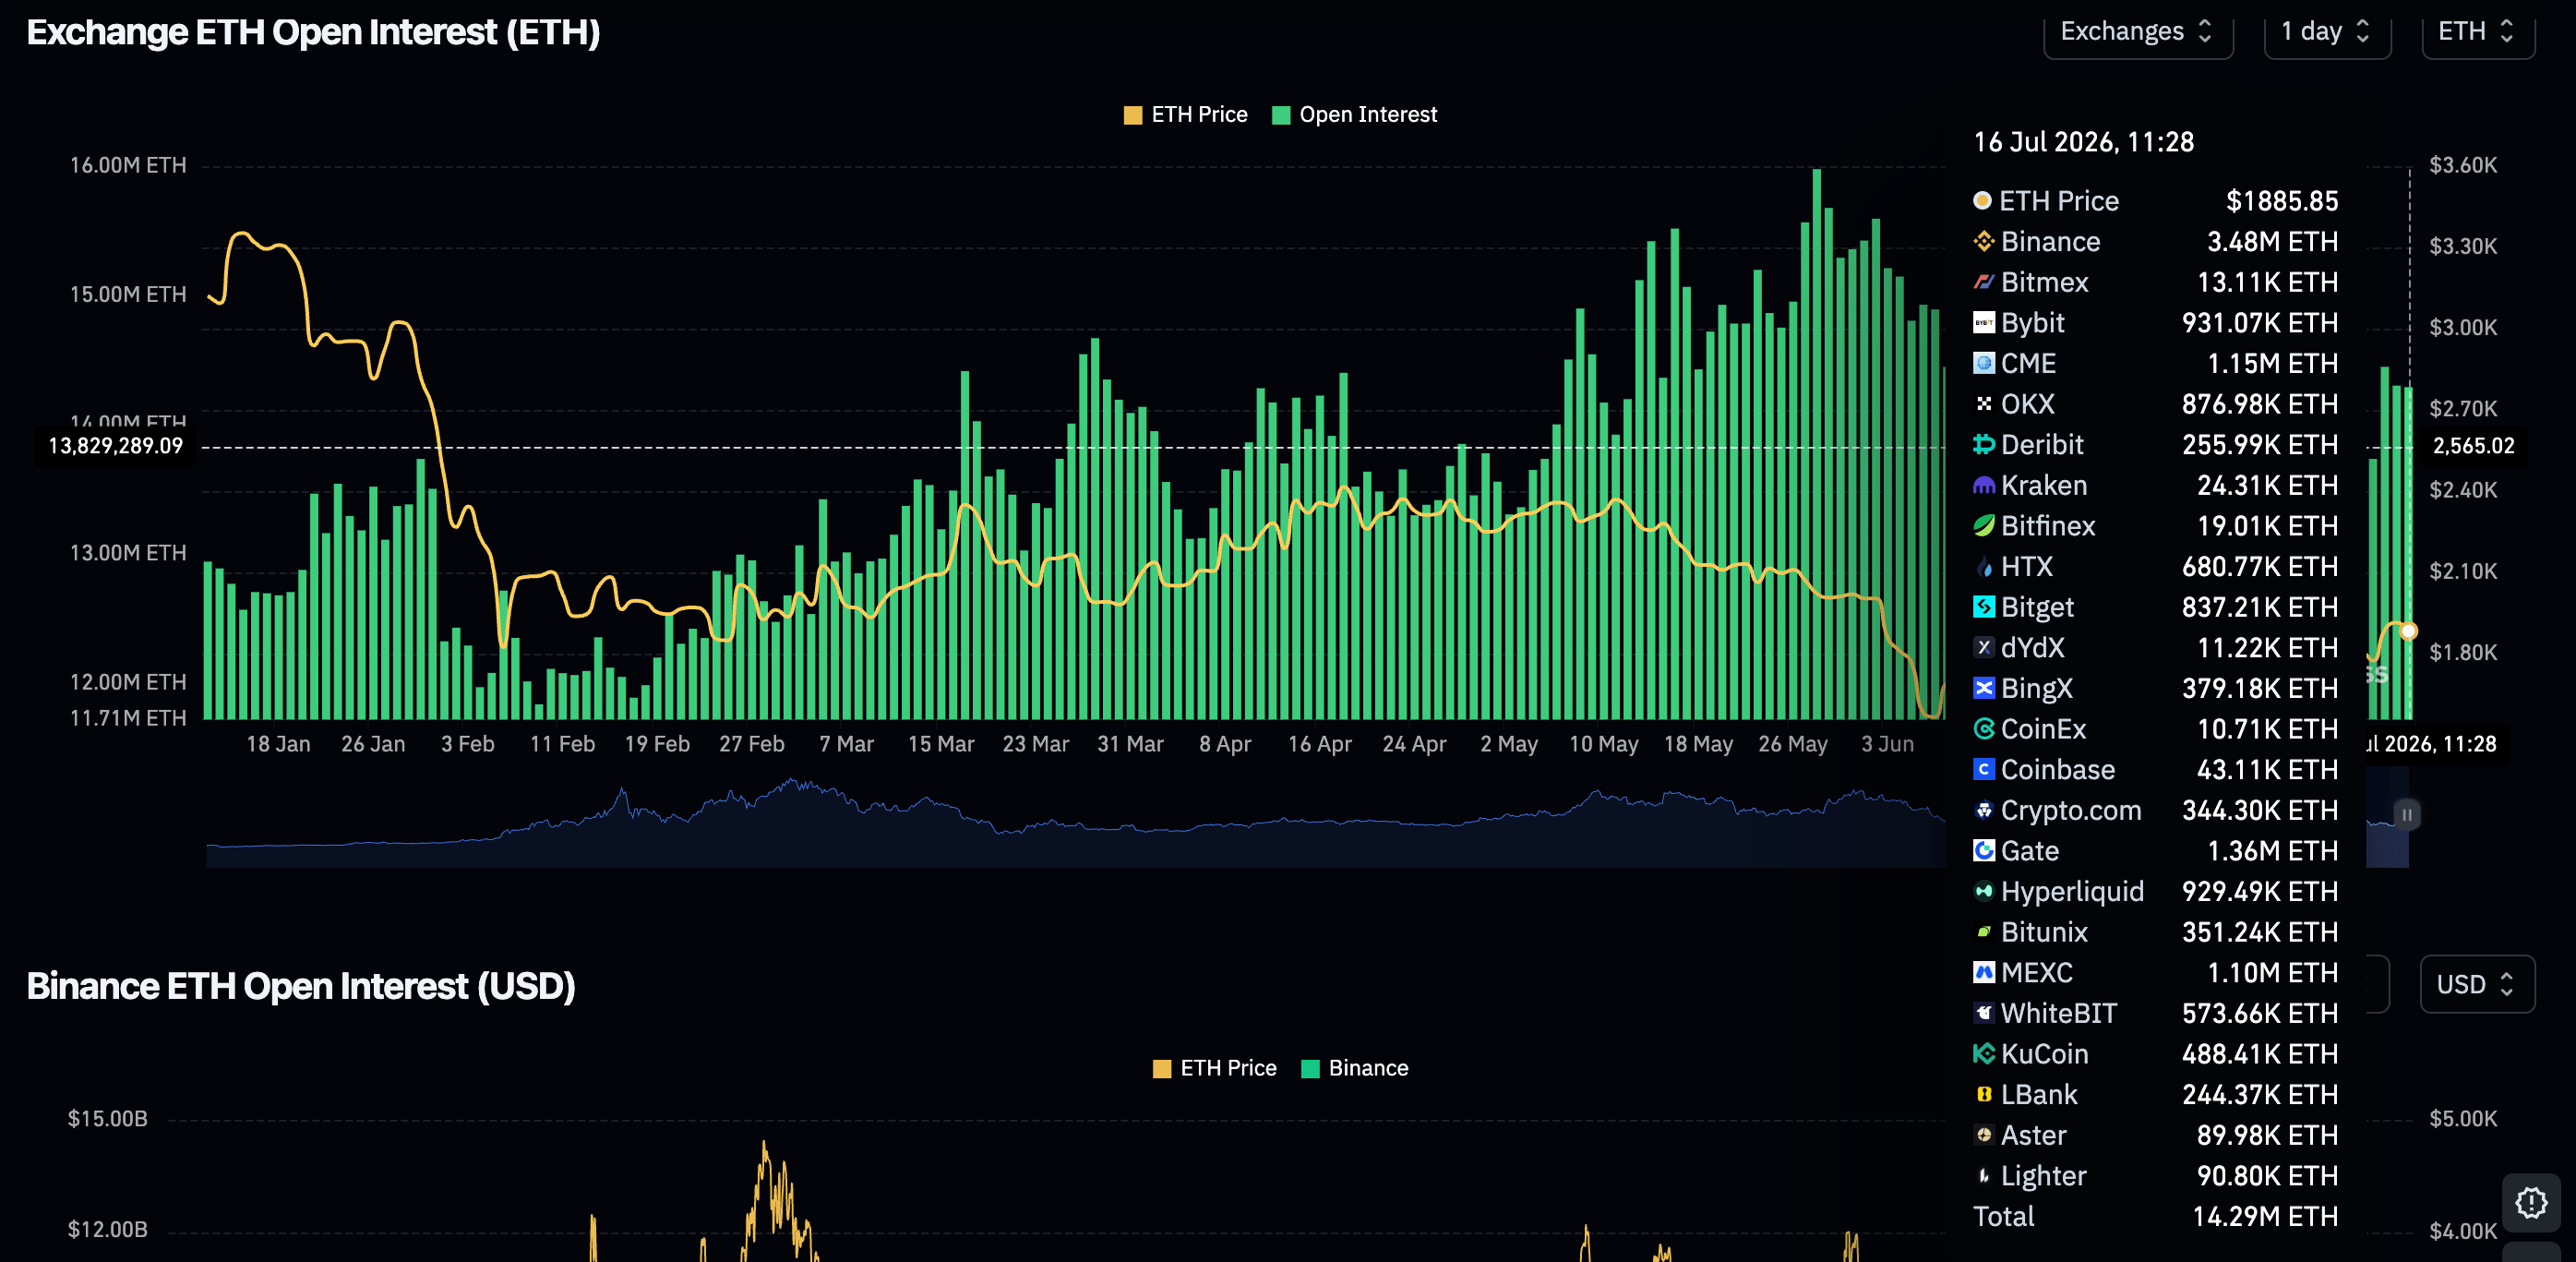
Ethereum derivatives paint a picture similar to Bitcoin's, with perpetual futures OI rising marginally to 14.36 million ETH on Thursday from 14.3 million ETH the day before. However, a broader scope shows a persistent decline from nearly 16 million ETH on May 28.
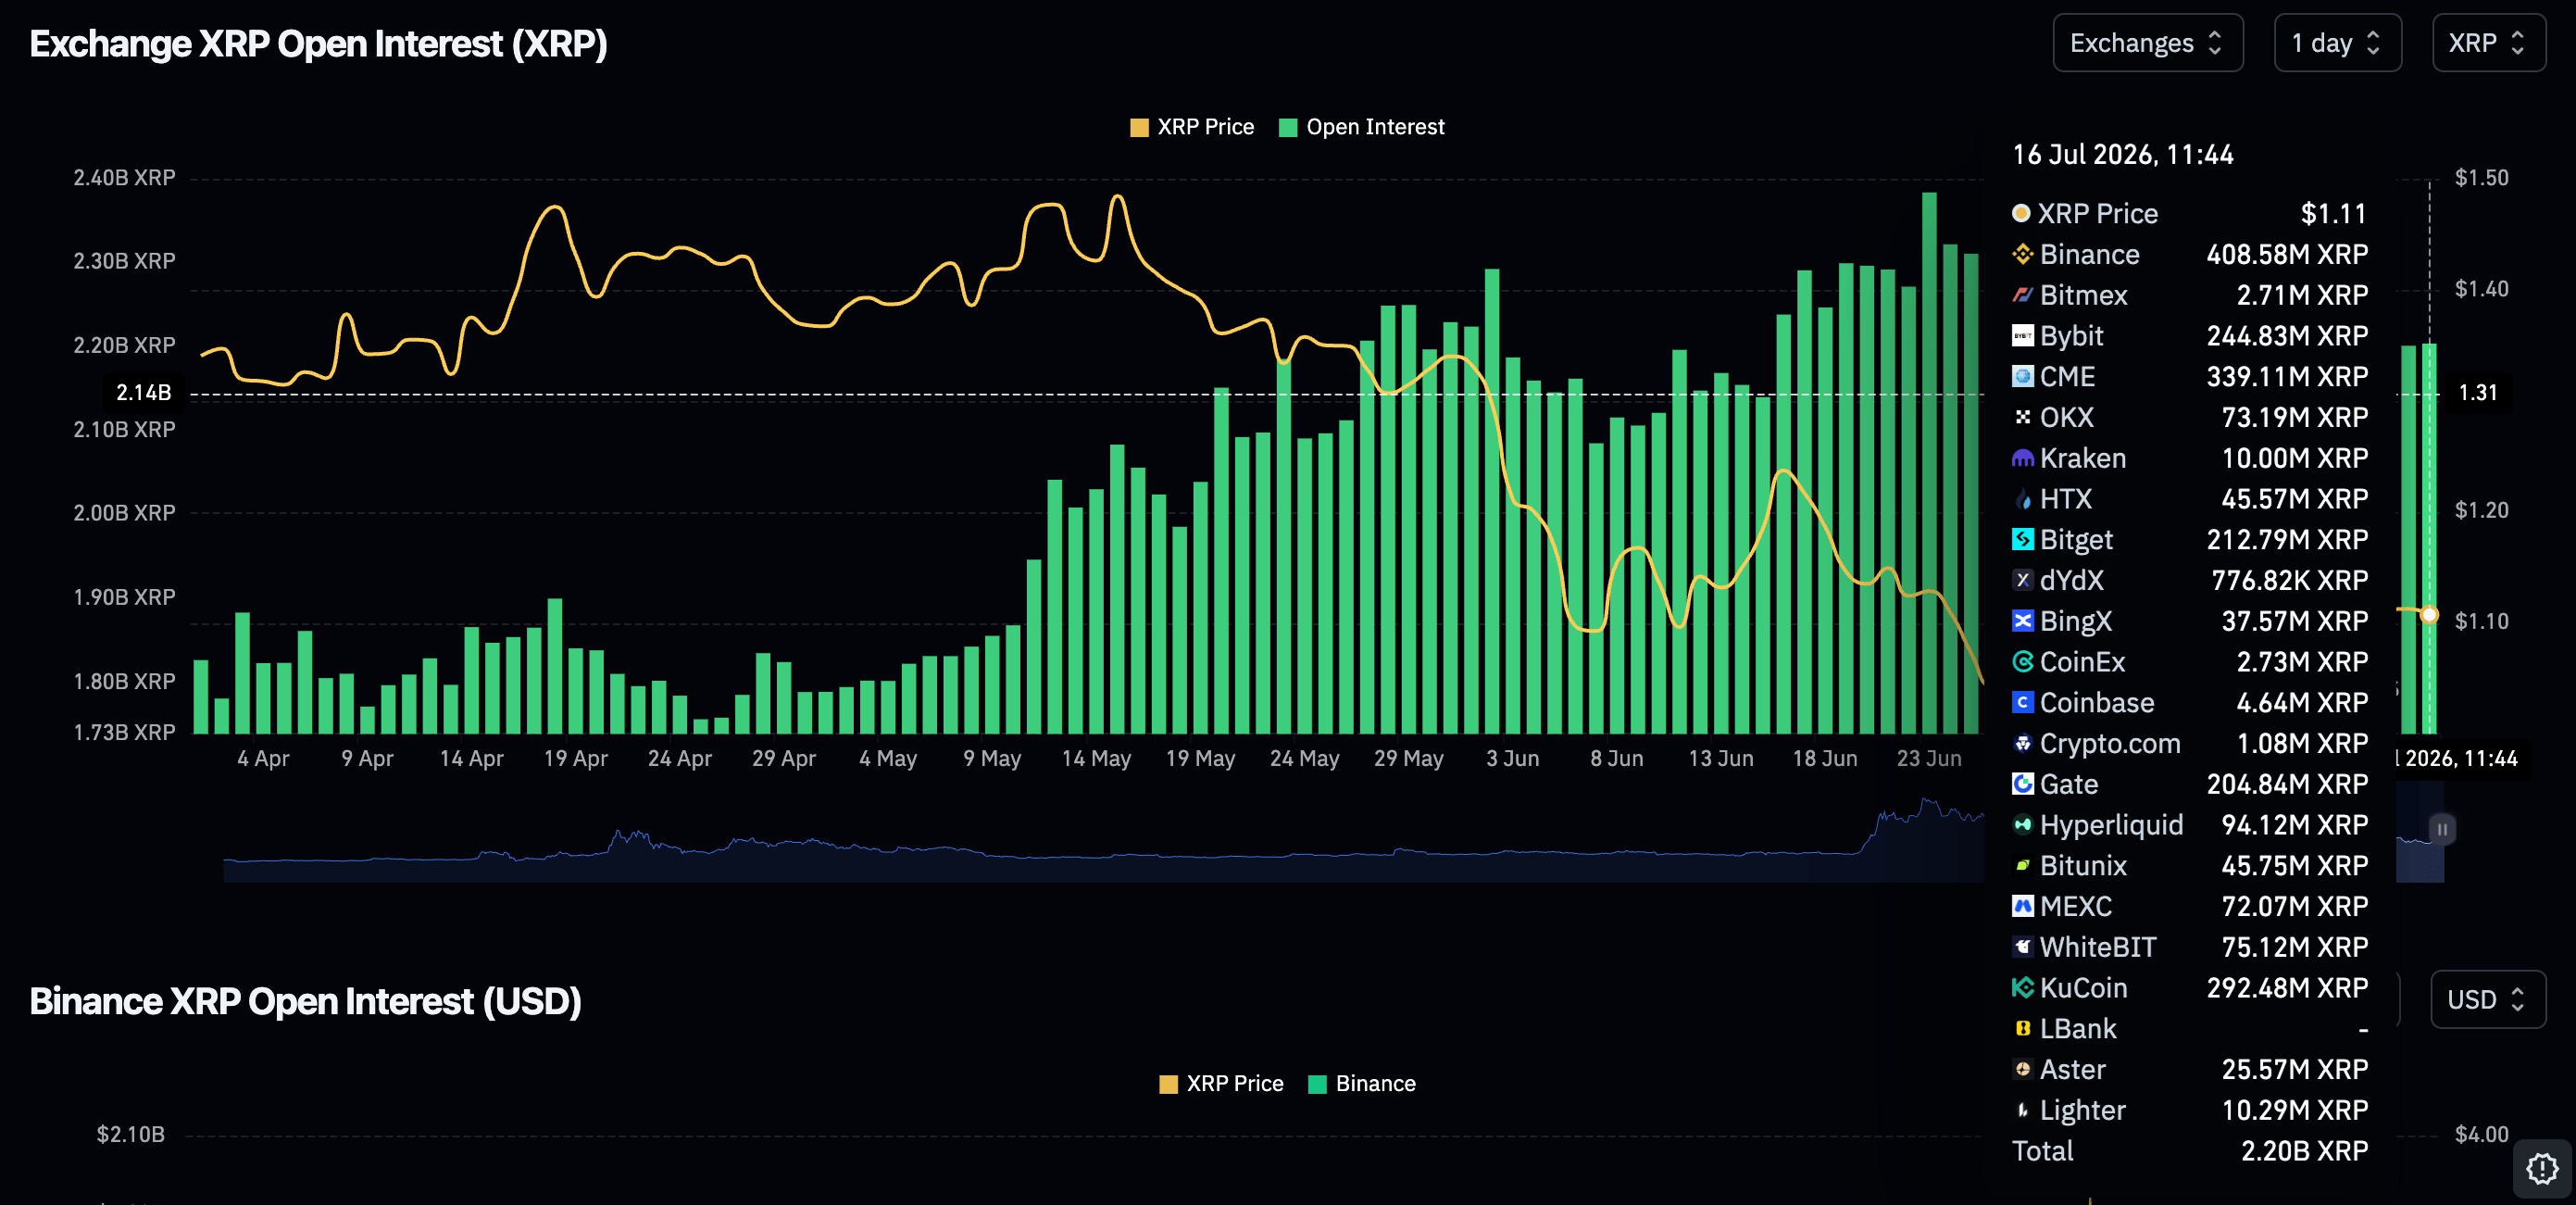
Retail demand also shows marginal improvement, as perpetual futures OI expands to 2.21 billion XRP on Thursday, up from 2.2 billion XRP the previous day.
Despite the mild increase, CoinGlass data shows that the OI holds below the June peak of 2.28 billion XRP. This implies that steady retail demand is critical to stabilizing XRP’s short- to medium-term outlook.
Bitcoin analysis: Bitcoin rallies remain vulnerable
Bitcoin trades above $64,000 following a correction from its weekly high of $65,600. The price holds below the 50-day, 100-day and 200-day Moving Average Exponential (EMA) at $65,119, $68,446 and $74,480 respectively. This alignment of key EMAs overhead suggests rallies remain vulnerable, even as the Relative Strength Index (RSI) indicator at 53 and the Moving Average Convergence Divergence (MACD) above zero with a positive line reading around 431 hint at mildly improving momentum rather than a decisive bullish shift.
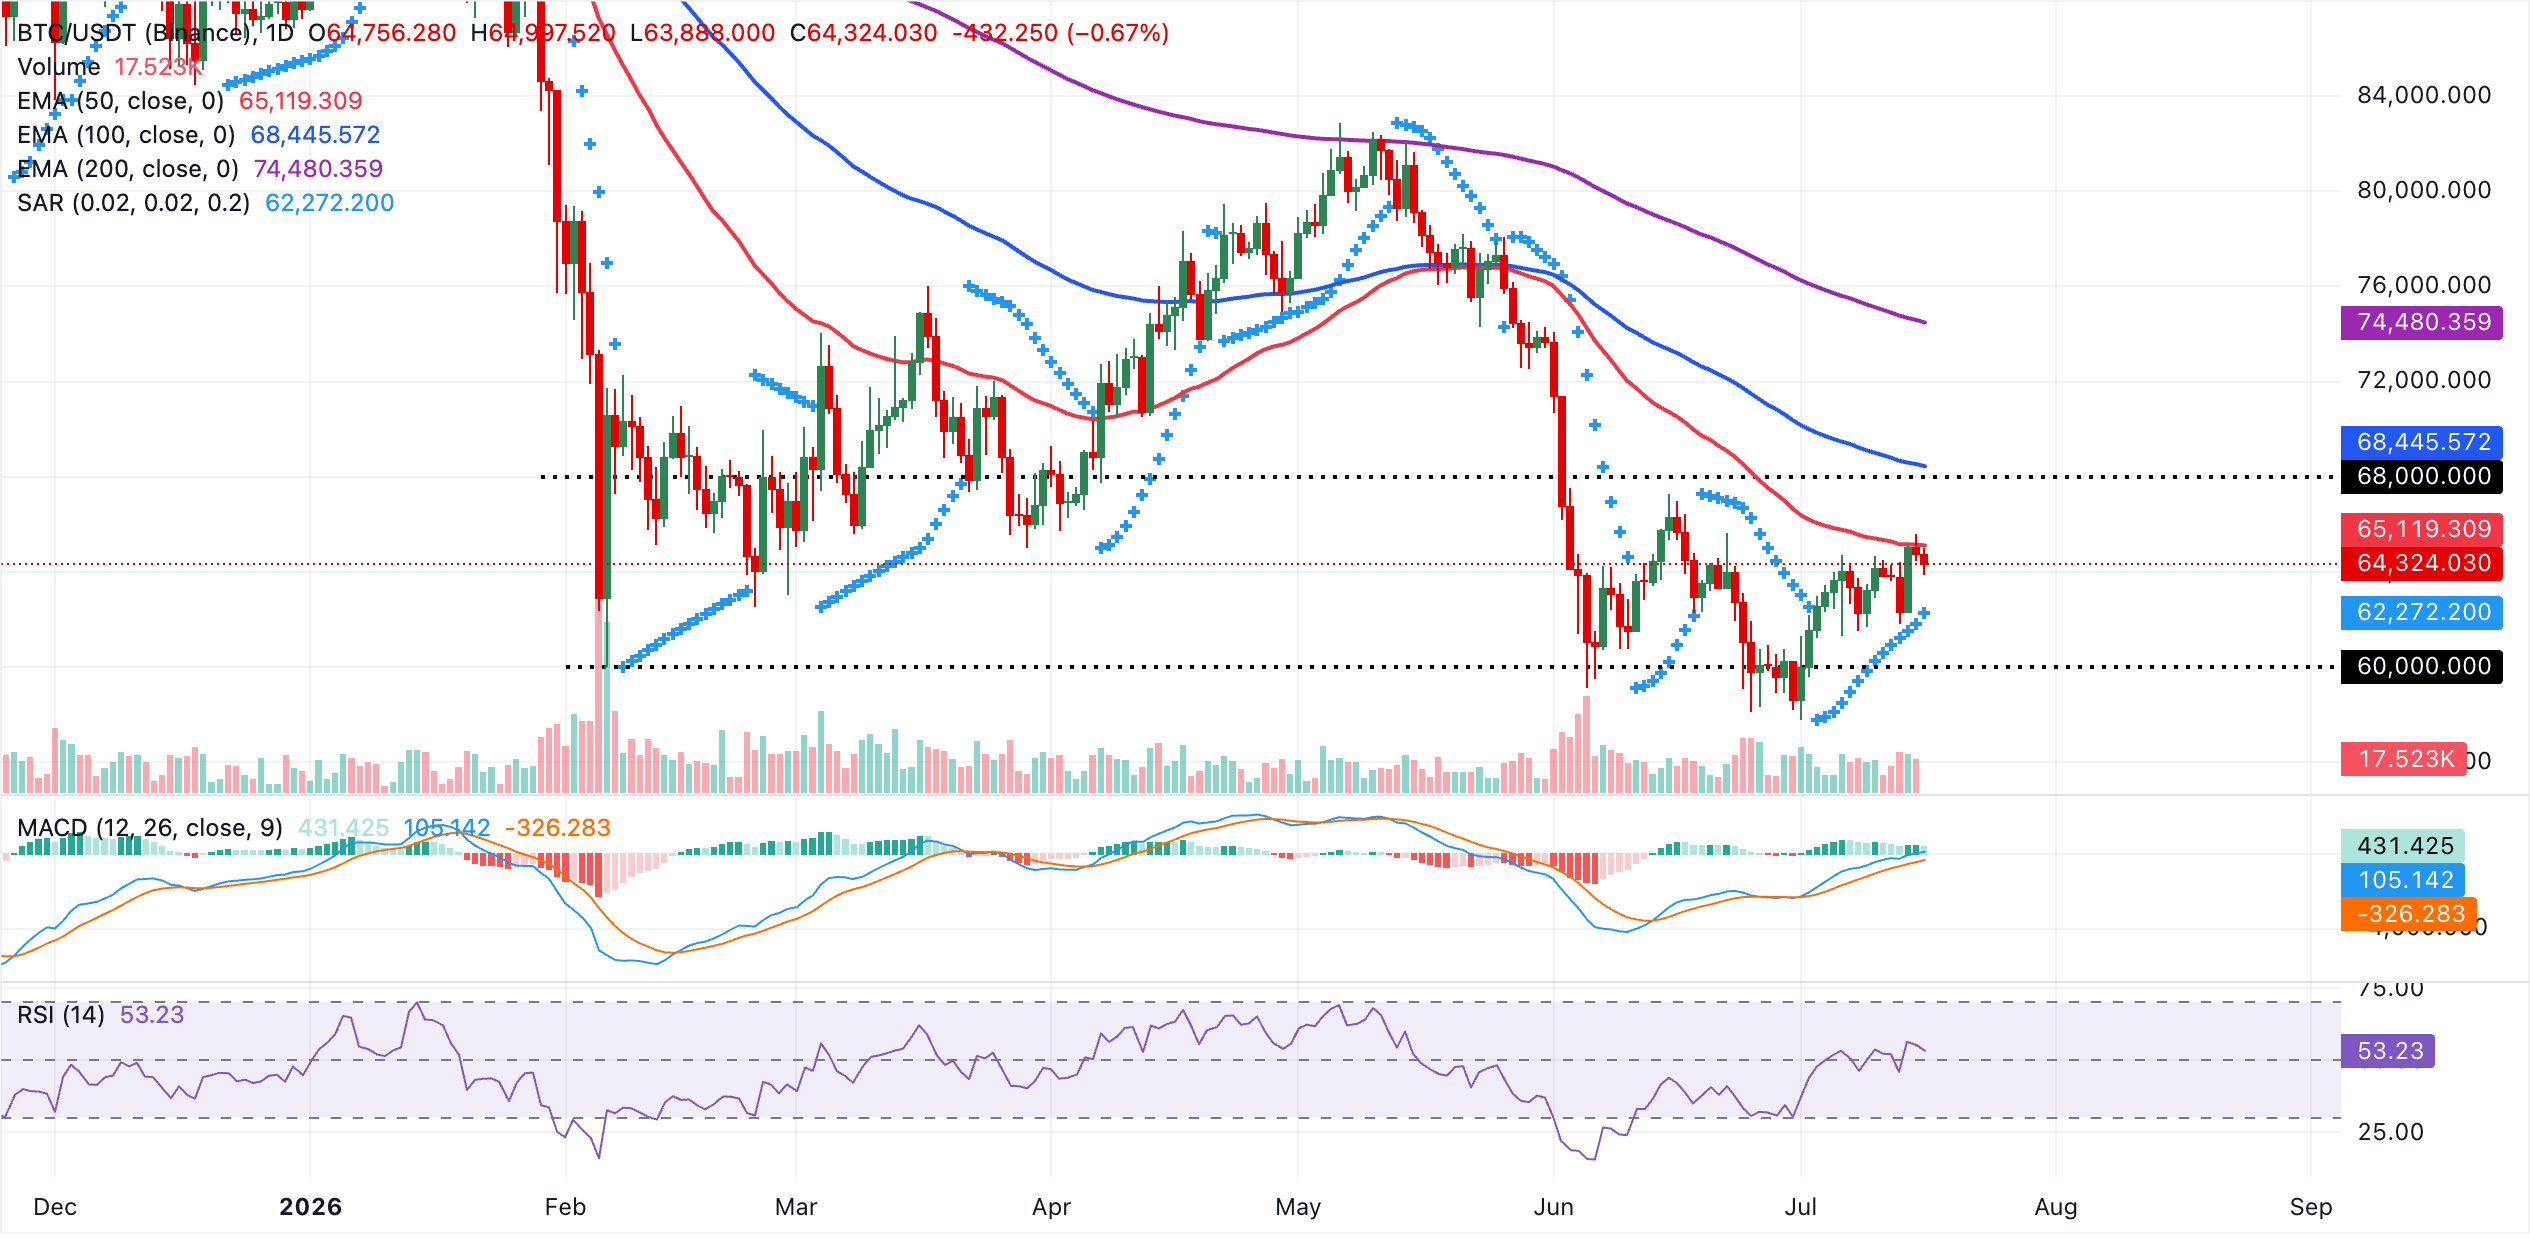
Initial resistance lies at the 50-day EMA near $65,119, followed by the 100-day EMA at $68,446 and then the 200-day EMA at $74,480 as a broader trend cap. On the downside, the Parabolic SAR at $62,272 offers the first notable support, and a daily close below this level would likely expose deeper retracement as buyers lose their most immediate technical floor.
Altcoins outlook: XRP struggle to build momentum
Ethereum hovers near $1,900, retaining a bullish near-term bias as price holds above the 50-day Exponential Moving Average (EMA) at $1,811 and the Parabolic SAR at $1,773. The pair is still capped by the 100-day EMA at $1,944., while the longer-term 200-day EMA at $2,190 looms as a broader structural barrier.
Momentum remains constructive, with the RSI at 63 leaning toward overbought territory and the MACD above zero with a positive reading around 24, which together suggest persistent buying interest but also raise the risk of a pause or shallow correction.
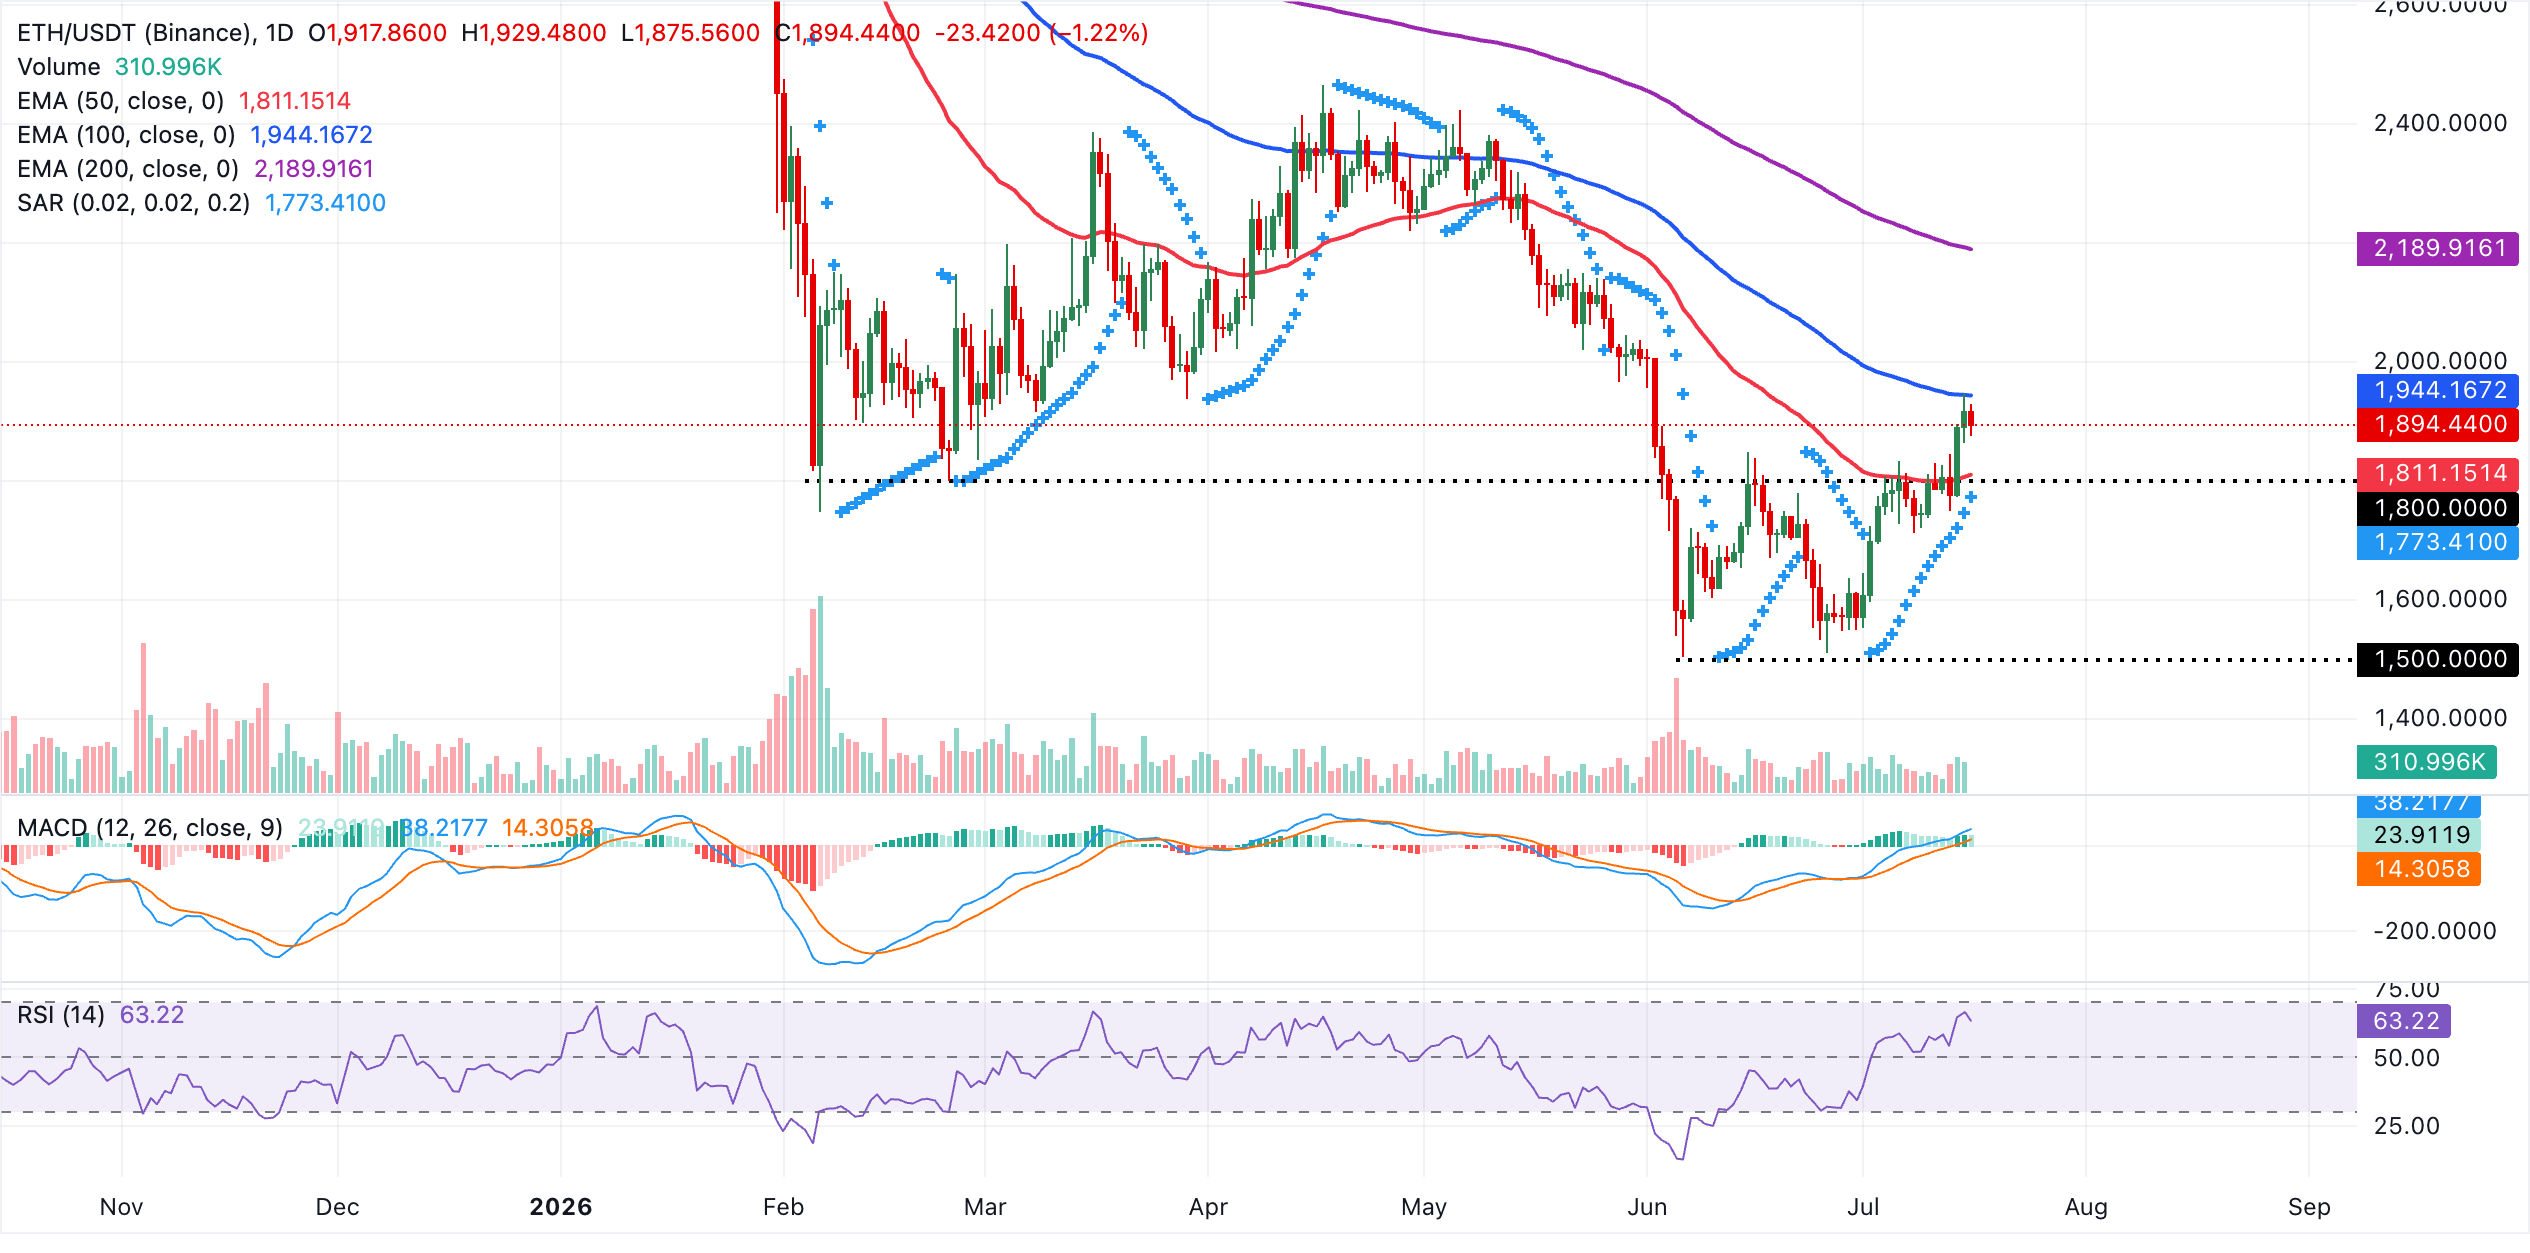
Immediate support is lies at the 50-day EMA near $1,811, followed by the latest Parabolic SAR signal at about $1,773, where dip-buying could re-emerge if volatility picks up. On the topside, initial resistance aligns at the 100-day EMA around $1,944. A sustained break above this level would open the door for a push toward the 200-day EMA near $2,190, a zone that would likely attract profit-taking and test the strength of the current recovery phase.
XRP, on the other hand, trades above $1.10, retaining a bearish near-term bias as price sits beneath the key moving averages. The 50-day EMA at $1.16 is the first overhead cap, followed by the Bollinger Bands upper band near $1.17, while the 100-EMA at $1.25 and 200-EMA at $1.46 reinforce a broader downtrend structure.
The RSI at 48 is neutral, and the MACD holds slightly positive territory with a modestly bullish reading, hinting that downside pressure is moderating rather than reversing.
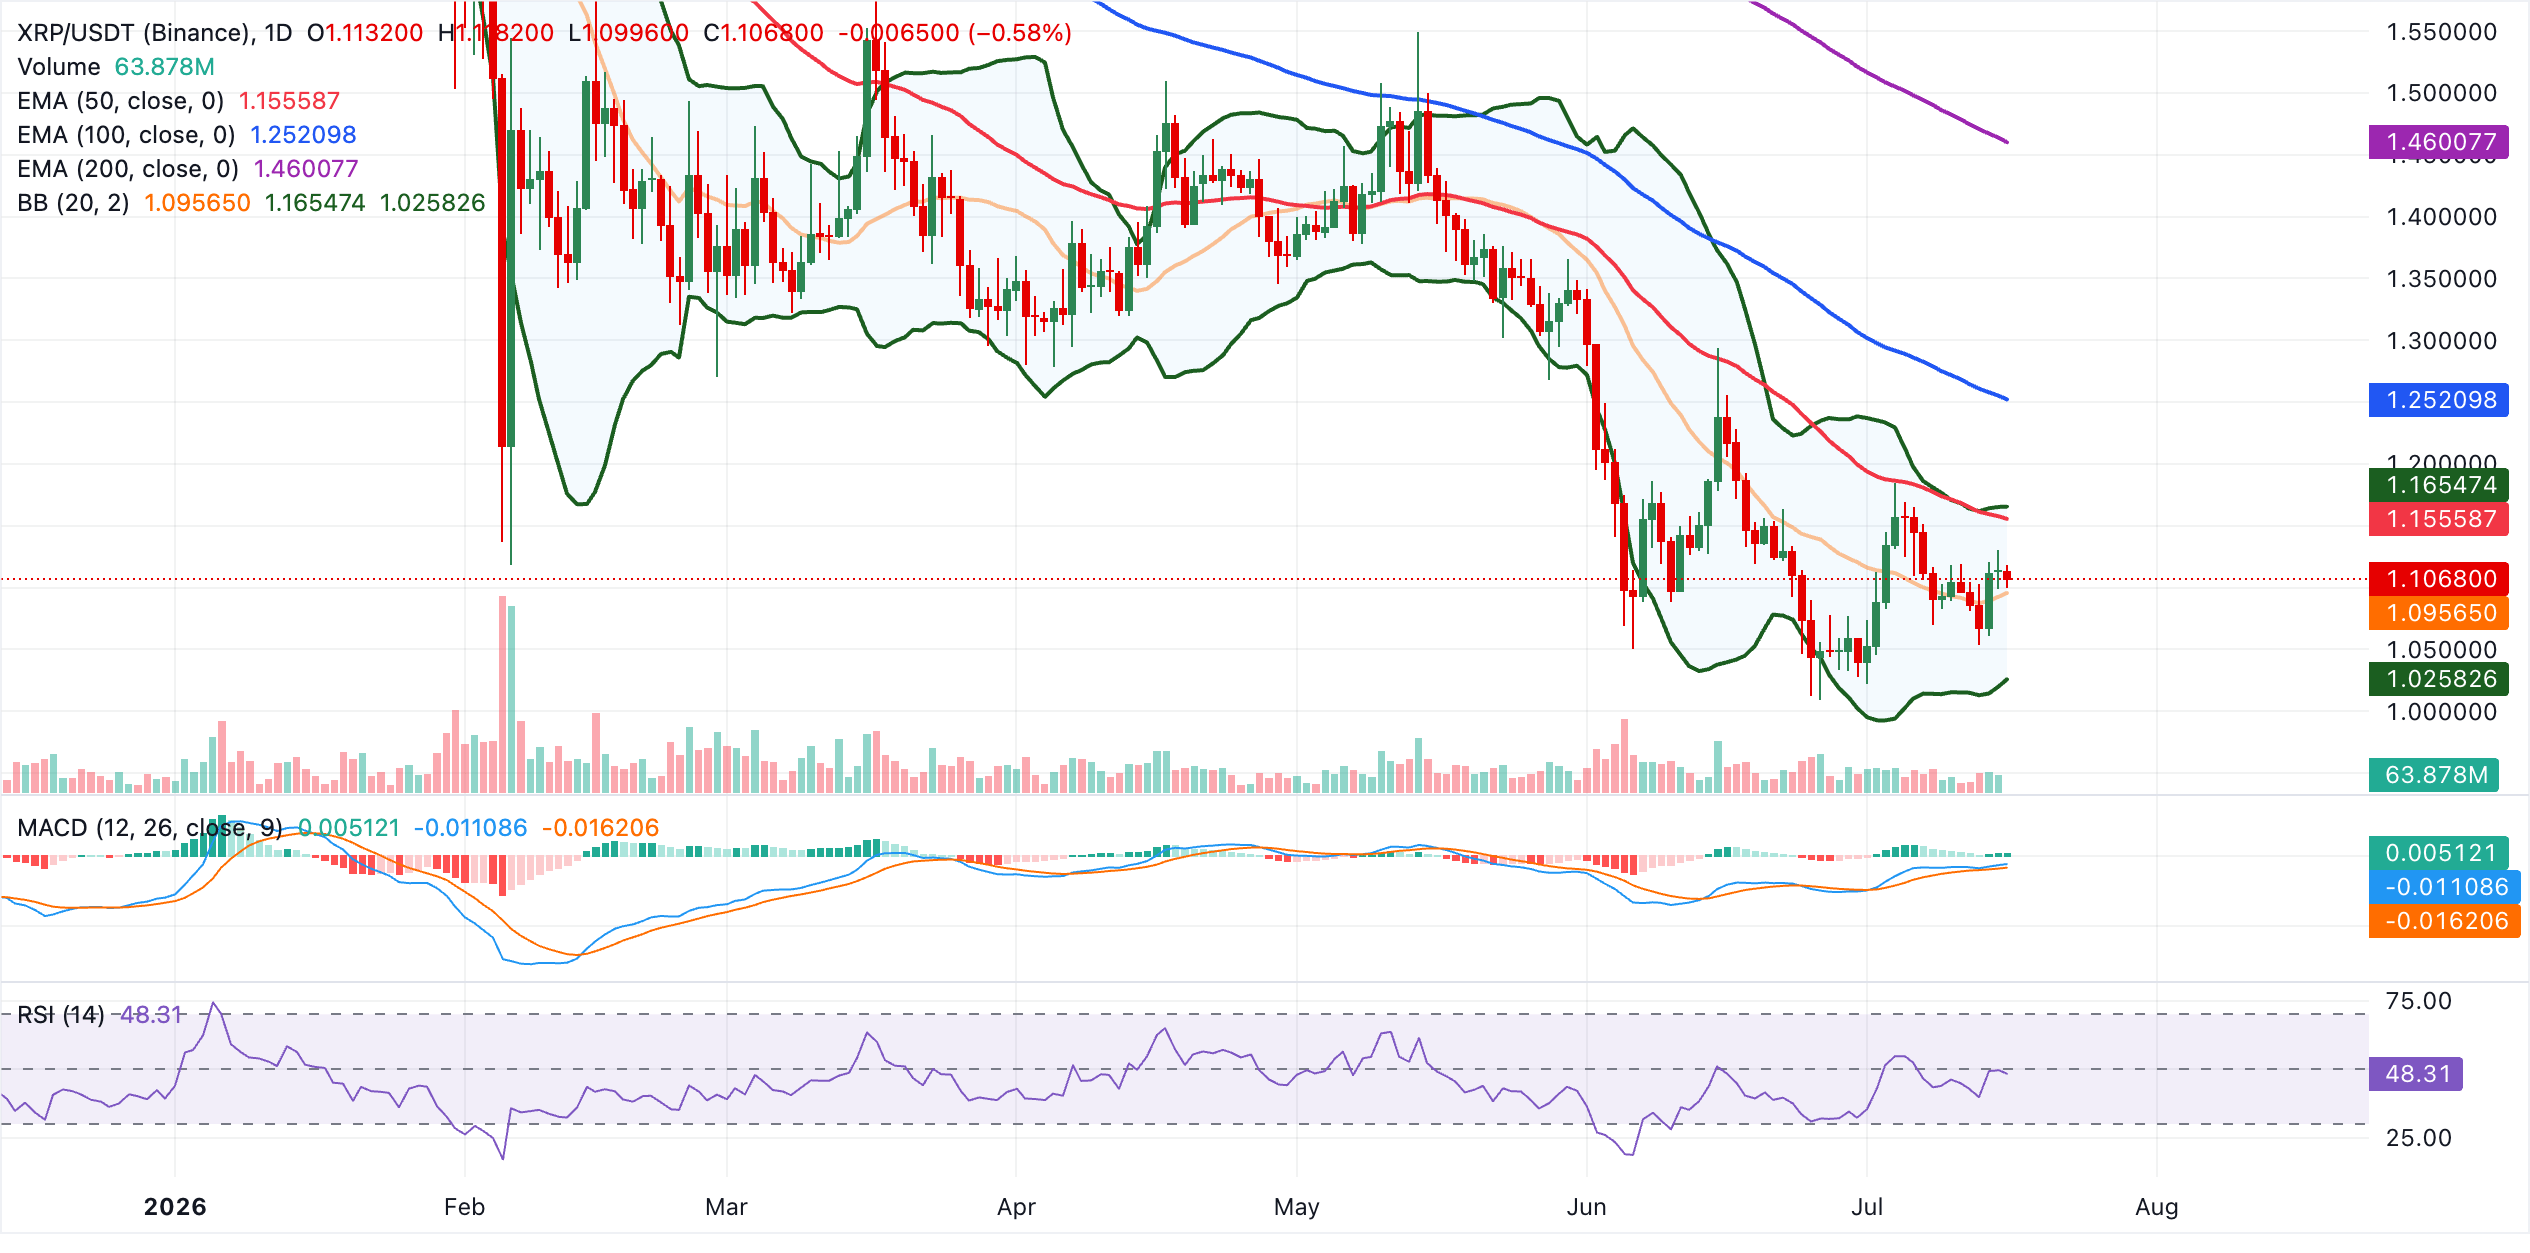
On the downside, immediate support aligns with the Bollinger Bands middle band at $1.10, just below spot, with the lower band near $1.03 acting as a deeper cushion if selling resumes. On the topside, a sustained break above the 50-EMA at $1.16 would be the first signal that bears are losing control, opening the way toward the $1.17 Bollinger upper band. A recovery above the 100-EMA at $1.25 would start to challenge the prevailing bearish framework defined by the distant 200-EMA at $1.46.
(The technical analysis of this story was written with the help of an AI tool. Know more.)
Open Interest, funding rate FAQs
Higher Open Interest is associated with higher liquidity and new capital inflow to the market. This is considered the equivalent of increase in efficiency and the ongoing trend continues. When Open Interest decreases, it is considered a sign of liquidation in the market, investors are leaving and the overall demand for an asset is on a decline, fueling a bearish sentiment among investors.
Funding fees bridge the difference between spot prices and prices of futures contracts of an asset by increasing liquidation risks faced by traders. A consistently high and positive funding rate implies there is a bullish sentiment among market participants and there is an expectation of a price hike. A consistently negative funding rate for an asset implies a bearish sentiment, indicating that traders expect the cryptocurrency’s price to fall and a bearish trend reversal is likely to occur.














