
Crypto Today: Bitcoin, Ethereum, XRP test rebound strength despite fading retail interest
작성자 John Isige
수정됨: 30 Mar 2026


인기 기사

Bitcoin (BTC) gains momentum alongside other major cryptocurrencies, including Ethereum (ETH) and Ripple (XRP), on Monday. The Crypto King holds $67,000 as immediate support but remains below $68,000 short-term resistance.
- Bitcoin rises and holds $67,000 as support amid shrinking Open Interest.
- Ethereum extends gains above $2,000 despite a weakening derivatives market, with OI averaging $28 billion.
- XRP rises to $1.36, moving in tandem with the broader crypto market on Monday.
Bitcoin (BTC) gains momentum alongside other major cryptocurrencies, including Ethereum (ETH) and Ripple (XRP), on Monday. The Crypto King holds $67,000 as immediate support but remains below $68,000 short-term resistance. Meanwhile, Ethereum has reclaimed the pivotal $2,000 threshold, rising alongside XRP, which hovers above $1.36.
Bitcoin, Ethereum and XRP edge higher as retail demand remains weak
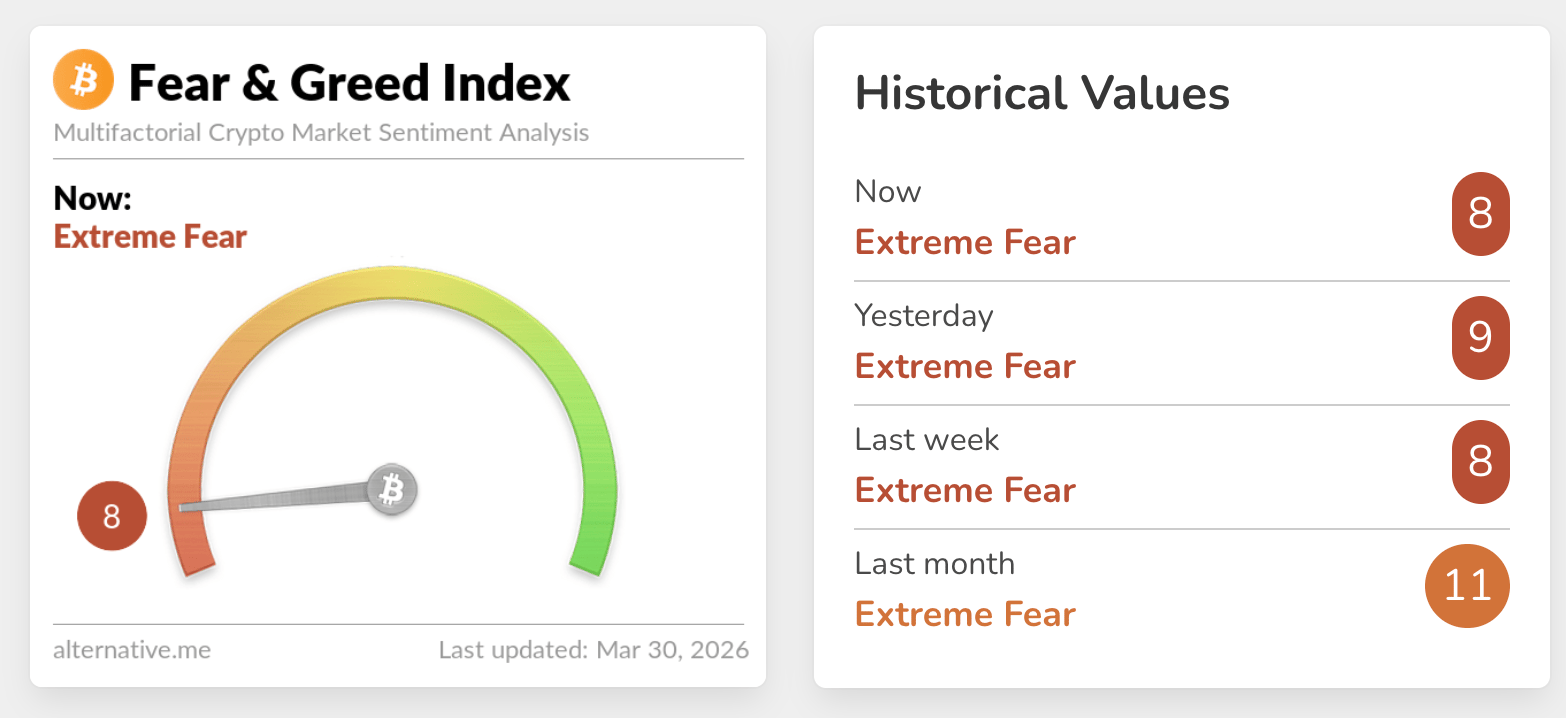
The broader crypto market continues to face low sentiment amid the United States (US) and Israel's war with Iran, as evidenced by narrowing retail demand. The Fear & Greed Index is at 8, reflecting extreme fear among investors. Geopolitical tensions hardly favour risk assets, while the associated macroeconomic uncertainty tends to cap potential rebounds.
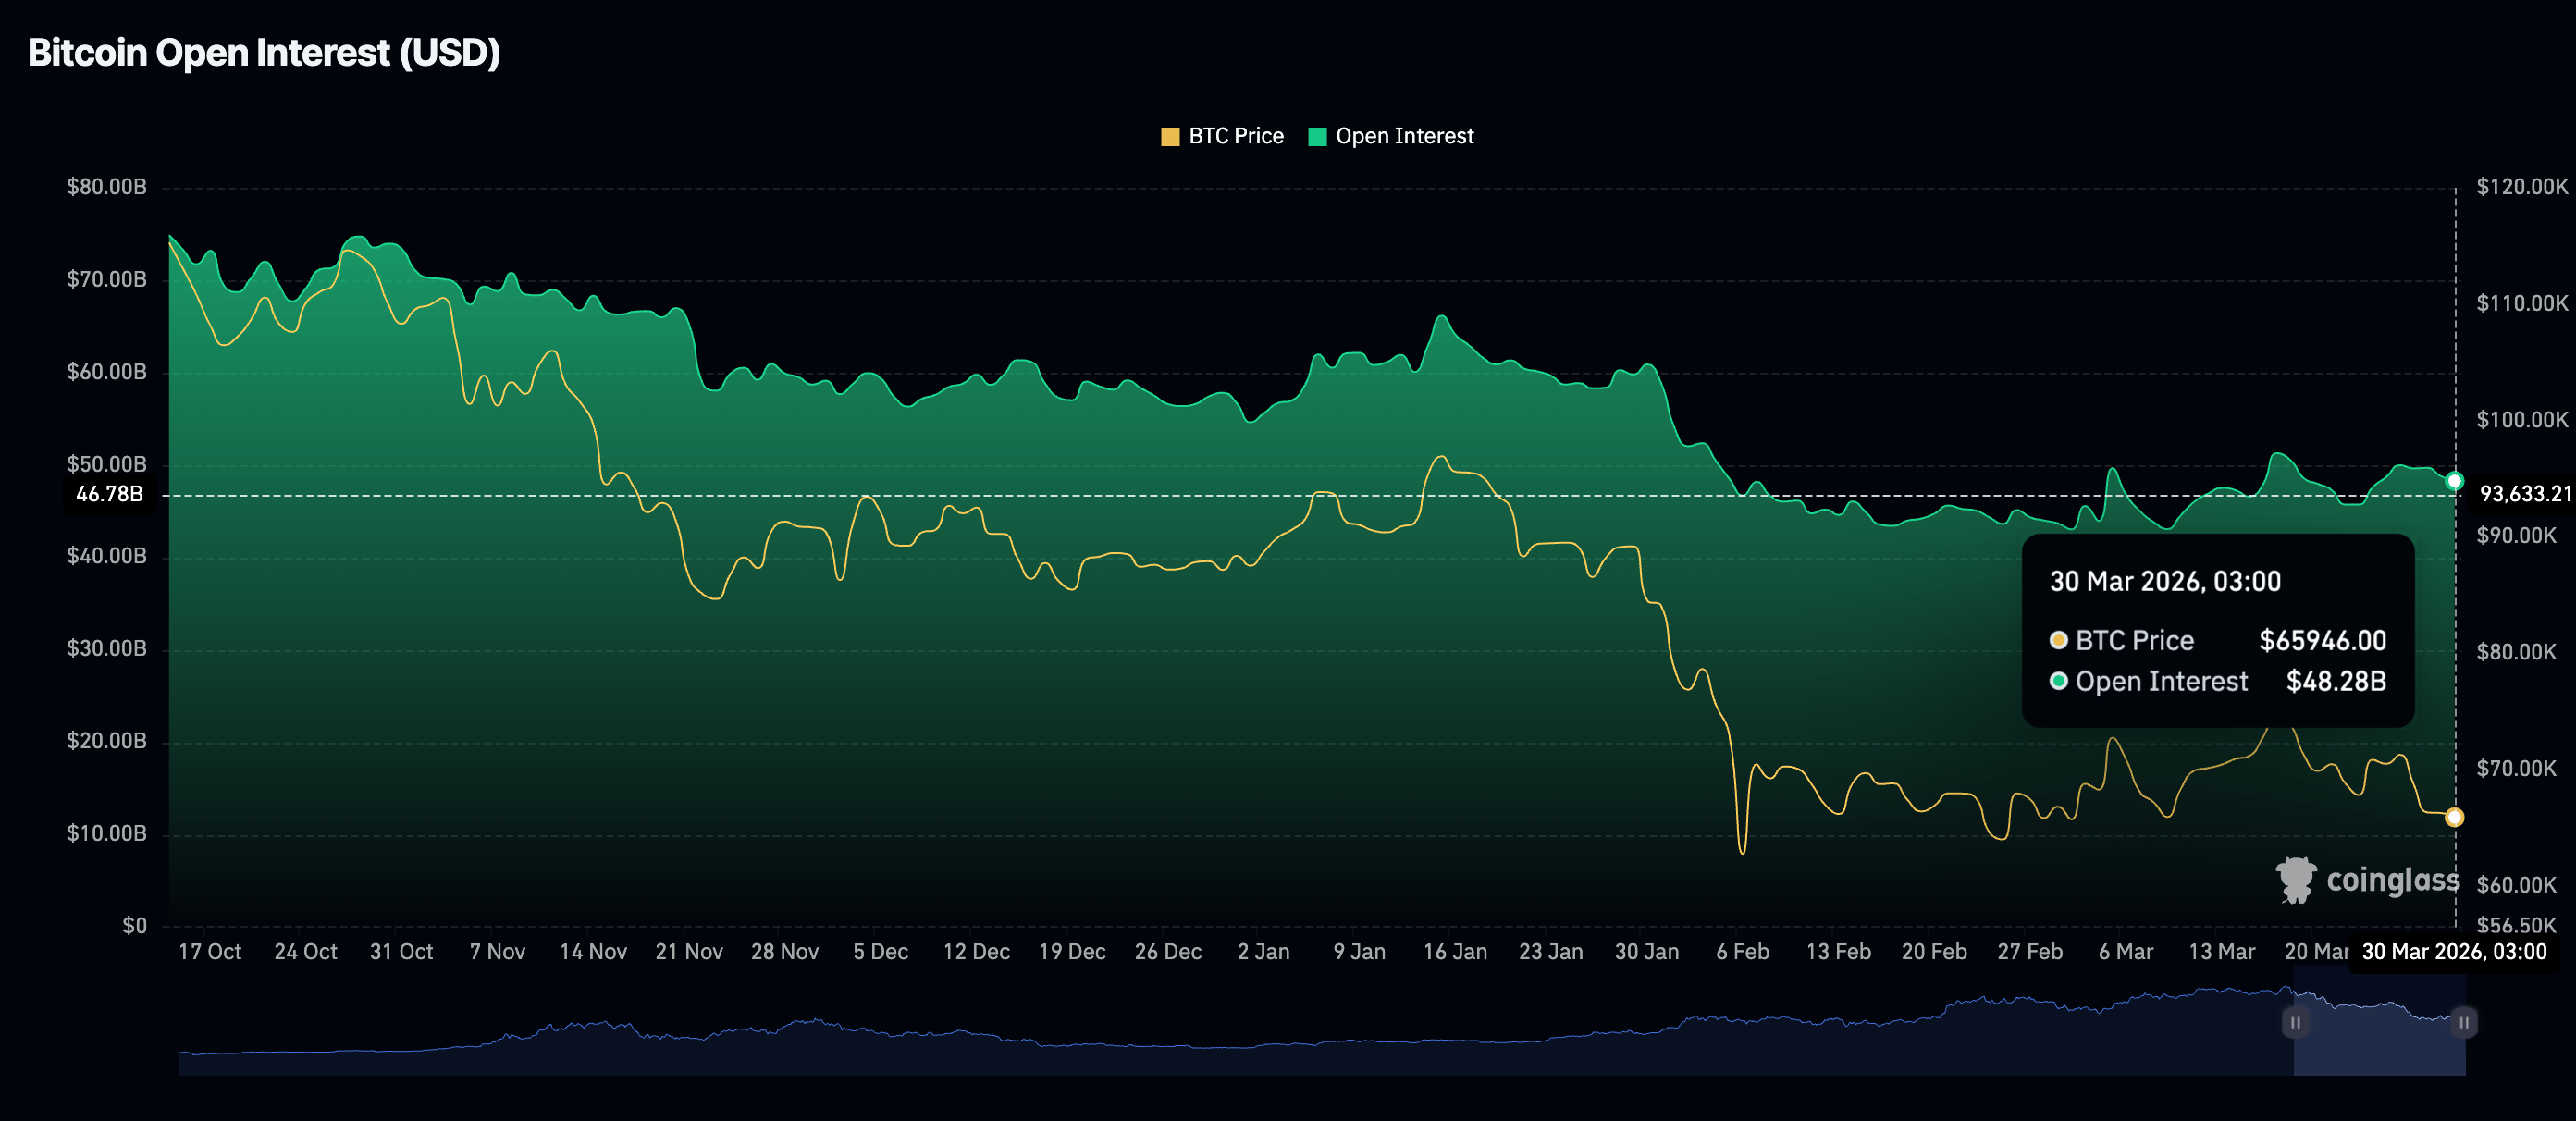
Demand for Bitcoin derivatives is fading, with futures Open Interest (OI) falling to $48.28 billion on Monday, from $48.80 billion the previous day. A slight increase last week saw the OI, reflecting the value of outstanding futures contracts, peak near $50.00 billion. If the Middle East war continues to drive weak sentiment, it could constrain Bitcoin’s short-term outlook.
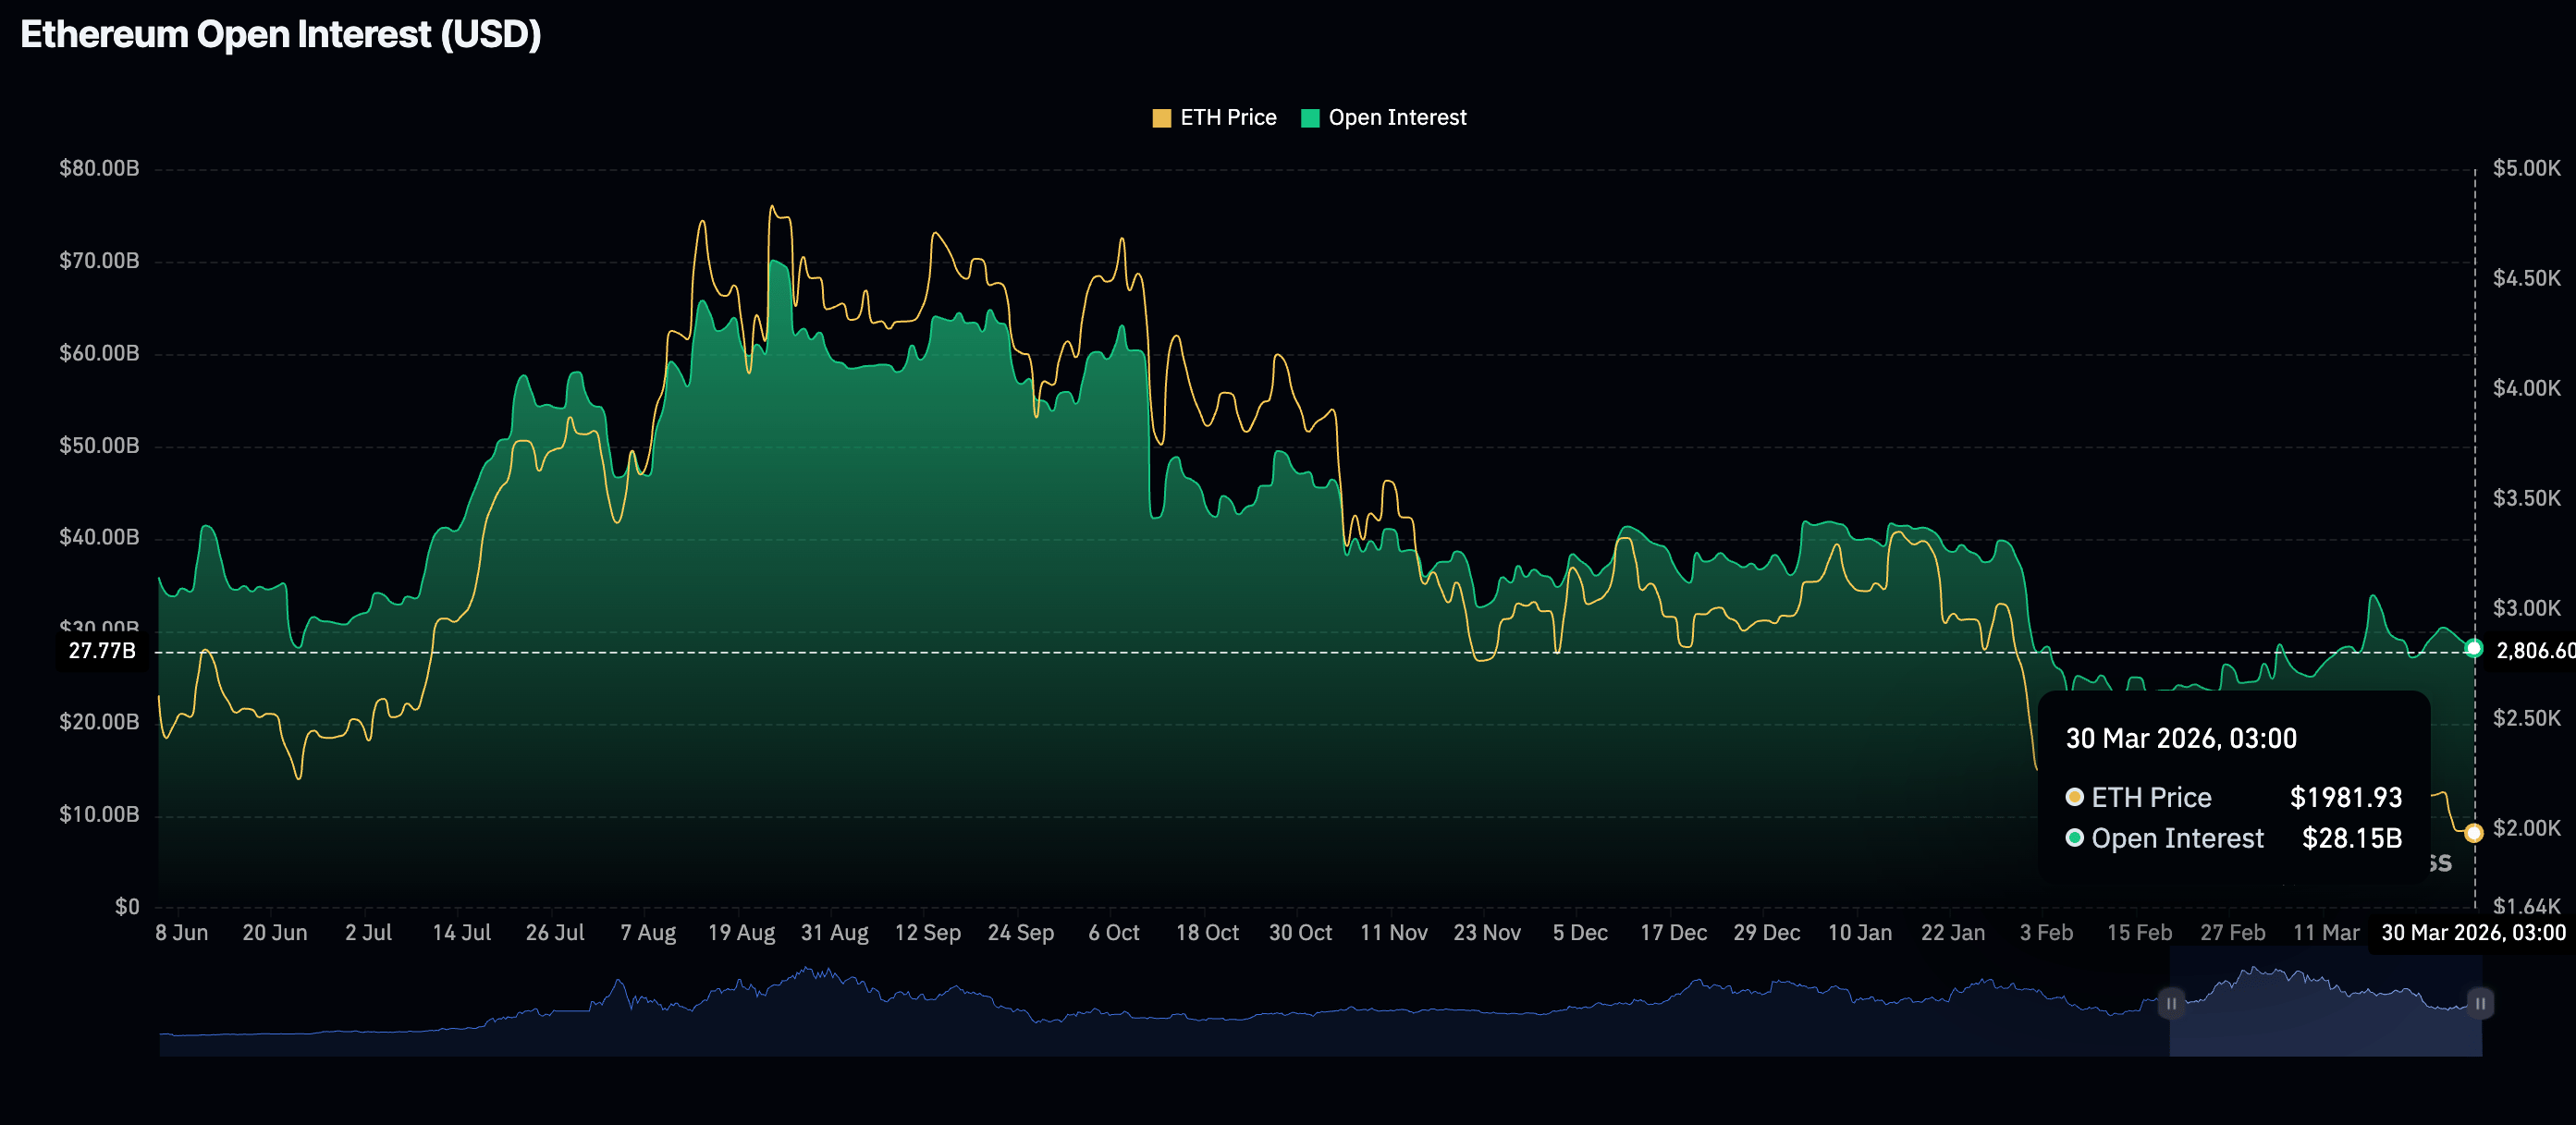
Ethereum derivatives paint a similar grim picture, as seen in futures OI, which fell to $28.15 billion on Monday from $29.22 billion the previous day. Despite the OI rising to $33.89 billion on March 17, the derivatives market remains in a bearish trend, as the OI peaked at $70.13 billion in August. Such a decline indicates that investors are not confident in the asset’s recovery potential and are unwilling to increase exposure.
Meanwhile, XRP futures OI steadies at $2.54 billion on Monday, from the previous day. Interest in the remittance token has generally been in a downtrend from $10.94 billion in July, when XRP hit a record high of $3.66. The low OI undermines retail demand, potentially putting XRP’s short-term recovery potential at risk.
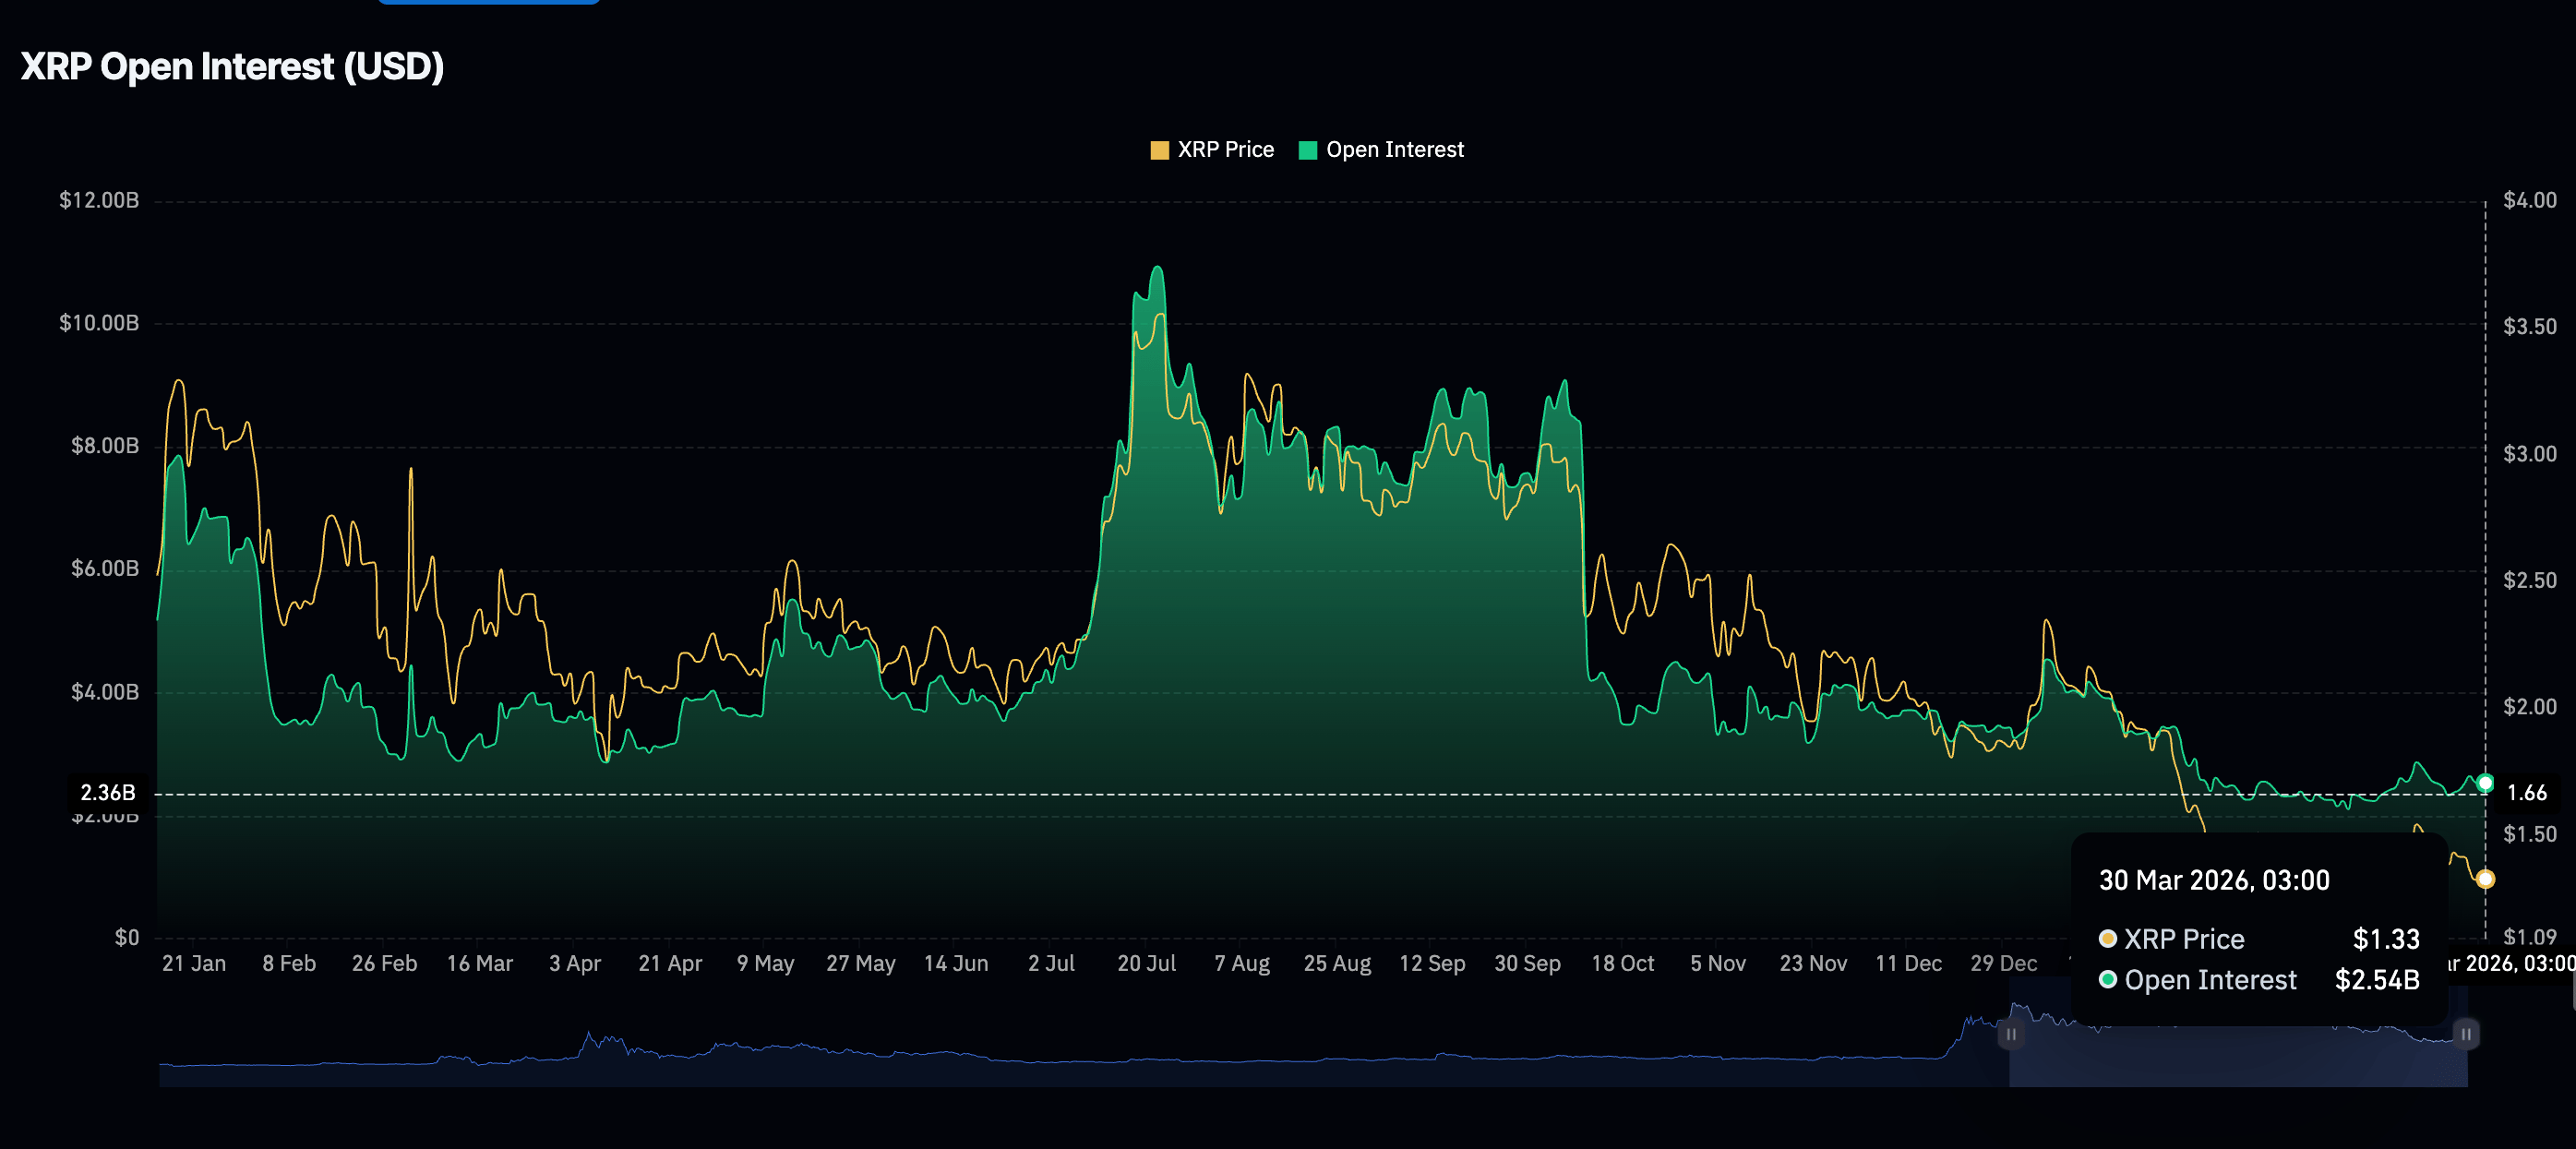
Chart of the day: Bitcoin holds steady above $67,000 support
Bitcoin is trading above $67,000 at the time of writing on Monday. Its near-term bias remains neutral with a slight downside tilt as price fluctuates between last week's low at $65,000 and the 50-day Exponential Moving Average (EMA) at $71,242.
Momentum has generally softened, with the Moving Average Convergence Divergence (MACD) indicator holding below its signal line on the daily chart, suggesting slight bearish pressure. The Relative Strength Index (RSI) near 45 remains below the 50 midline on the same chart, consistent with a market that lacks strong buying conviction but has not yet entered oversold territory.
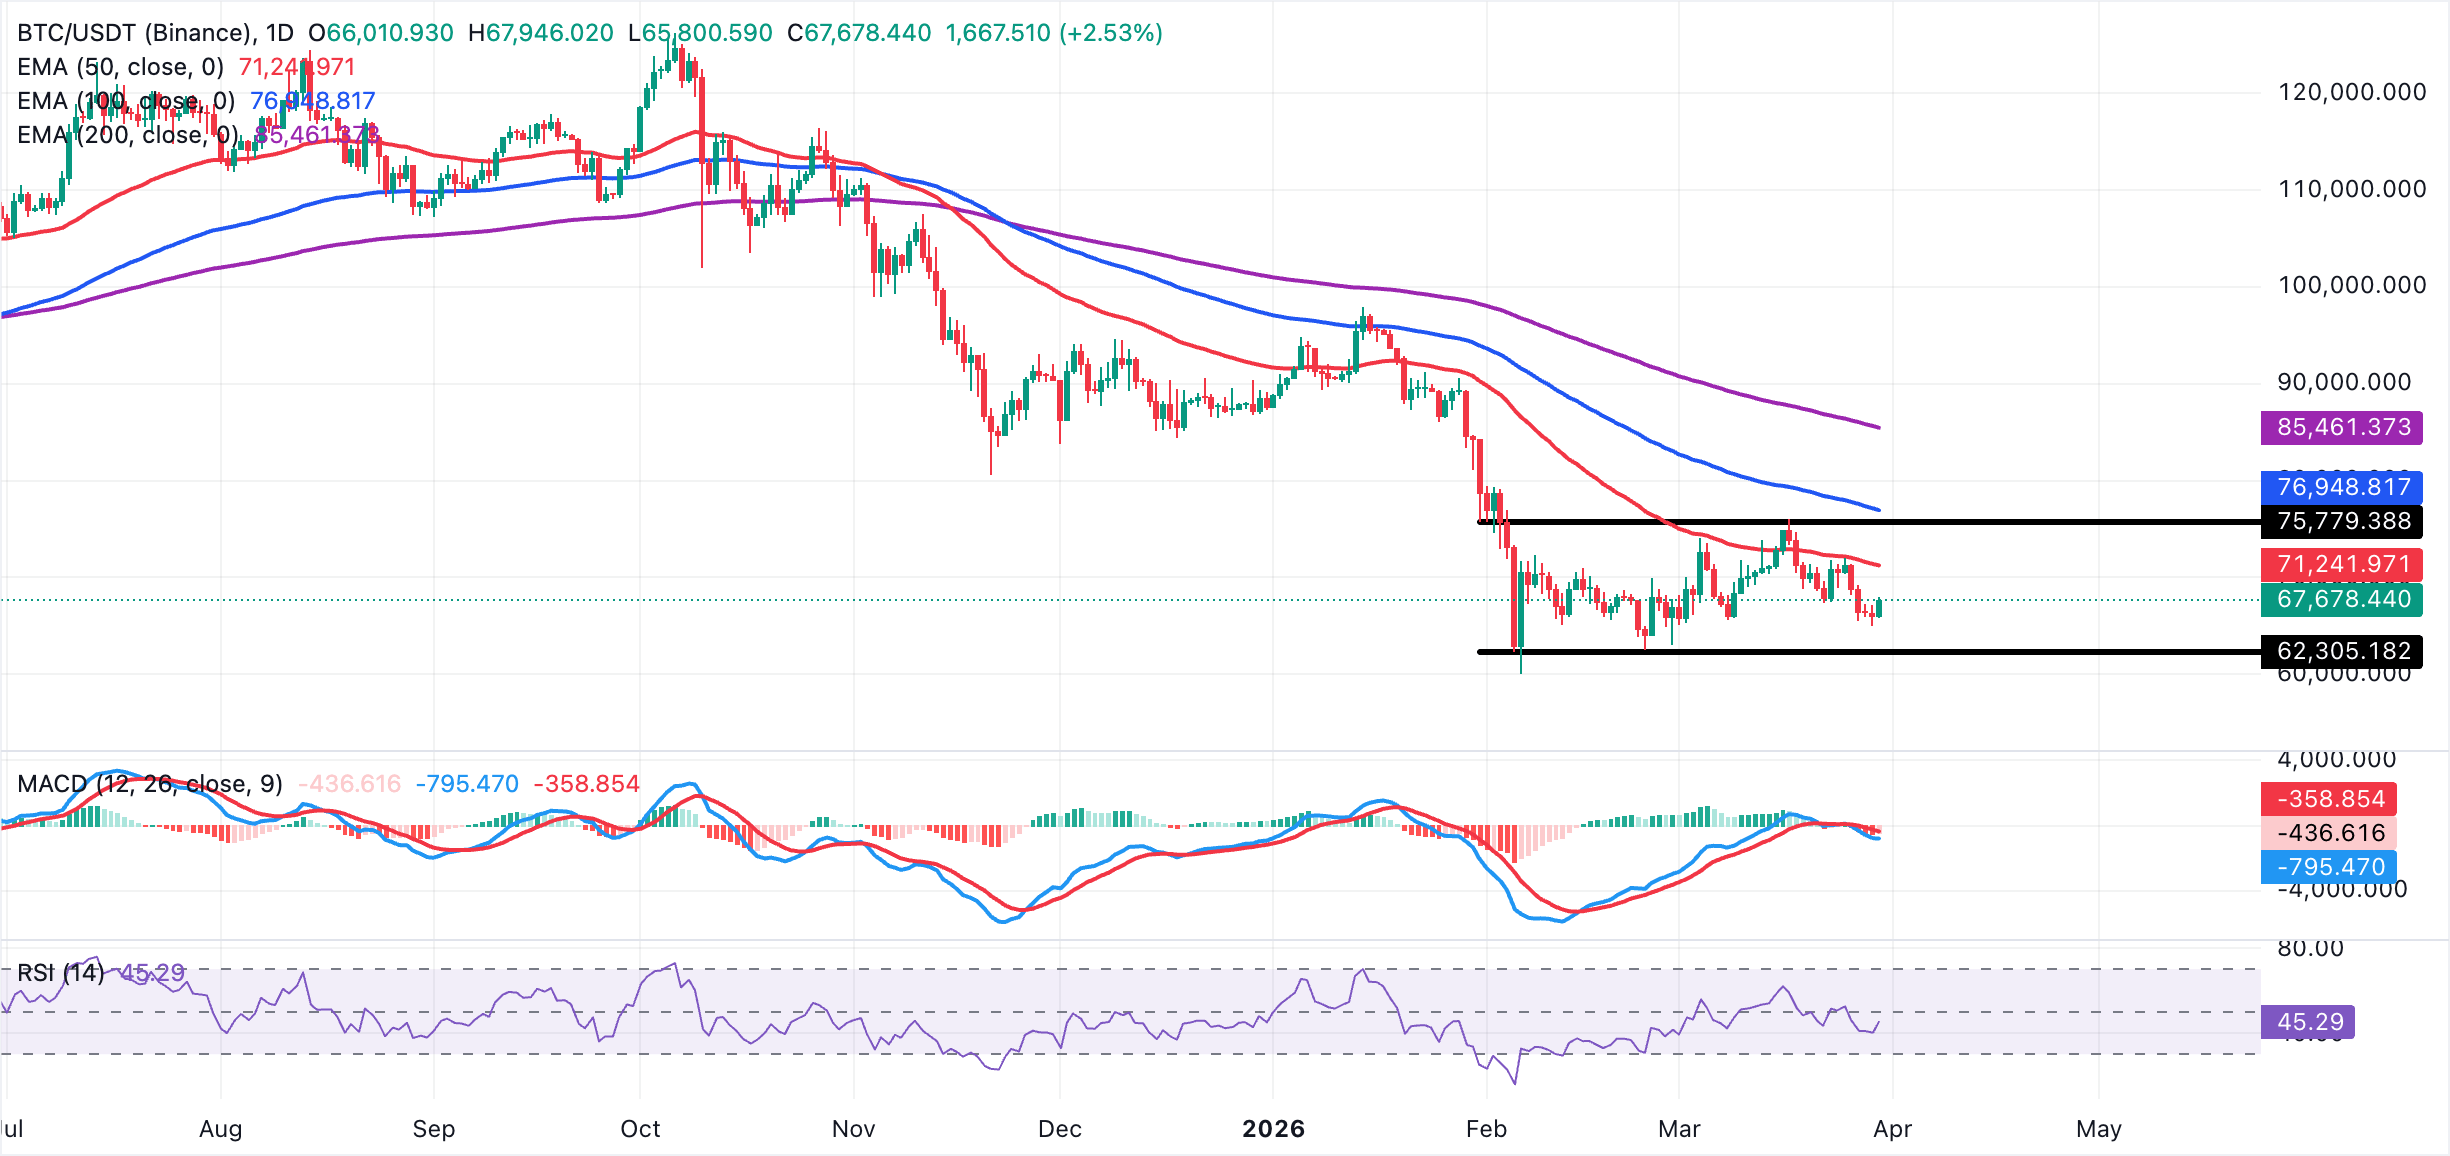
Immediate resistance is seen around $68,000, with stronger barriers aligning with the 50-day EMA at $71,242. A daily close above the moving average would be needed to shift the bias back toward a more decisive bullish phase. On the downside, initial support lies near $66,700, followed by the recent swing low at $65,000, where buyers last stepped in to stabilize the pullback on Sunday. A break below $65,000 would open the door toward deeper retracements, exposing the yearly low at $60,000 and undermining the current consolidative mood.
Altcoins technical outlook: Ethereum and XRP gain as upside pressure eases
Ethereum is up above $2,000 on Monday from last week's correction to $1,939. Despite the knee-jerk recovery, technicals show the smart contract token's near-term bias is neutral-to-bearish, as price remains below the SuperTrend indicator, currently at $2,165. Moreover, the cluster of exponential moving averages remains well above spot, underscoring a broader downtrend.
At the same time, the MACD indicator holds below its signal line and has dipped below the zero line, with red histogram bars, suggesting strengthening bearish momentum. The RSI near 48 stays around the midline, reinforcing a consolidative tone rather than outright capitulation.
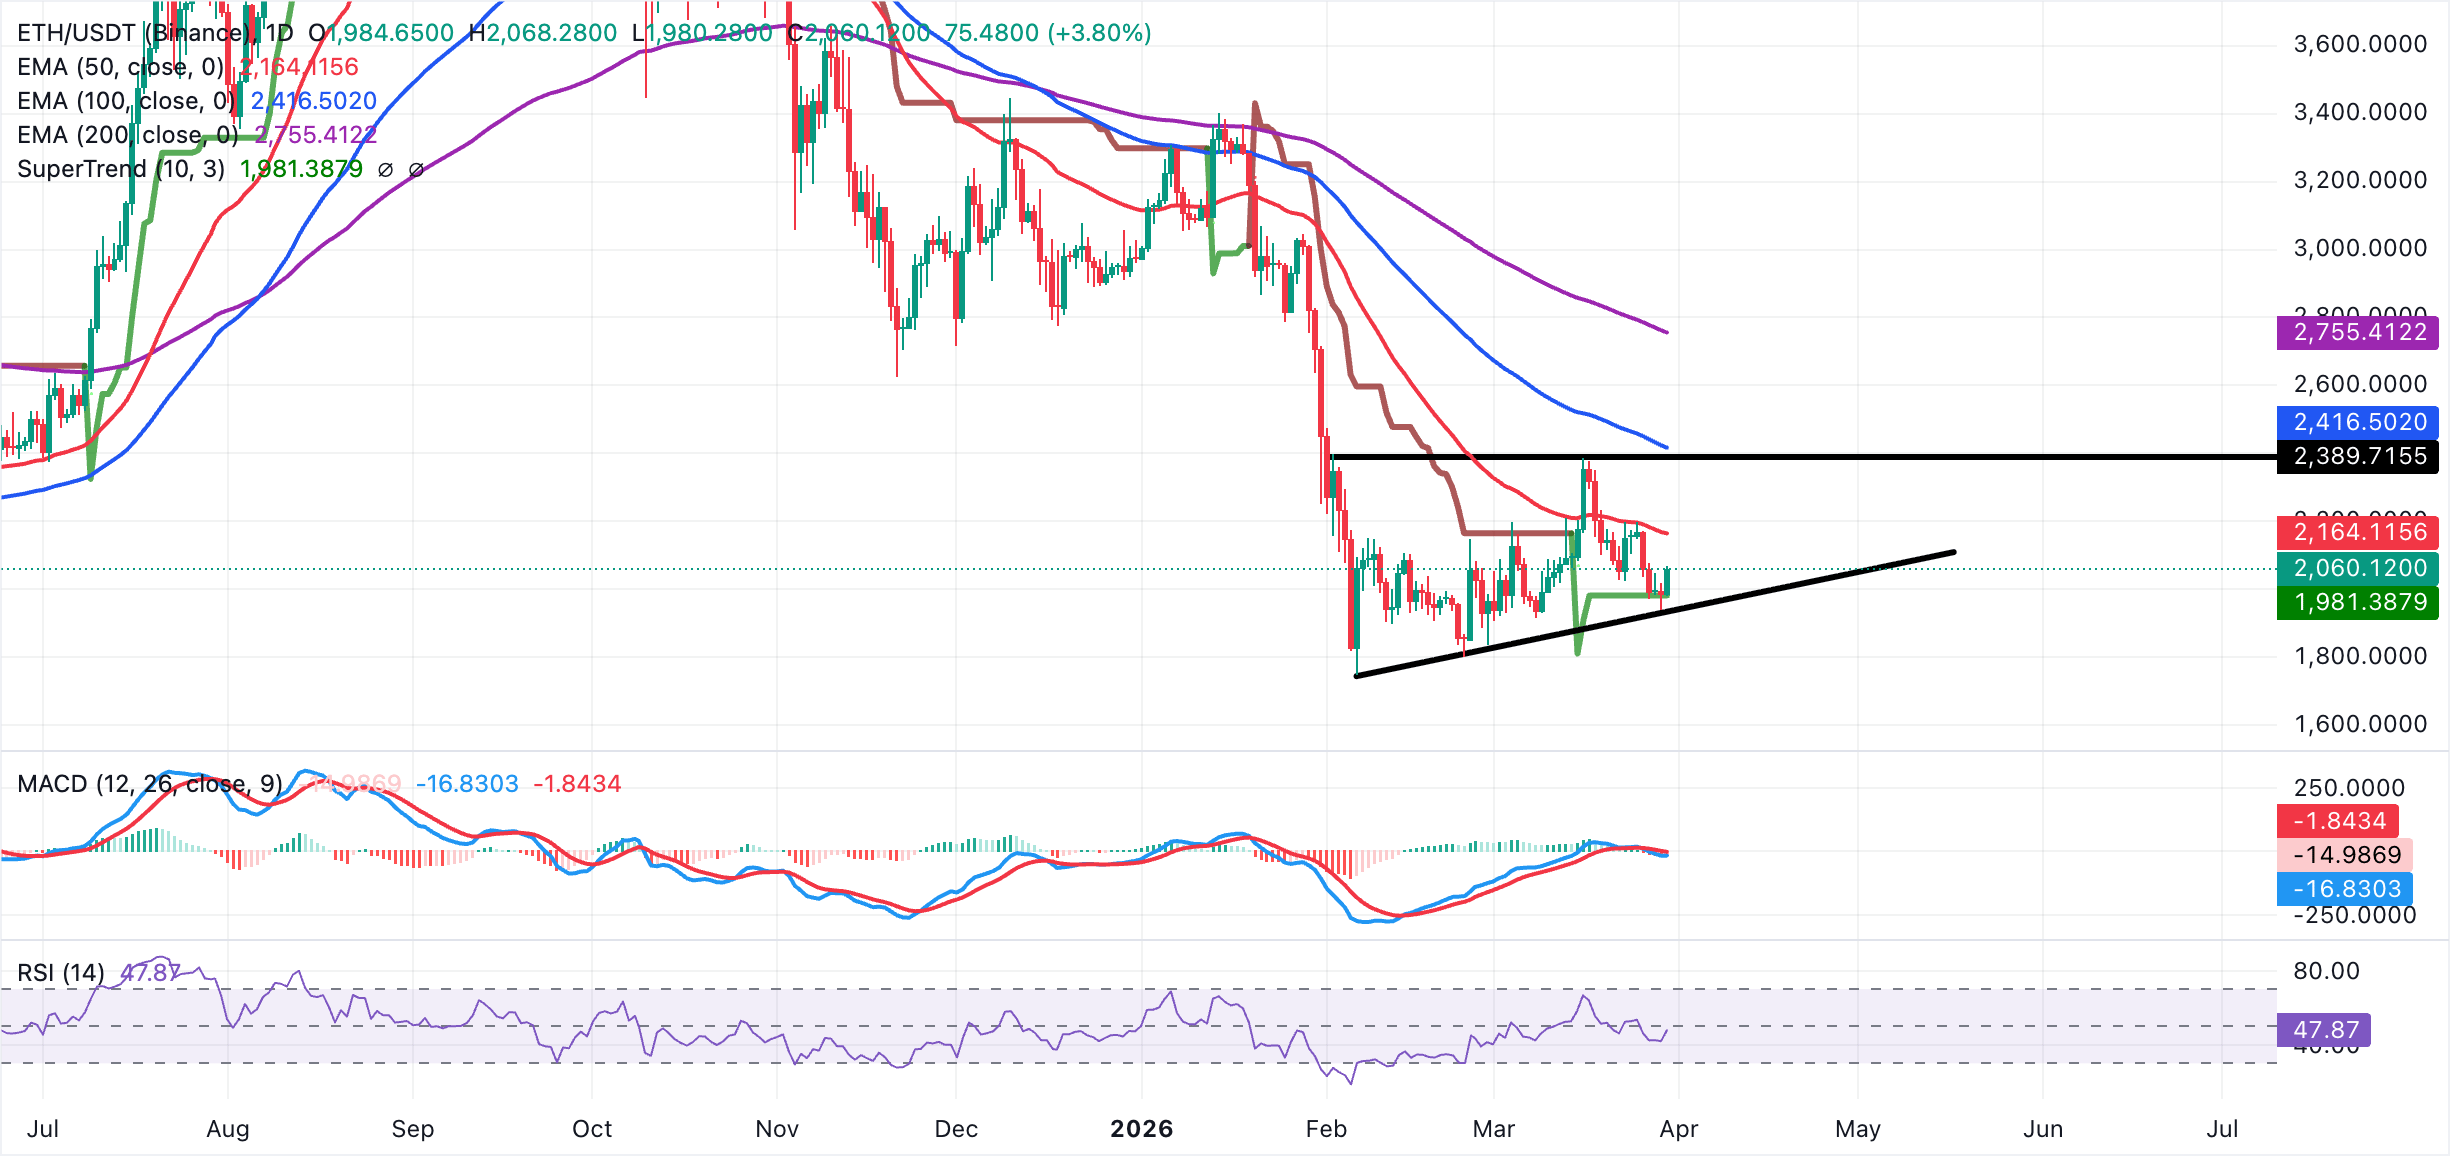
Initial resistance emerges at the 50-day EMA near 2,165, where a close above would be needed to challenge the March high at $2,386 and then the 100-day EMA at $2,417. On the downside, immediate support aligns with the recent swing area low around $1,939, with further protection at the February 28 low of $1,835.
As for XRP, bulls are battling to regain control, pushing the price above $1.36 at the time of writing on Monday. Despite the uptake mirroring gains across the crypto market, XRP's near-term bias is mildly bearish as price holds below the descending 50-day, 100-day, and 200-day EMAs, clustered between $1.46 and $1.90, keeping the broader trend under pressure.
Moreover, the SuperTrend at $1.51 caps the upside and aligns with the moving averages as dynamic resistance, while the MACD indicator sits below the signal line on the daily chart. The expanding red histogram bars could prompt traders to reduce exposure, weakening the tailwind needed to sustain a short-term recovery. Similarly, the RSI on the same chart is at 45 and below the 50 midline, indicating sellers retain a slight momentum edge without reaching oversold conditions.
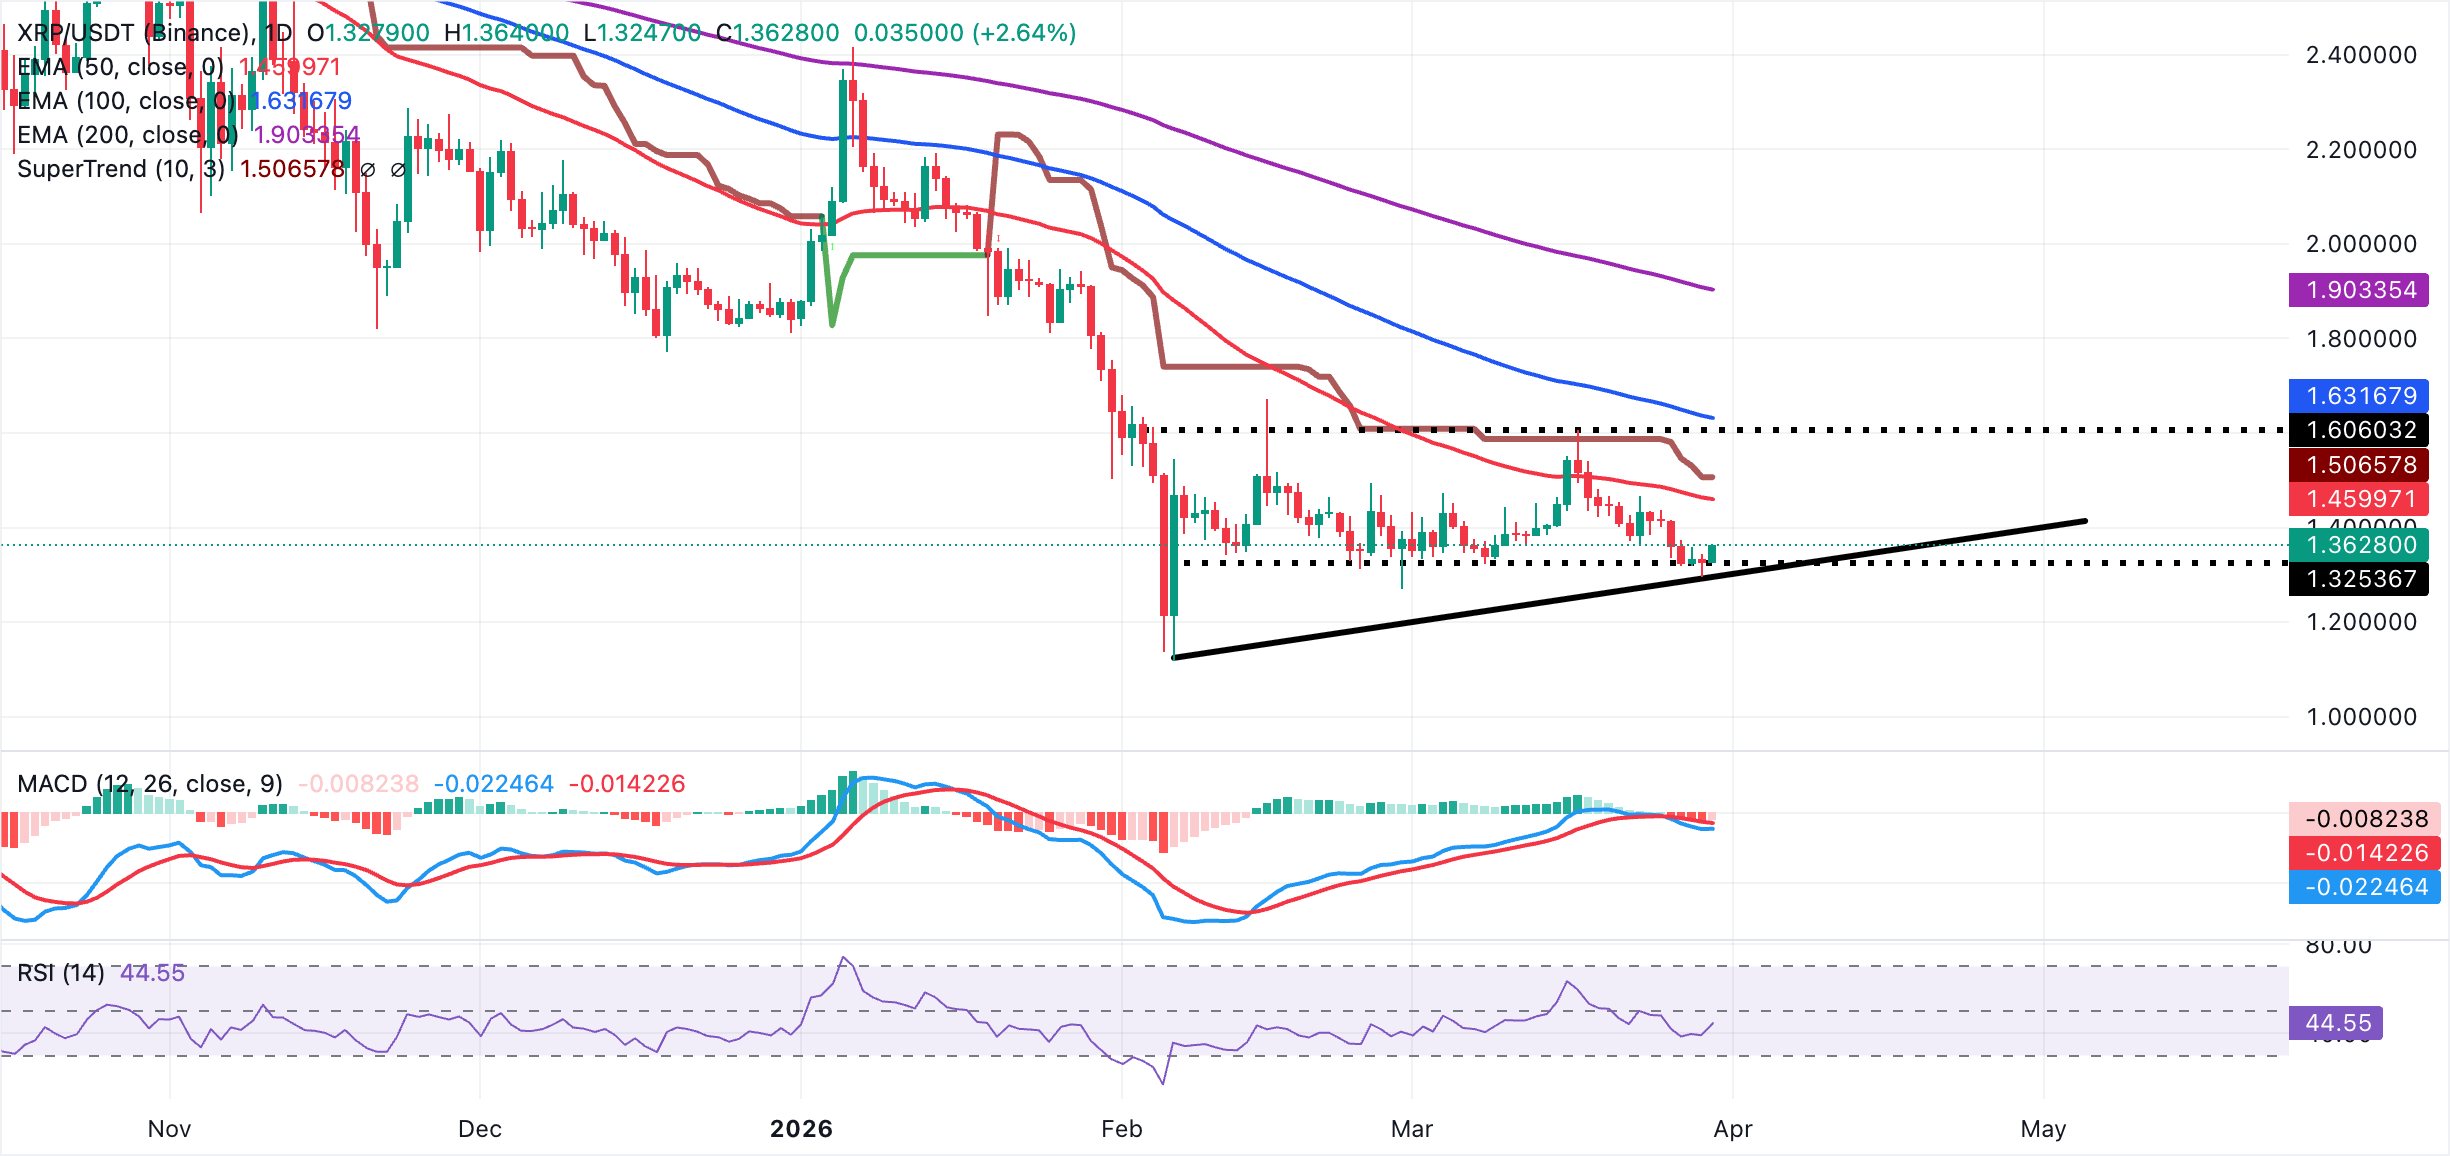
XRP's initial resistance lies at the recent reaction high near $1.40, followed by stronger supply at $1.45 and the SuperTrend zone around $1.51, where rejection would preserve the corrective structure. A daily close above $1.51 would be needed to ease the bearish bias and open the way toward $1.60.
On the downside, immediate support stands at $1.33, ahead of the trendline demand region near $1.30, which acts as the first meaningful floor for dips. A decisive break below $1.30 would expose the next support band toward $1.25, where buyers would be expected to regroup.
Open Interest, funding rate FAQs
Higher Open Interest is associated with higher liquidity and new capital inflow to the market. This is considered the equivalent of increase in efficiency and the ongoing trend continues. When Open Interest decreases, it is considered a sign of liquidation in the market, investors are leaving and the overall demand for an asset is on a decline, fueling a bearish sentiment among investors.
Funding fees bridge the difference between spot prices and prices of futures contracts of an asset by increasing liquidation risks faced by traders. A consistently high and positive funding rate implies there is a bullish sentiment among market participants and there is an expectation of a price hike. A consistently negative funding rate for an asset implies a bearish sentiment, indicating that traders expect the cryptocurrency’s price to fall and a bearish trend reversal is likely to occur.
(The technical analysis of this story was written with the help of an AI tool.)

100만 명이 넘는 사용자가 FXStreet를 통해 실시간 시장 데이터, 차트 도구, 전문가 인사이트, 포렉스 뉴스를 이용합니다. 포괄적인 경제 캘린더와 교육 웨비나는 트레이더가 정보를 유지하고 신중한 결정을 내리도록 돕습니다. FXStreet는 바르셀로나 본사와 전 세계 지역에 걸쳐 약 60명의 팀으로 구성되어 있습니다.
더 읽기


