
Crypto Today: Bitcoin, Ethereum, XRP trim breakout gains as focus shifts to Fed decision
작성자 John Isige
수정됨: 17 Jun 2026


인기 기사

Cryptocurrency prices broadly decline as investors show caution toward risk assets ahead of the Federal Reserve’s (Fed) interest rate decision on Wednesday. Bitcoin (BTC) holds around $65,000 after correcting from its Monday high of $67,292.
- Bitcoin extends correction near $65,000, as investors await interest rate decision from Kevin Warsh’s first FOMC meeting as Fed Chair.
- Ethereum pulls back after a rejection at the $1,800 supply level despite mild ETF inflows.
- XRP edges lower below $1.20, pressured by a broader bearish trend and declining major EMAs.
Cryptocurrency prices broadly decline as investors show caution toward risk assets ahead of the Federal Reserve’s (Fed) interest rate decision on Wednesday. Bitcoin (BTC) holds around $65,000 after correcting from its Monday high of $67,292. Altcoins, including Ethereum (ETH) and Ripple (XRP), are generally mirroring Bitcoin’s slide, trading below $1,800 and $1.20, respectively.
Bitcoin, Ethereum, XRP falter as markets price in a Fed rate hold
Crypto participants remain cautious ahead of the Fed’s monetary policy decision, which is generally expected to leave interest rates unchanged. Investors are pricing in a near-100 % chance that the Federal Open Market Committee (FOMC) will hold rates in the 3.50%-3.75% range.
The announcement marks Kevin Warsh’s first interest rate adjustment decision as the Fed Chair. Warsh’s four-year term began in May. The decision arrives amid the highest inflation in the United States (US) in three years and ahead of the signing of the US-Iran peace agreement on Friday.
Market participants will be on the lookout for Warsh’s press conference after the meeting for clues regarding the timing of future policy direction. The interest rate trajectory remains a key factor influencing risk assets, given its impact on liquidity and risk-taking appetite.
The West Texas Intermediary (WTI) shows easing Oil prices to $75 on Wednesday, down from approximately $85 on Sunday. Following the signing ceremony, the US and Iran will move to reopen the Strait of Hormuz and remove the blockade on Iranian ports.
Iran’s foreign minister stated on Tuesday that the next round of negotiations will start on Friday, with talks expected to continue for 60 days to reach a final agreement that will include nuclear issues and the lifting of sanctions.
In the meantime, leaders of the G7 countries released a joint statement on Wednesday, stating that they will make deliberate efforts to diversify energy supply routes and reduce reliance on the Strait of Hormuz. The war in the Middle East triggered a sharp rally in Oil and Gas prices as supply disruptions fueled market volatility.
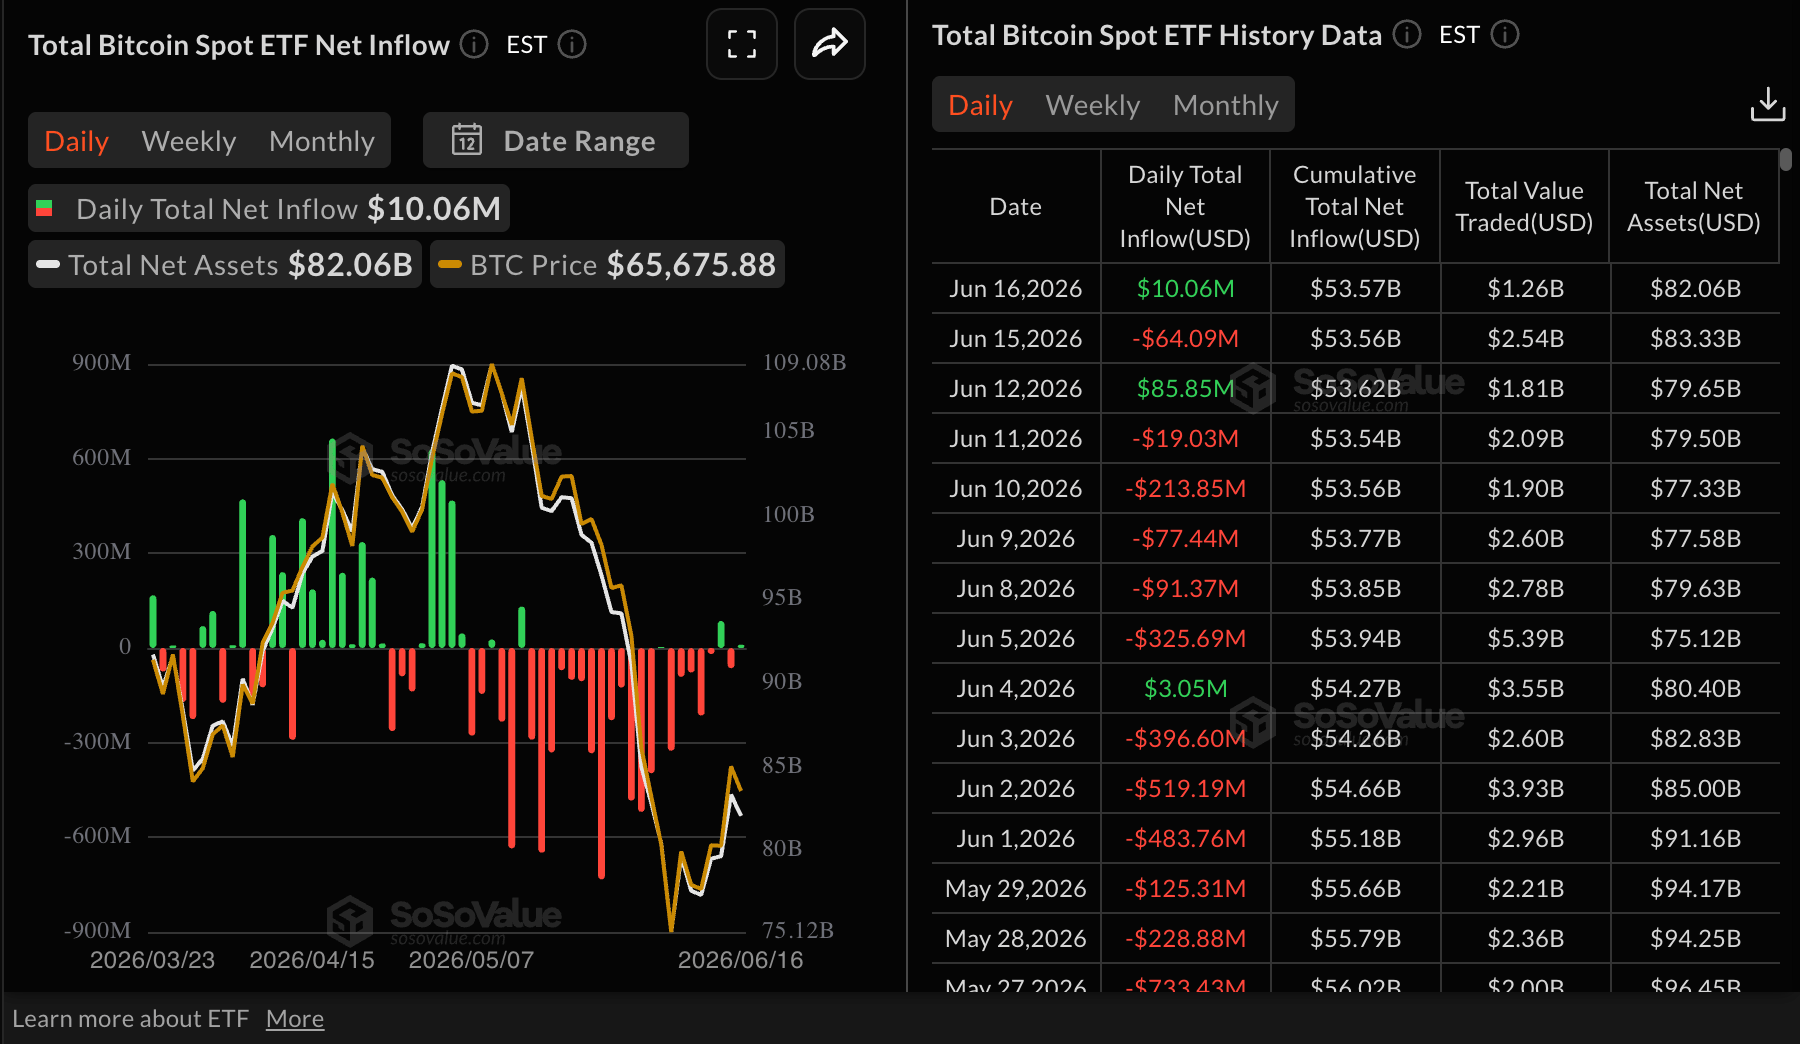
Investors are cautious ahead of the FOMC meeting and the signing of the US-Iran Memorandum of Understanding (MoU). Mild inflows into Bitcoin spot Exchange-Traded Funds (ETFs) were recorded, totaling $10 million on Tuesday. This marks a notable increase of roughly $64 million in outflows seen on Monday.
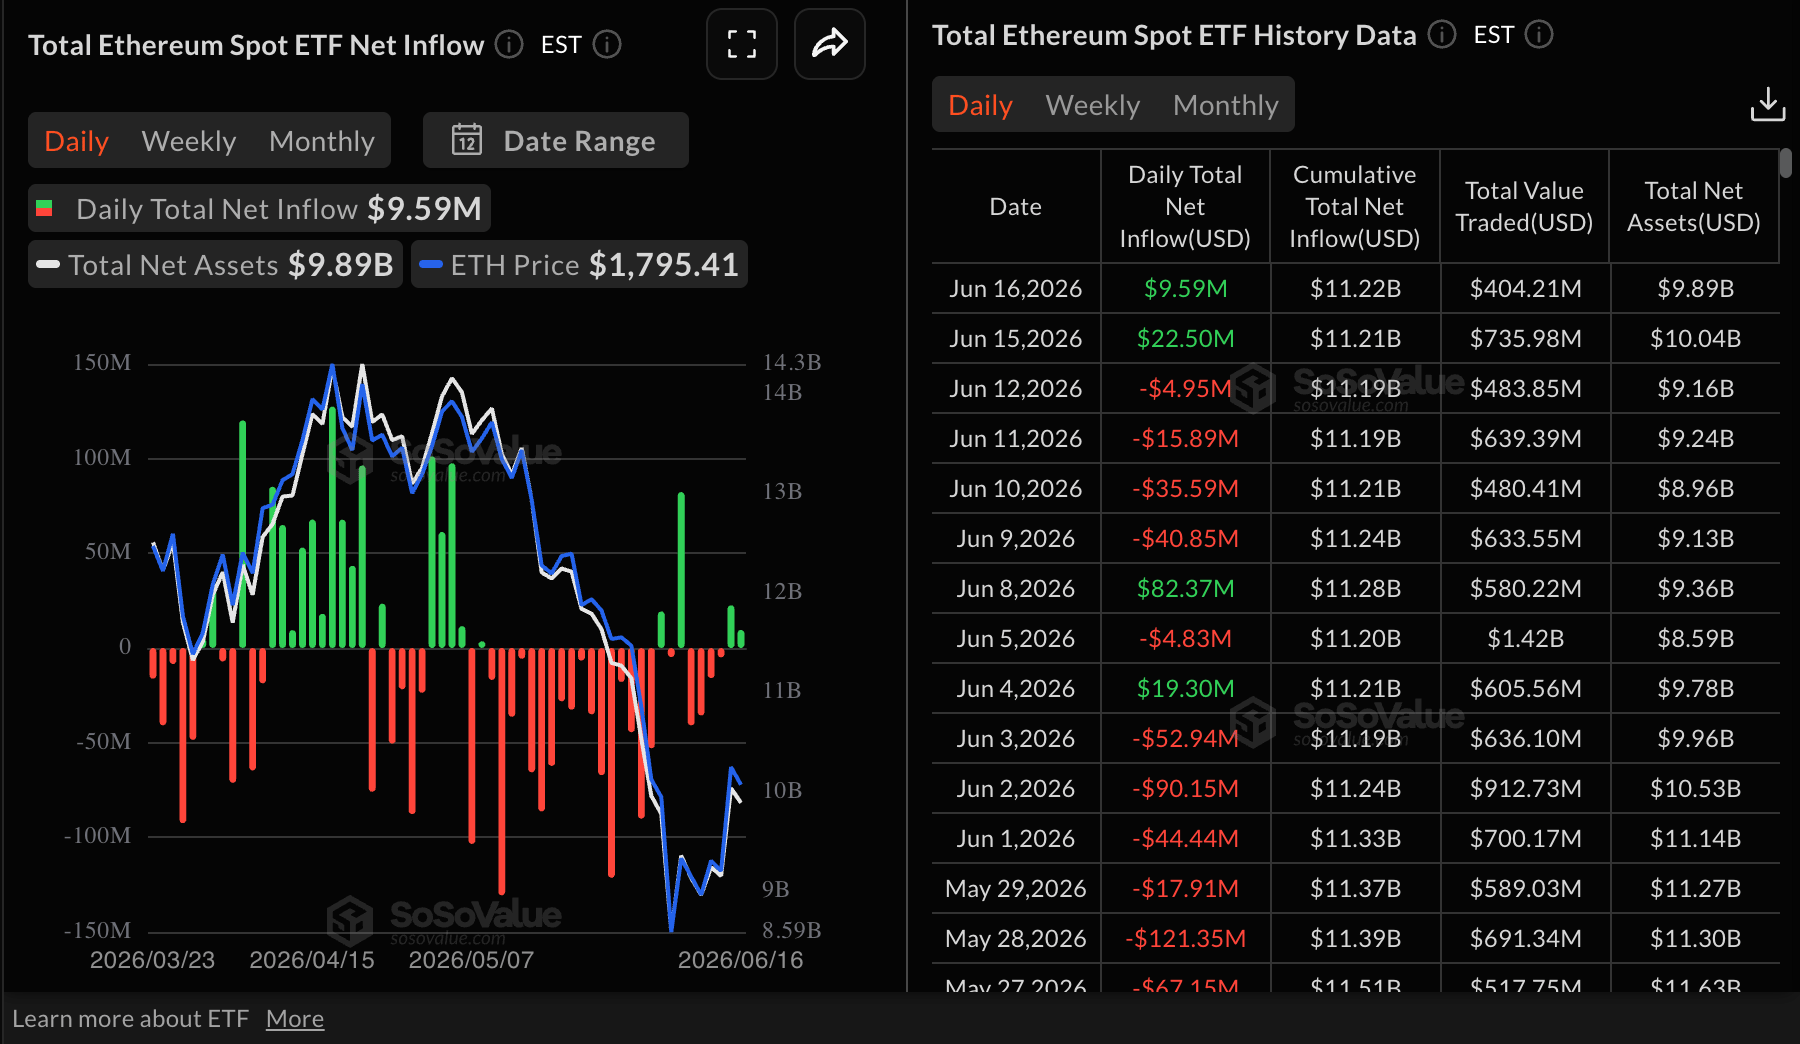
Ethereum spot ETFs extended a two-day bullish streak, with mild inflows of nearly $10 million on Tuesday and almost $23 million on Monday. Cumulative inflows stand at $11.22 billion, increasing slightly from $11.21 billion in the same period. Total assets under management average $9.89 billion, according to SoSoValue data.
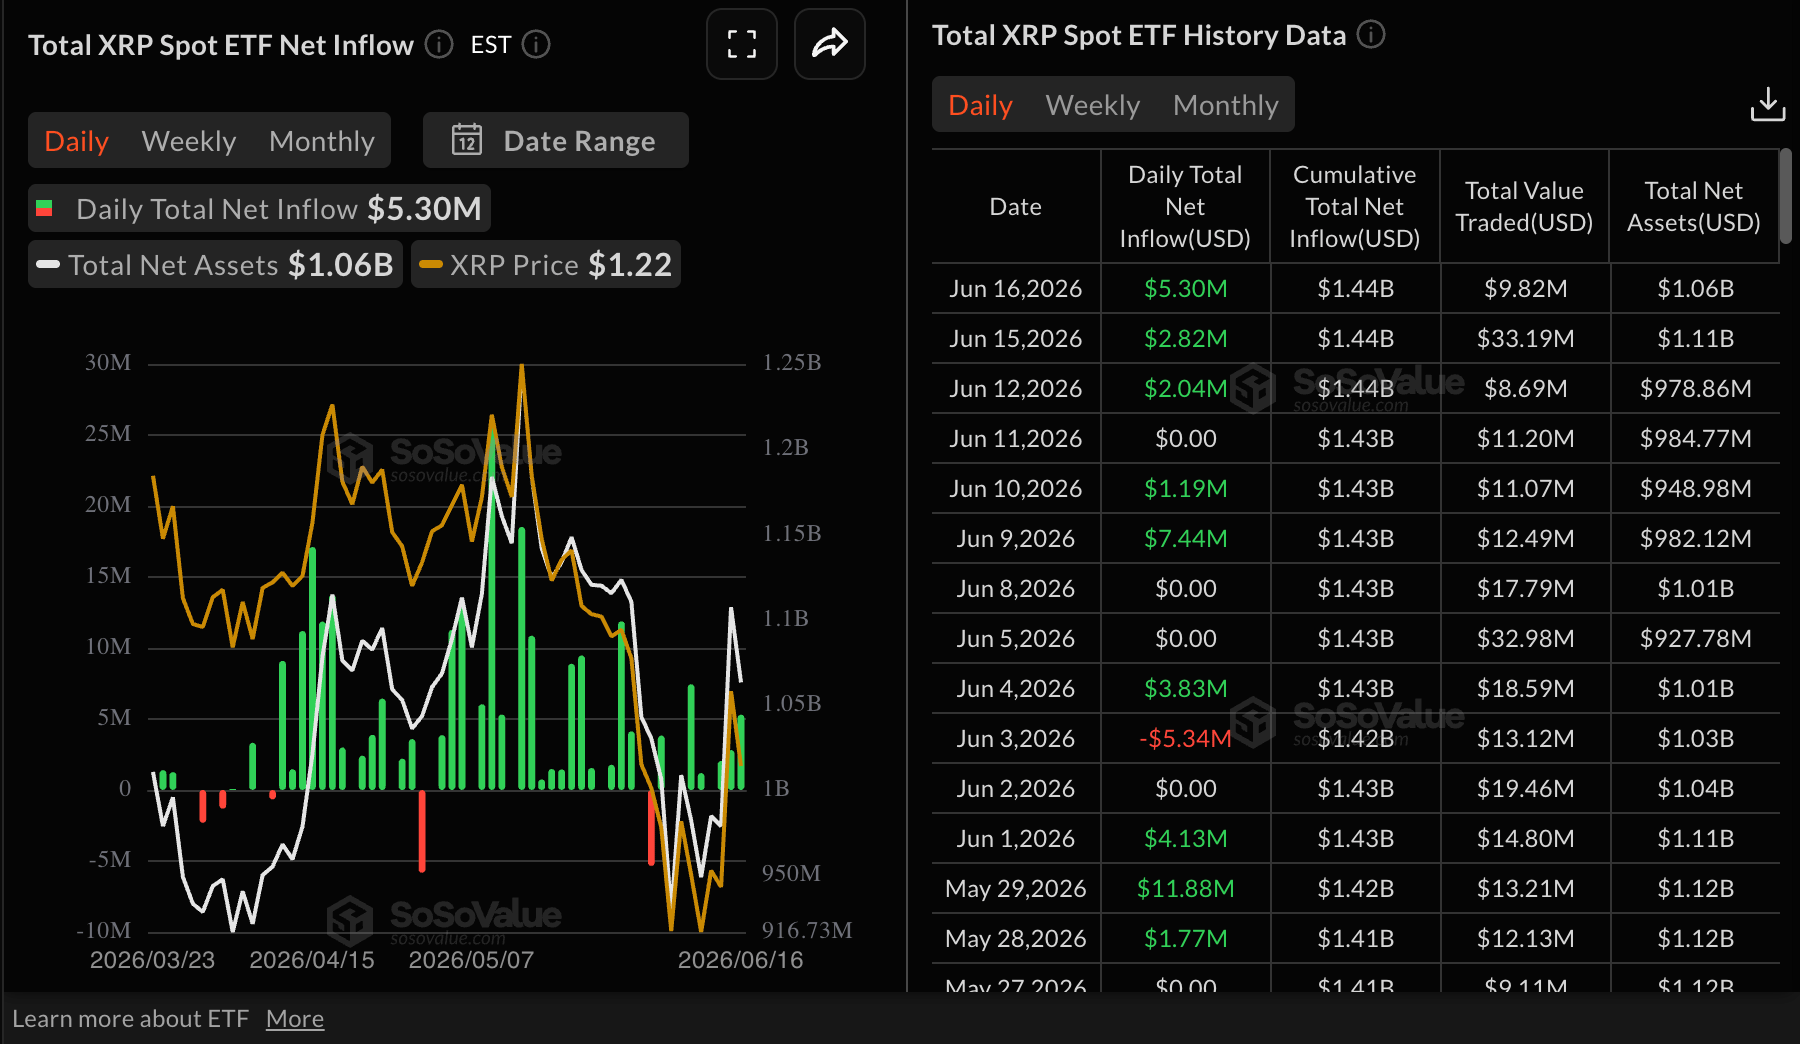
Institutional interest in XRP holds steady, with inflows into spot ETFs totaling approximately $5 million on Tuesday, up from $2.82 million on Monday and $2.04 million on Friday. Cumulative inflows steadied at $1.44 billion, with net assets under management holding slightly above $1 billion.
Despite the outflows, Simon-Peter Massabni, XS.com’s Head of Business Development, states that “institutional participation remains significantly higher than in previous cryptocurrency market cycles.”
Price analysis: Bitcoin extends consolidation at key support
Bitcoin trades below $65,000, extending its decline from highs above $67,000. The pair holds a capped, near-term bearish bias as the spot price lingers well below the 50-day, 100-day and 200-day Exponential Moving Averages (EMAs) at roughly $70,297, $73,011 and $78,373 respectively, underscoring a dominant overhead supply layer despite a recovering tone in momentum.
The Moving Average Convergence Divergence (MACD) histogram is expanding in positive territory on the daily chart, while the Money Flow Index (MFI) lifts toward the mid-40s, which together suggest that recent buying interest is yet strong enough to challenge the prevailing downside structure.
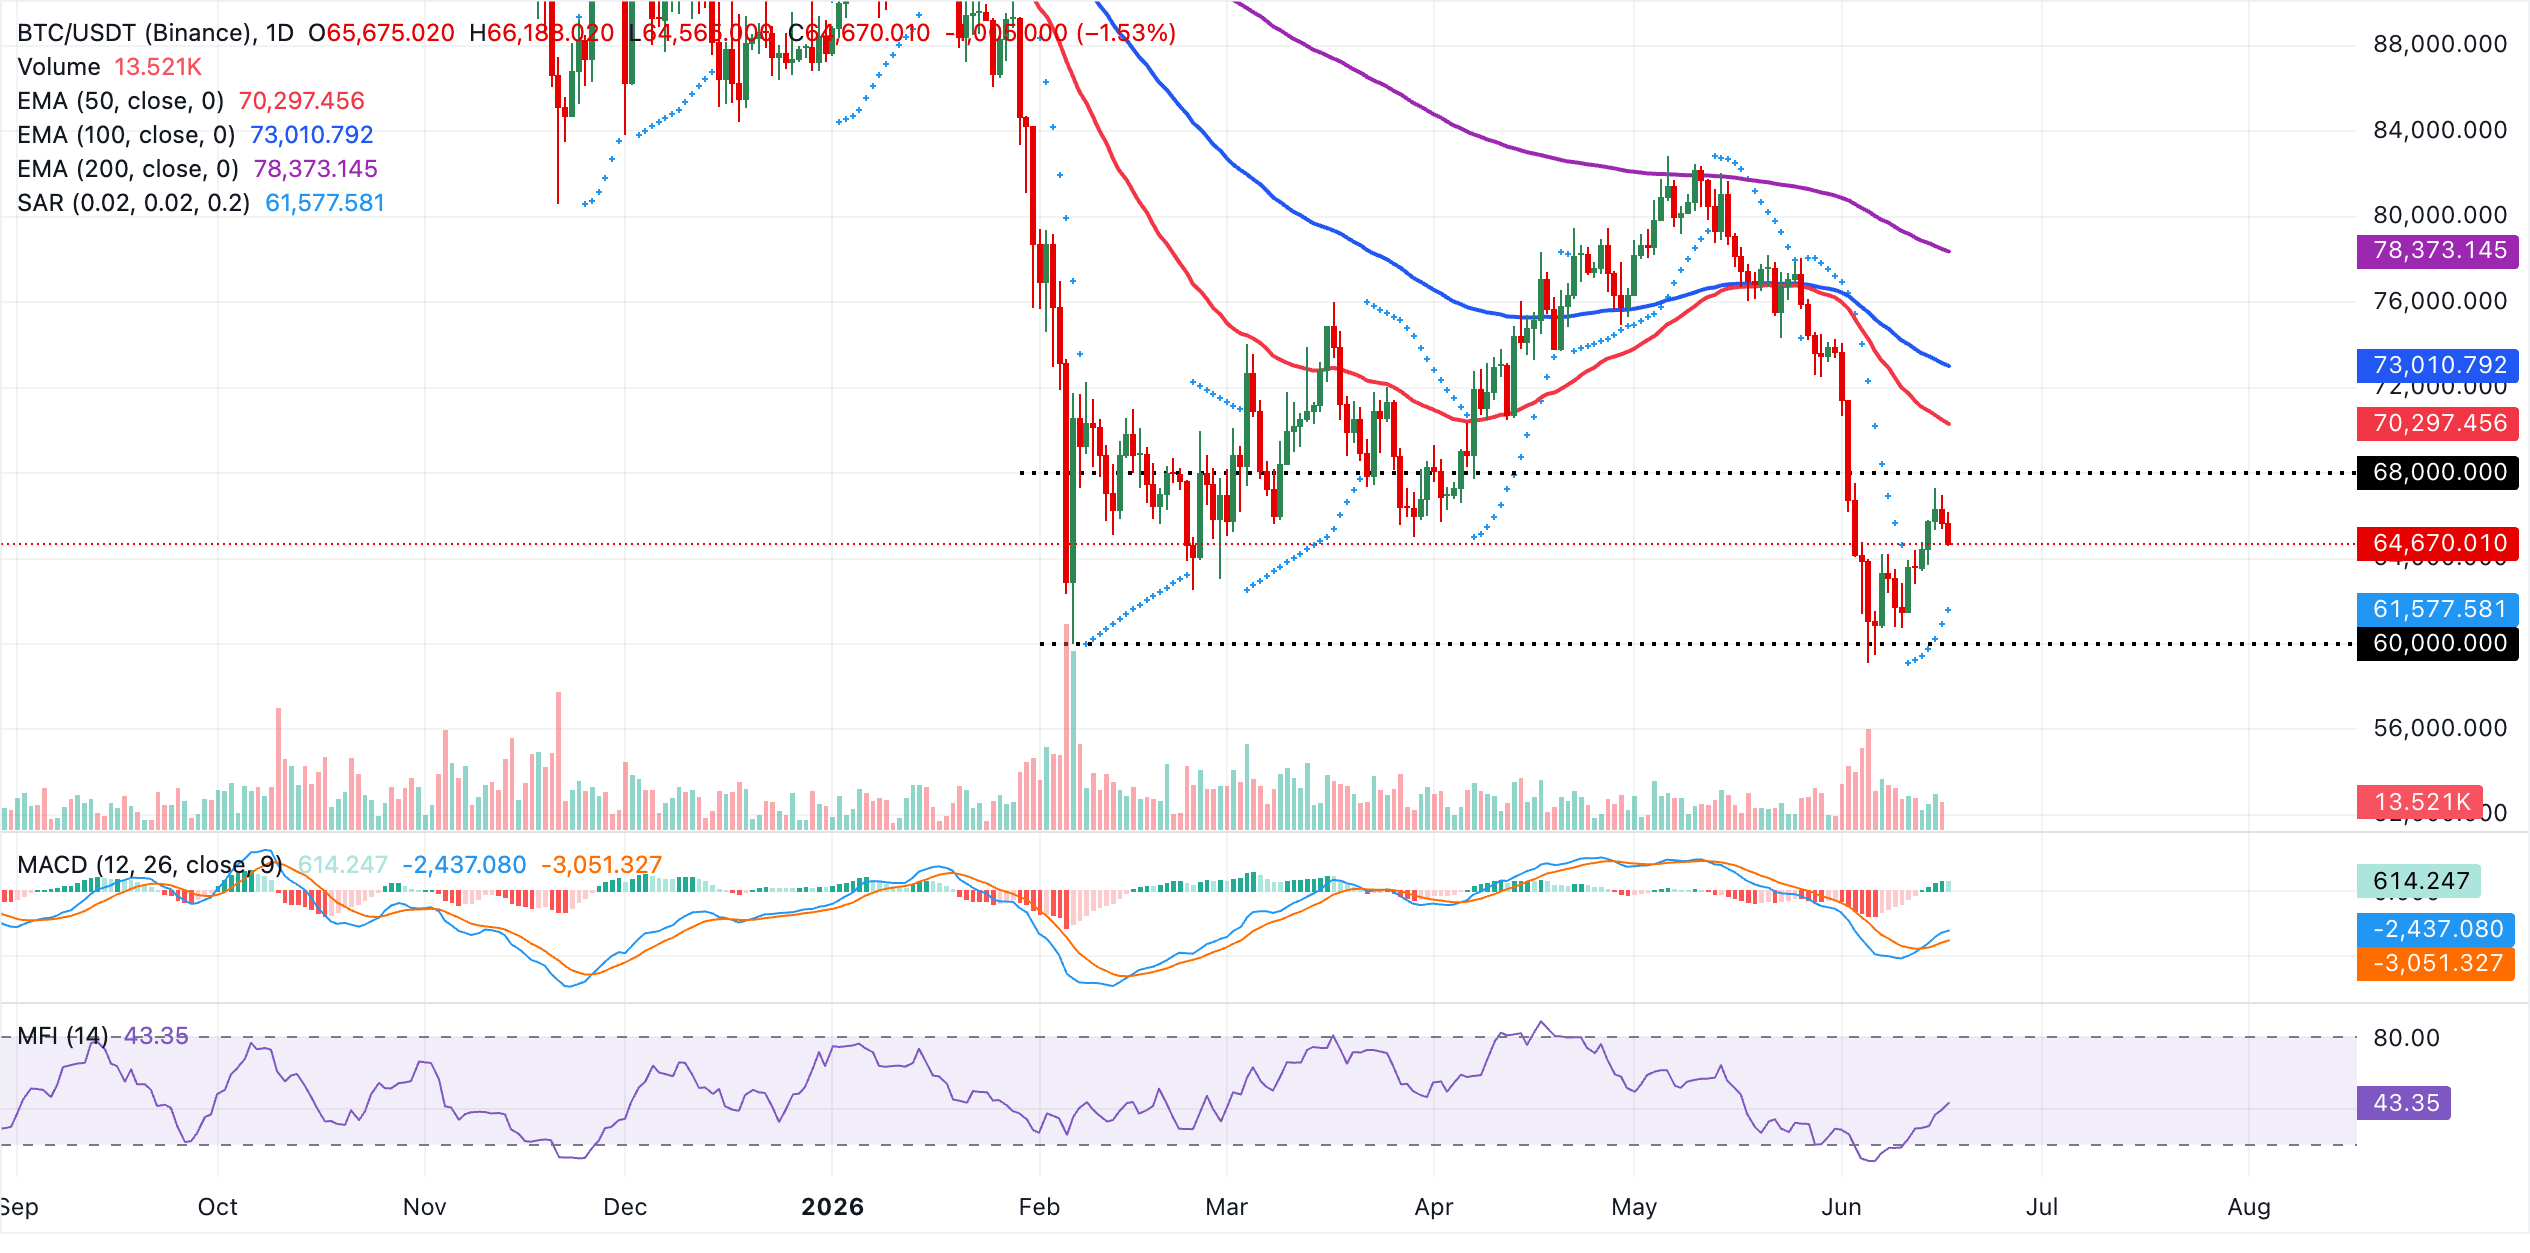
On the topside, immediate resistance is seen at the 50-day EMA near $70,297, followed by the 100-day EMA around $73,011 and then the 200-day EMA close to $78,373, levels that would need to be decisively reclaimed to ease the current bearish pressure.
Looking down, initial support emerges from the Parabolic SAR at about $61,578, where a break lower would expose a deeper retracement toward prior lows below $60,000. Still, holding above this trailing support would keep the door open for further consolidation beneath the clustered EMA band.
Altcoins technical outlook: Ethereum and XRP face headwinds
Ethereum trades at $1,766, keeping a bearish near-term bias as price holds well below the 50-day, 100-day and 200-day EMAs, which collectively cap the upside. The Parabolic SAR now trails below price around $1,582 on the daily chart, suggesting the recent bounce is still intact, while a positive MACD histogram and the MFI near 46 hint that downside momentum is easing.
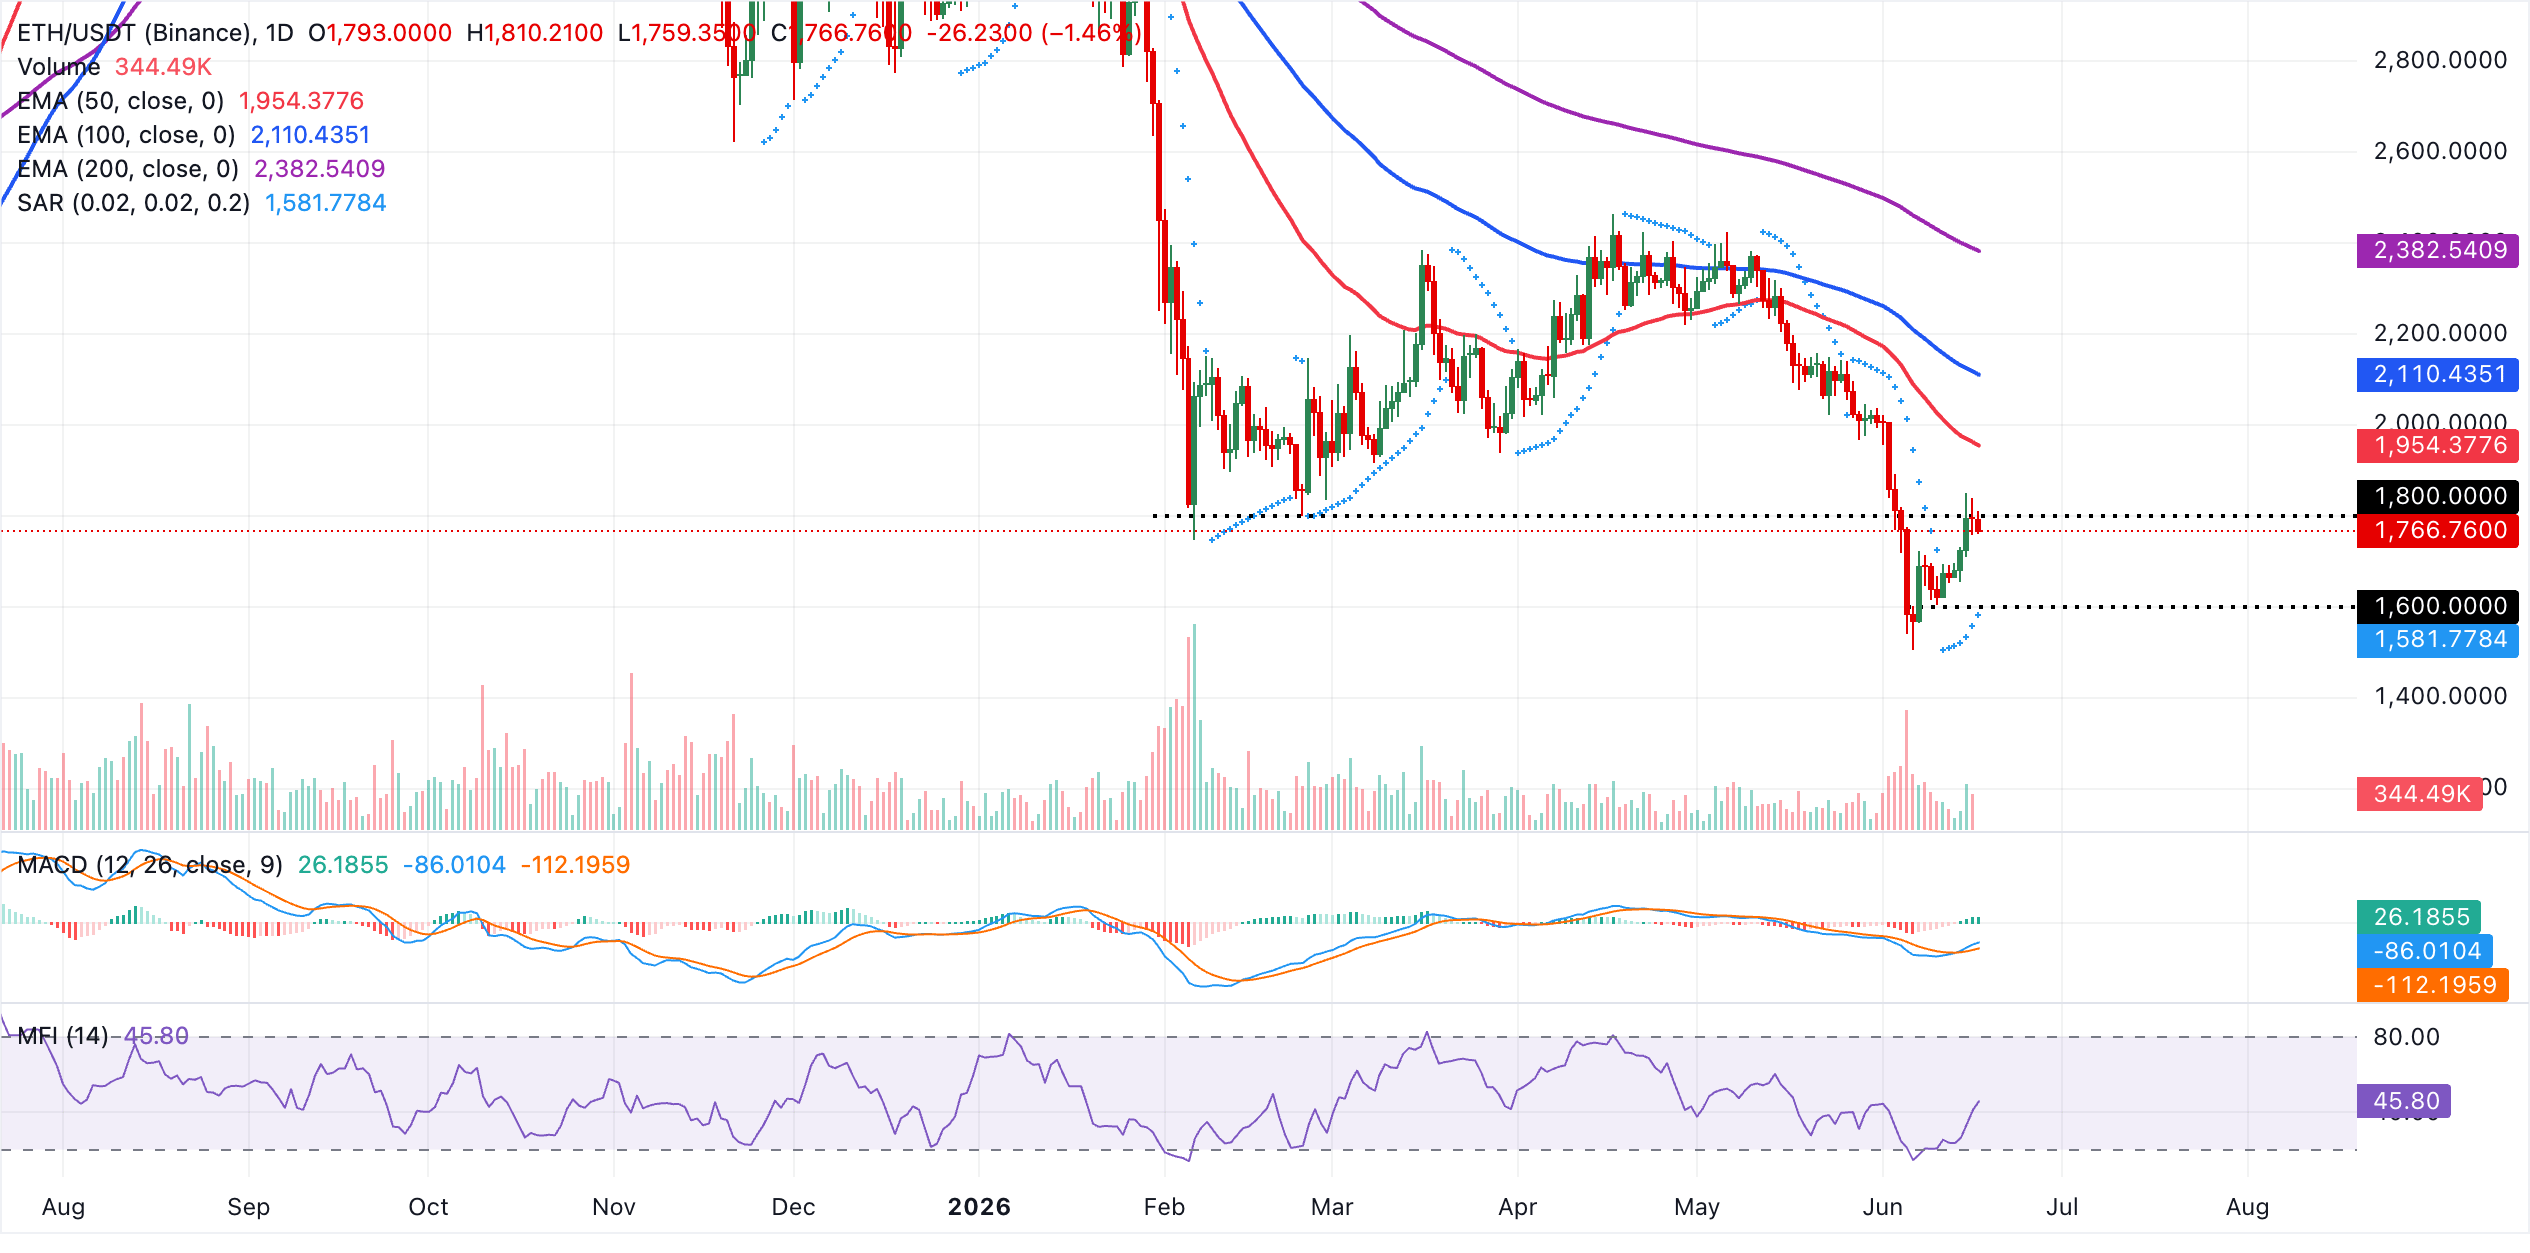
On the topside, initial resistance aligns with the 50-day EMA near $1,954, followed by a more significant cap at the 100-day EMA around $2,110, with the 200-day EMA higher up near $2,383 marking a broader bearish threshold. On the downside, the Parabolic SAR level at roughly $1,582 offers the first layer of support, and a clear break back below this point would likely reopen the path toward lower lows near $1,500 despite the recent improvement in short-term momentum signals.
XRP, on the other hand, trades at $1.19, maintaining a broadly bearish context as price holds well below the 50-day, 100-day and 200-day EMAs, which fan out overhead and suggest the broader downtrend is intact despite the latest rebound.
The Parabolic SAR now trails price at $1.07, hinting at an attempt to stabilize above recent lows, while the MACD histogram has turned marginally positive on the daily chart, suggesting improving short-term momentum even as the MFI lingers below the 50 line.
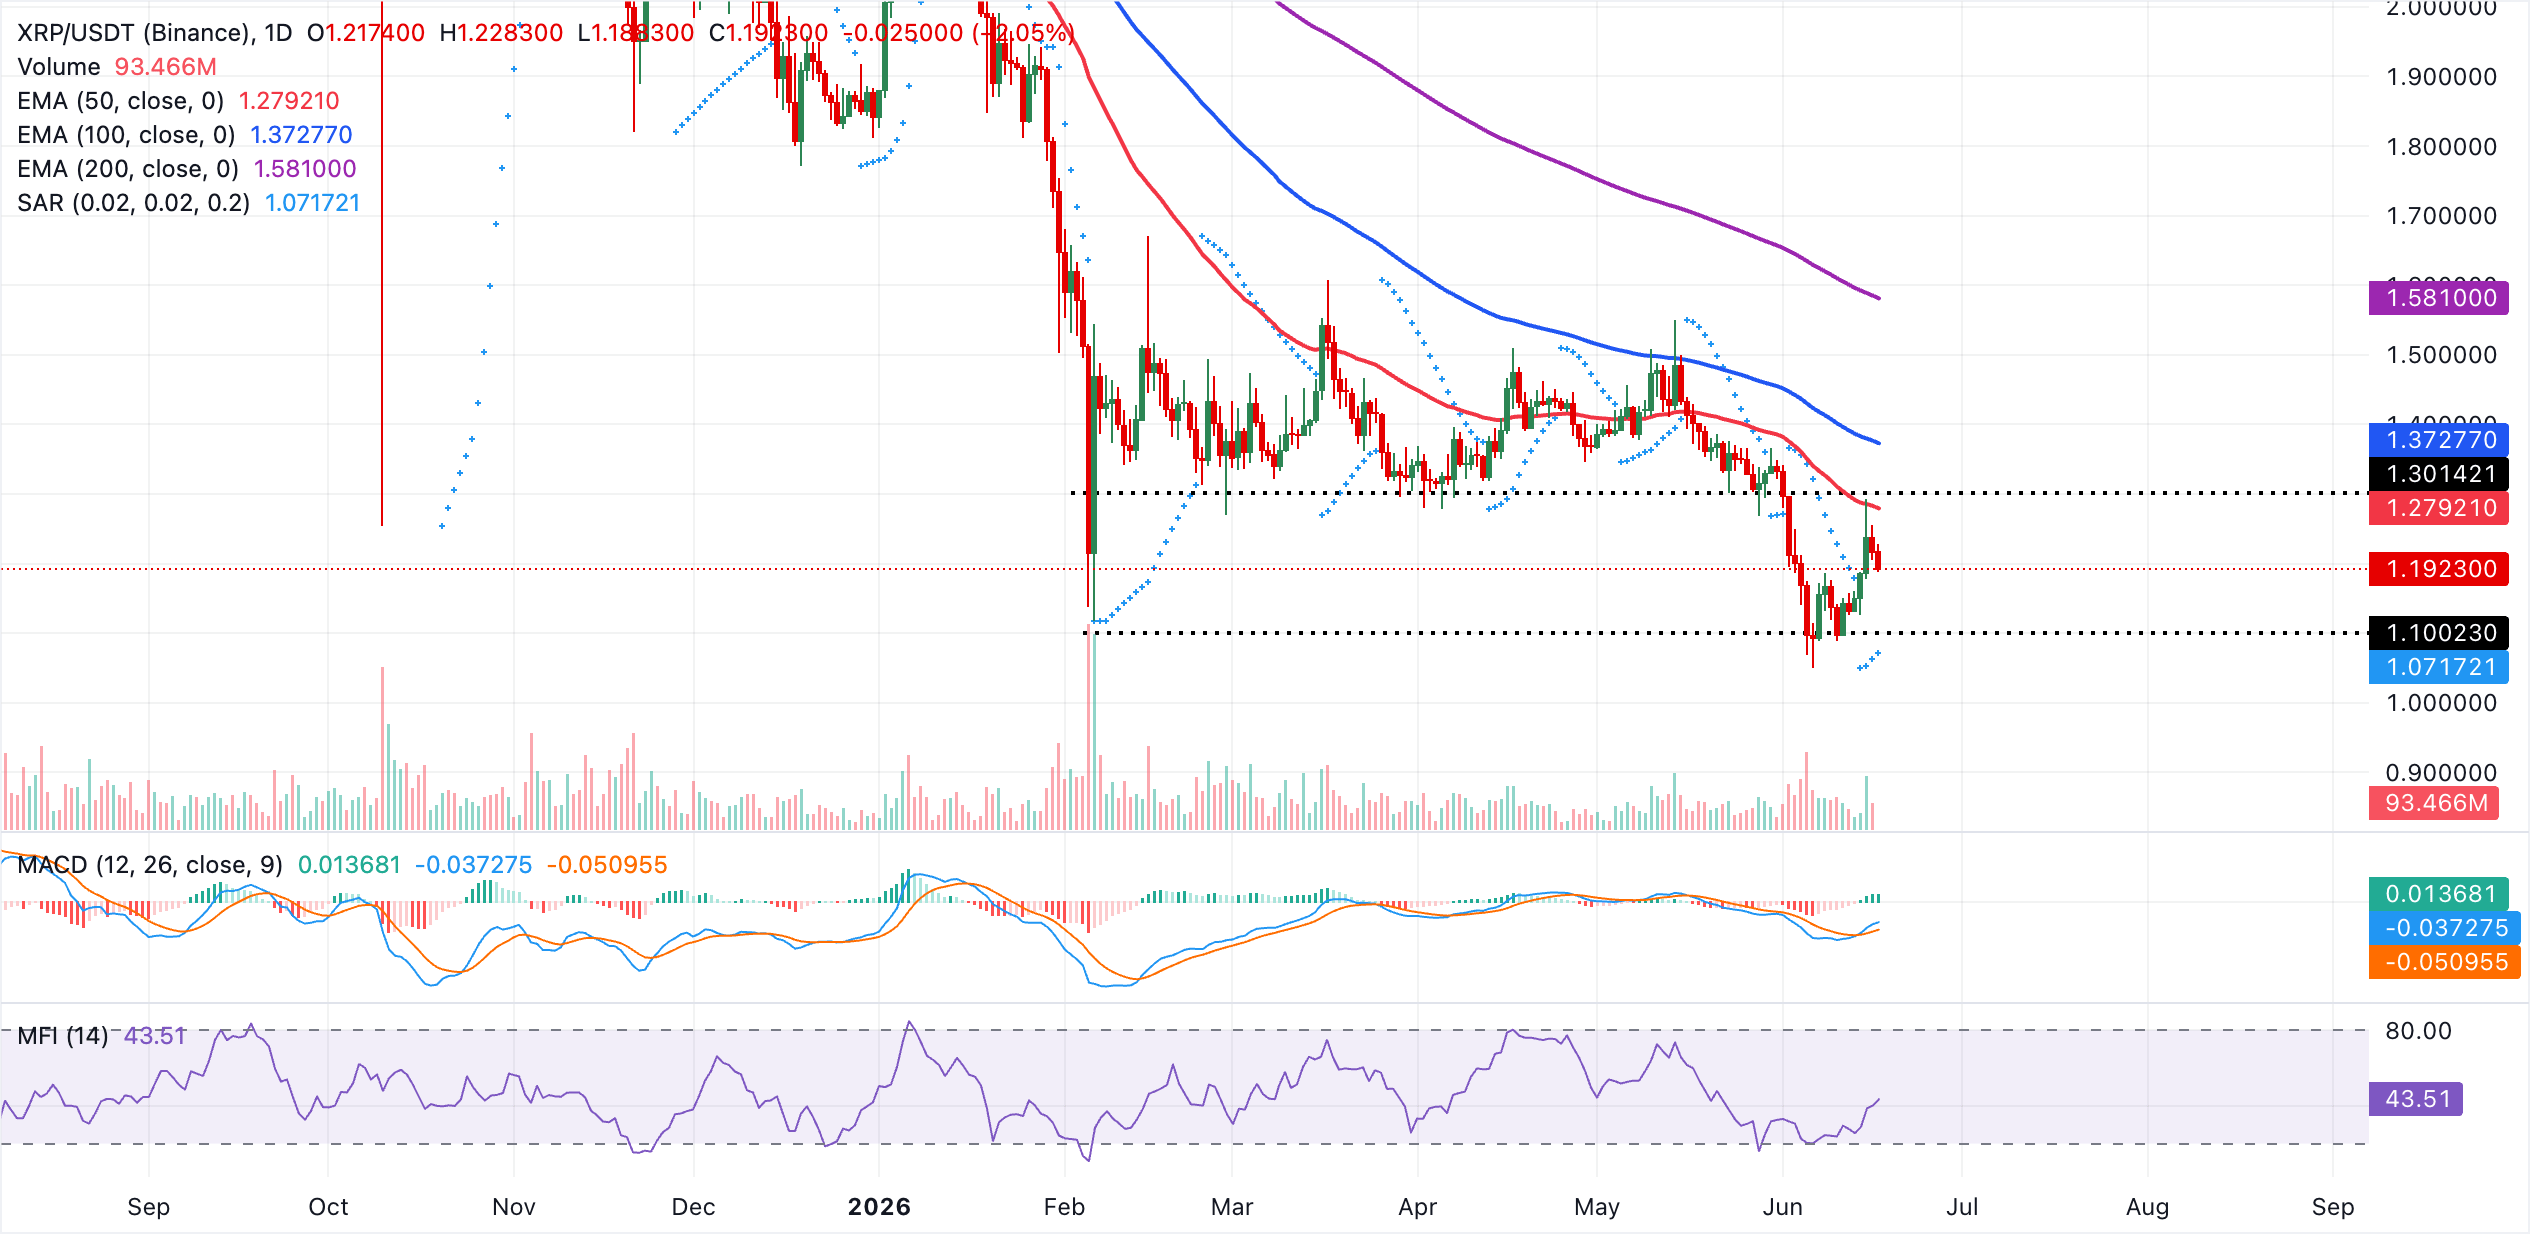
Looking up, initial resistance is seen at the 50-day EMA around $1.28, with the 100-day EMA near $1.37 and the 200-day EMA at $1.58 forming successive caps that would need to be reclaimed to ease the broader bearish pressure. On the downside, the Parabolic SAR level near $1.0717 acts as immediate support. A daily close back below this marker would expose the pair to a renewed slide toward previous lows at $1.05.
(The technical analysis of this story was written with the help of an AI tool.)
Crypto ETF FAQs
An Exchange-Traded Fund (ETF) is an investment vehicle or an index that tracks the price of an underlying asset. ETFs can not only track a single asset, but a group of assets and sectors. For example, a Bitcoin ETF tracks Bitcoin’s price. ETF is a tool used by investors to gain exposure to a certain asset.
Yes. The first Bitcoin futures ETF in the US was approved by the US Securities & Exchange Commission in October 2021. A total of seven Bitcoin futures ETFs have been approved, with more than 20 still waiting for the regulator’s permission. The SEC says that the cryptocurrency industry is new and subject to manipulation, which is why it has been delaying crypto-related futures ETFs for the last few years.
Yes. The SEC approved in January 2024 the listing and trading of several Bitcoin spot Exchange-Traded Funds, opening the door to institutional capital and mainstream investors to trade the main crypto currency. The decision was hailed by the industry as a game changer.
The main advantage of crypto ETFs is the possibility of gaining exposure to a cryptocurrency without ownership, reducing the risk and cost of holding the asset. Other pros are a lower learning curve and higher security for investors since ETFs take charge of securing the underlying asset holdings. As for the main drawbacks, the main one is that as an investor you can’t have direct ownership of the asset, or, as they say in crypto, “not your keys, not your coins.” Other disadvantages are higher costs associated with holding crypto since ETFs charge fees for active management. Finally, even though investing in ETFs reduces the risk of holding an asset, price swings in the underlying cryptocurrency are likely to be reflected in the investment vehicle too.

100만 명이 넘는 사용자가 FXStreet를 통해 실시간 시장 데이터, 차트 도구, 전문가 인사이트, 포렉스 뉴스를 이용합니다. 포괄적인 경제 캘린더와 교육 웨비나는 트레이더가 정보를 유지하고 신중한 결정을 내리도록 돕습니다. FXStreet는 바르셀로나 본사와 전 세계 지역에 걸쳐 약 60명의 팀으로 구성되어 있습니다.
더 읽기


