
Decred Price Prediction: DCR gears up for a breakout amid falling market
작성자 Vishal Dixit
게시일: 23 Feb 2026 | 수정일: 23 Feb 2026


인기 기사

Decred (DCR) extends gains by 5% at press time on Monday for the fifth consecutive day, with bulls challenging a crucial resistance level. The low liquidity of DCR tokens in the market, driven by steady user staking and treasury buildup, fuels upside moves.
- Decred rises 5% on Monday, building on over 6% gains from last week.
- Tight liquidity and steady treasury buildup cap downside risk and boost upside moves.
- The technical outlook focuses on the crucial resistance with bulls aiming for a breakout rally.
Decred (DCR) extends gains by 5% at press time on Monday for the fifth consecutive day, with bulls challenging a crucial resistance level. The low liquidity of DCR tokens in the market, driven by steady user staking and treasury buildup, fuels upside moves. Technically, Decred is at a crucial crossroads amid rising buying pressure.
Limited supply boosts DCR demand
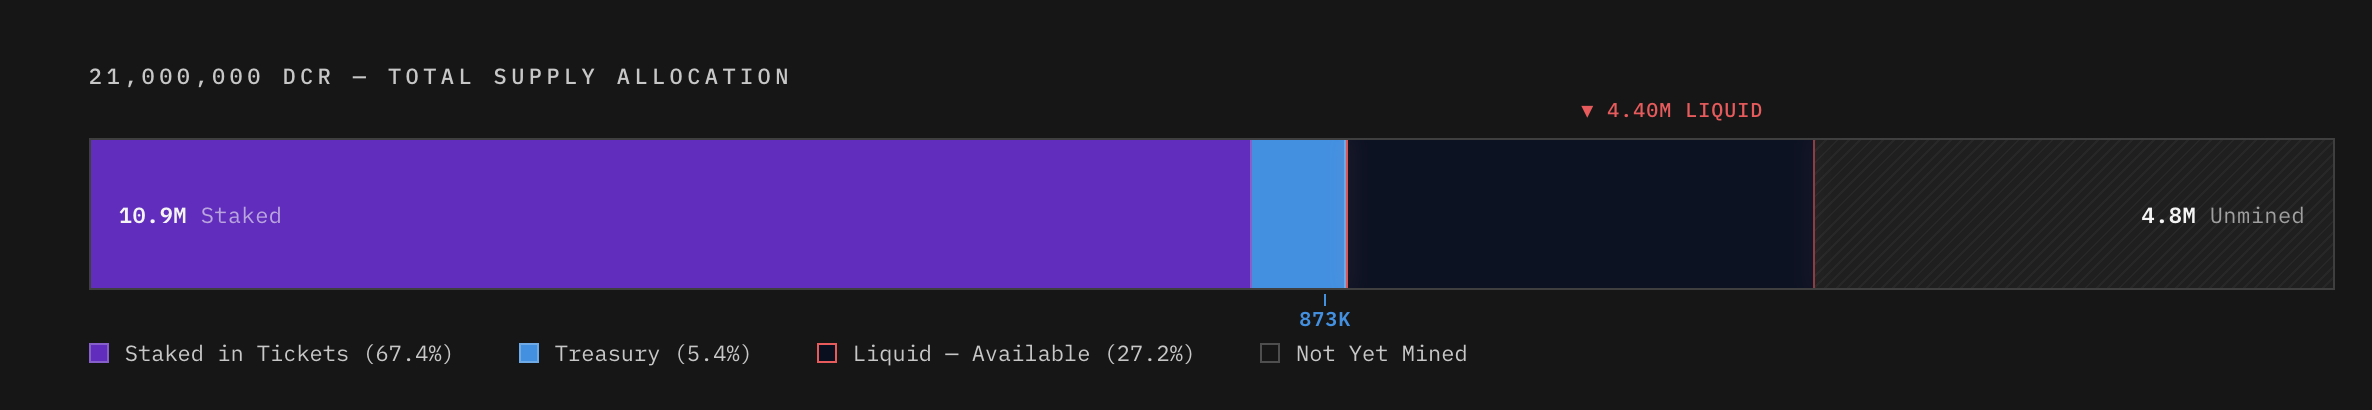
On-chain data shows 10.9 million DCR is staked, representing 67.4% of all mined DCR (16.2 million DCR), and cannot be sold for 142 days. Additionally, the treasury holds over 873,000 DCR tokens, removing 5.4% from the circulating supply, limiting the liquidity to 4.40 million DCR. The limited supply in the market boosts demand for the privacy coin among investors.
Technical outlook: Will Decred extend gains for a breakout rally?
Decred is up 5% at the time of writing on Monday, crossing above the $25.00 level. The short-term recovery tests the 38.2% Fibonacci retracement level at $26.13, measured from the November 4 high at $70 to the December 23 low at $14.21. The crucial resistance has previously capped gains since late November, showcasing intense supply pressure.
A decisive close above this level could target the 50% and 61.8% Fibonacci retracement levels at $31.54 and $38.07, respectively.
The Relative Strength Index (RSI) is at 63 on the daily chart, edging higher, extending its rebound from the halfway line as buying pressure increases. The indicator shows further upside before reaching the overbought zone, suggesting bullish potential. The Moving Average Convergence Divergence (MACD) crosses above its signal line, signaling renewed bullish momentum.

However, a downside reversal from $26.13 could signal renewed downside pressure, opening the door to a retest of the 50-day Exponential Moving Average (EMA) at $21.96.

100만 명이 넘는 사용자가 FXStreet를 통해 실시간 시장 데이터, 차트 도구, 전문가 인사이트, 포렉스 뉴스를 이용합니다. 포괄적인 경제 캘린더와 교육 웨비나는 트레이더가 정보를 유지하고 신중한 결정을 내리도록 돕습니다. FXStreet는 바르셀로나 본사와 전 세계 지역에 걸쳐 약 60명의 팀으로 구성되어 있습니다.
더 읽기


