
Dogecoin Price Forecast: DOGE poised for a larger breakout beyond $0.10
작성자 John Isige
수정됨: 22 Apr 2026


인기 기사

Dogecoin (DOGE) is grinding up above $0.0976, gaining along with the broader cryptocurrency market at the time of writing on Wednesday.
- Dogecoin gains toward $0.10 psychological resistance, building on the 50-day EMA baseline support.
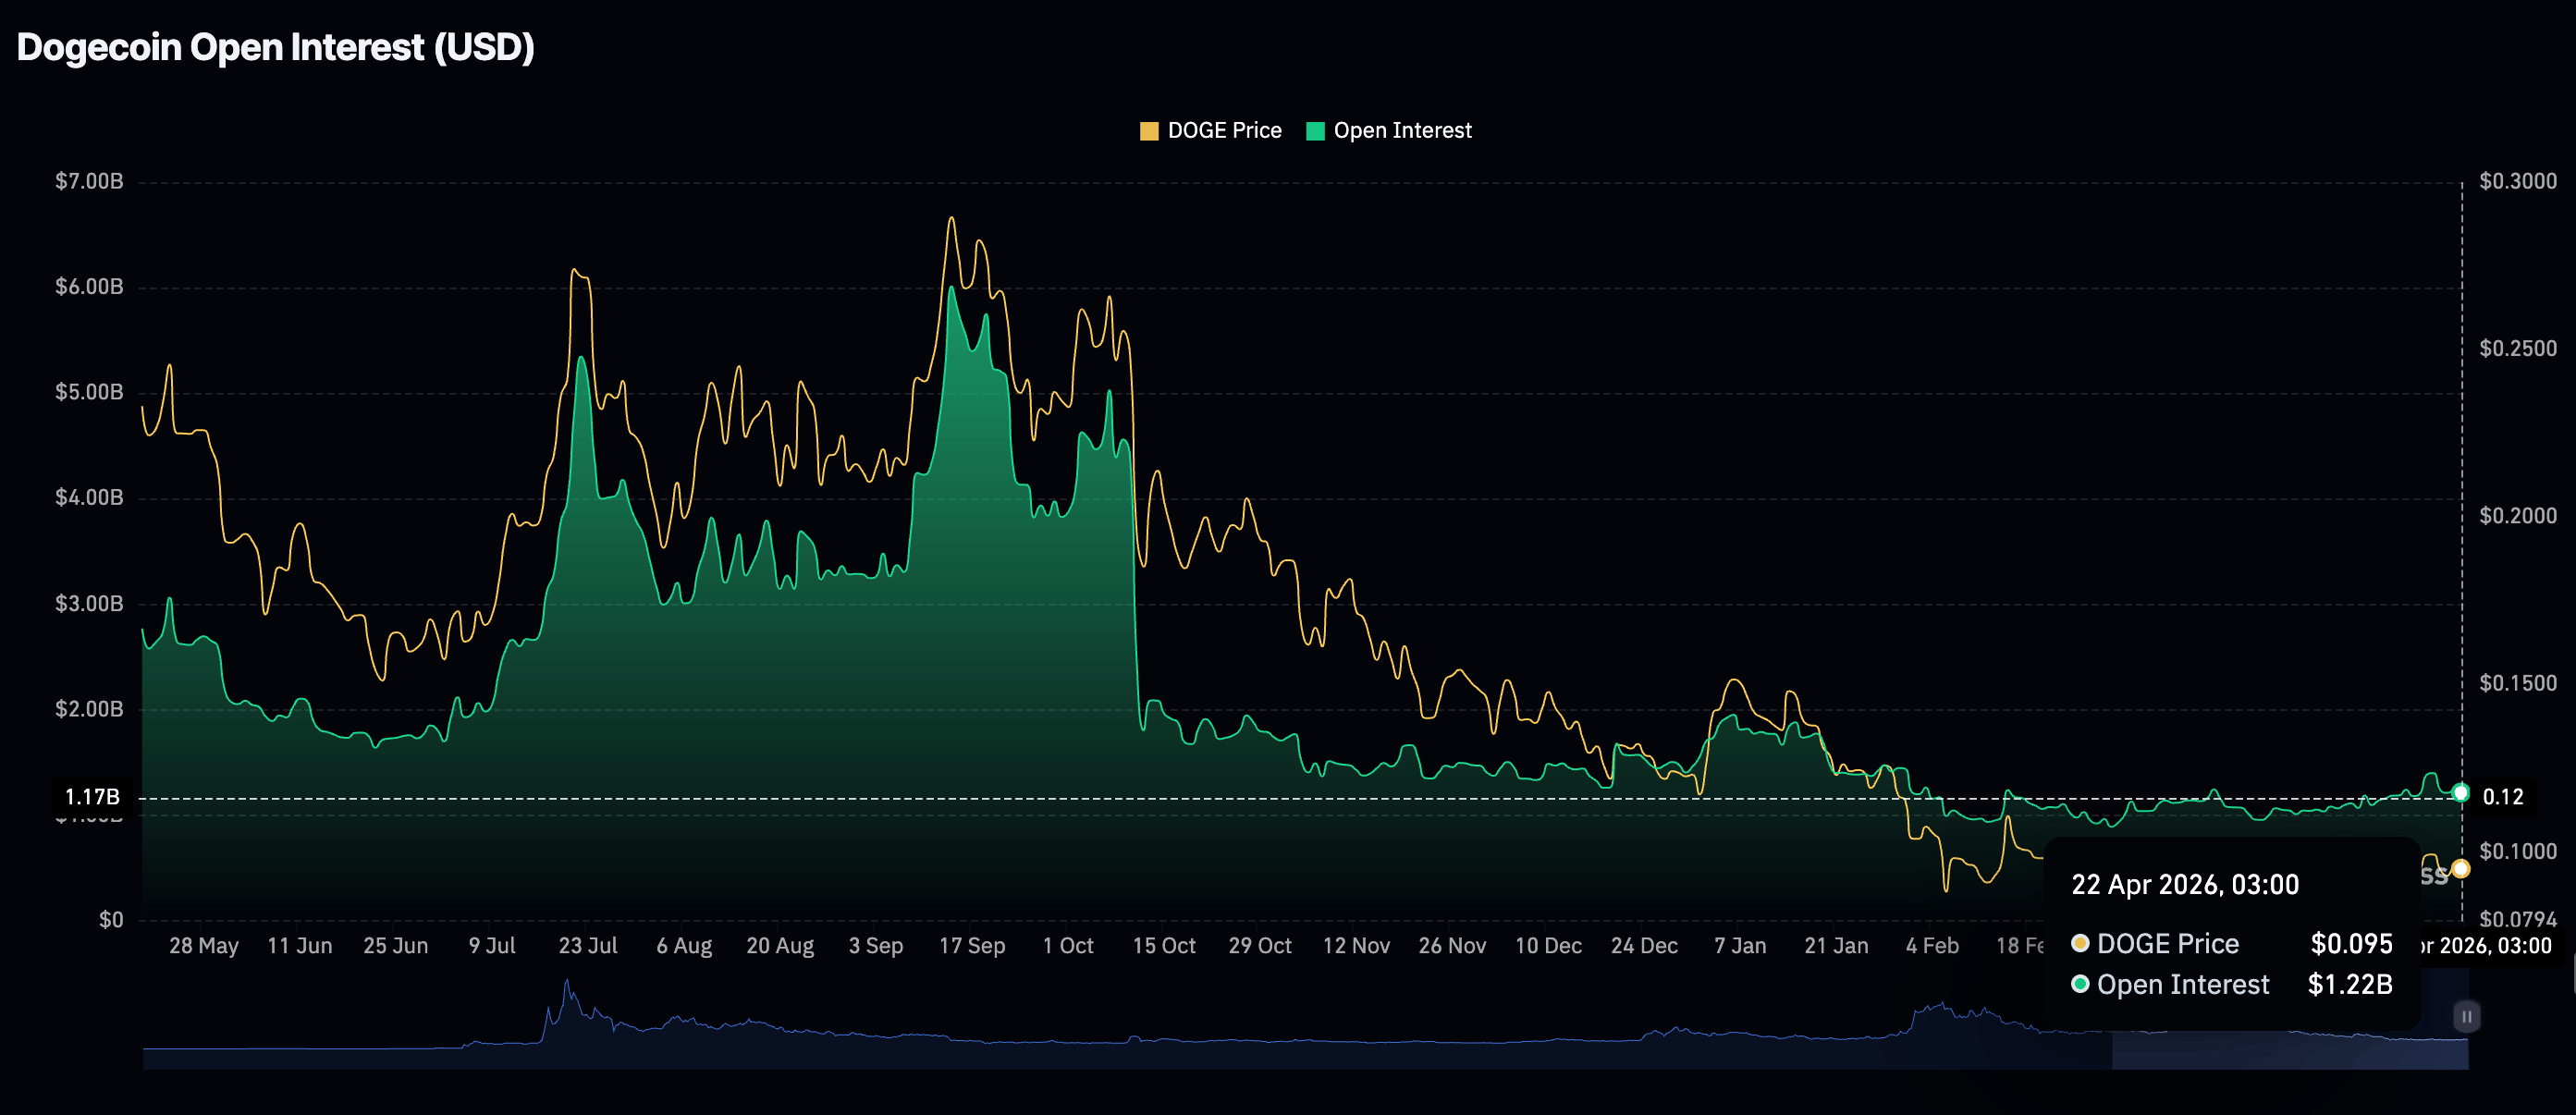
- Dogecoin perpetual futures exhibit subdued yet consistent demand, with Open Interest steady at $1.22 billion as of Wednesday.
- Dogecoin momentum indicators reinforce bullish conviction, with the MACD upholding a positive histogram and the RSI above the midline.
Dogecoin (DOGE) is grinding up above $0.0976, gaining along with the broader cryptocurrency market at the time of writing on Wednesday. The leading meme coin is showing a neutral-to-bullish outlook, building on robust support levels and growing investor conviction in risk assets after President Donald Trump extended the United States (US)-Iran ceasefire on Tuesday.
Although neither the US nor Iran has confirmed the second round of peace negotiations, sentiment across the crypto market remains relatively elevated.
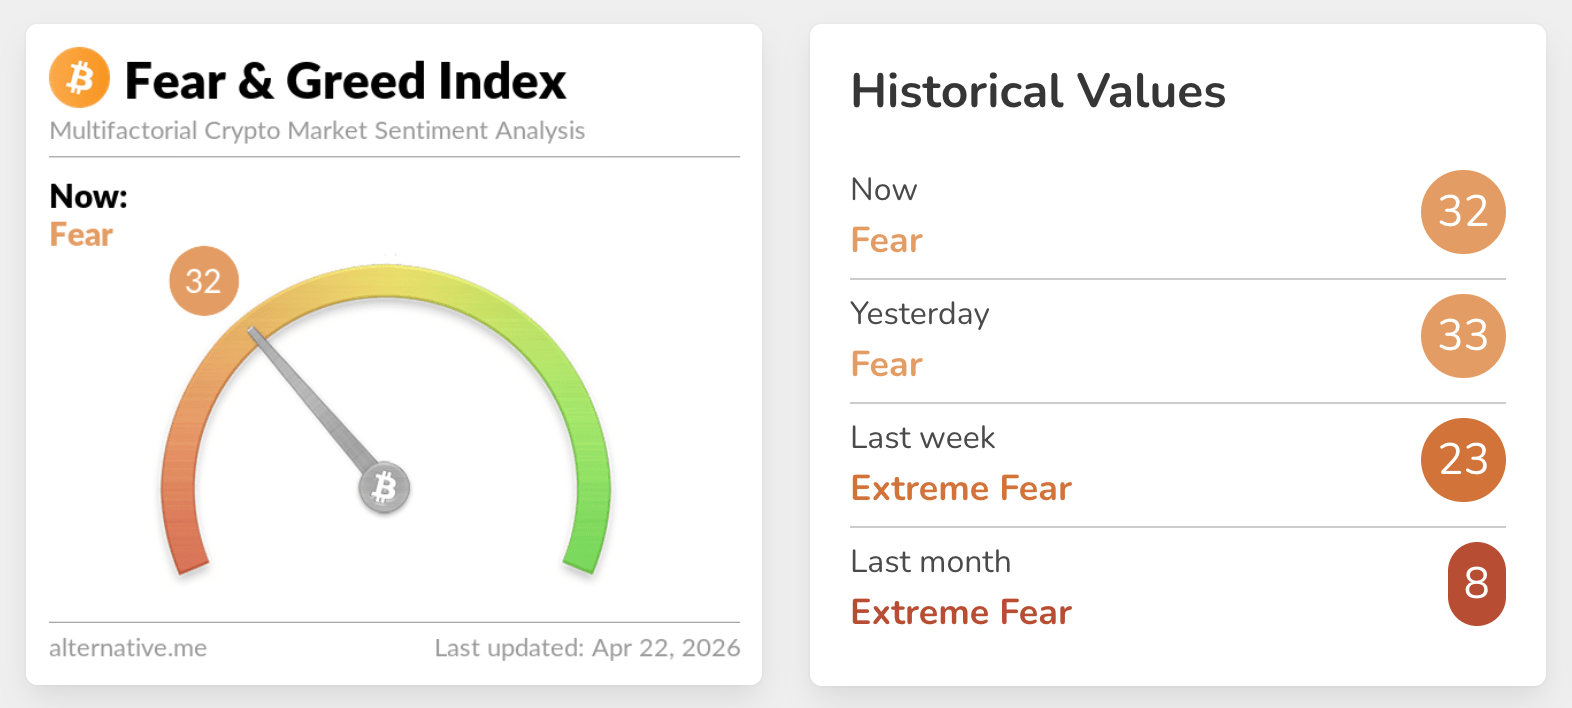
The crypto Fear & Greed Index holds at 32 on Wednesday, in the fear territory, up from 23 last week and 8 in March, in the extreme fear territory. If market sentiment continues to improve, it could steady risk appetite, raising the odds of an extended recovery.
Retail demand cools as Dogecoin gains
Interest in Dogecoin derivatives remains relatively subdued, as futures Open Interest (OI) steadies at $1.22 billion on Wednesday. Retail investors appear cautiously optimistic, given that OI remains low but stable as the price approaches the $0.10 pivotal level.
It is worth monitoring the reaction to Dogecoin’s potential break above $0.10, which could signal a bullish turnaround, sustaining gains and strengthening the derivatives market.
Technical outlook: Dogecoin showcases recovery potential
Dogecoin trades at $0.098, holding above the 50-day Exponential Moving Average (EMA) at $0.095. The meme coin position hints at a mildly constructive bias, yet it remains capped beneath the descending trendline barrier projected around $0.101 and the higher 100-day and 200-day EMAs at $0.105 and $0.128, respectively.
Momentum is moderately positive, with the Relative Strength Index (RSI) hovering at 57 on the daily chart. The Moving Average Convergence Divergence (MACD) upholds a slightly positive histogram on the same chart, suggesting lingering upside pressure but not a clean bullish breakout.
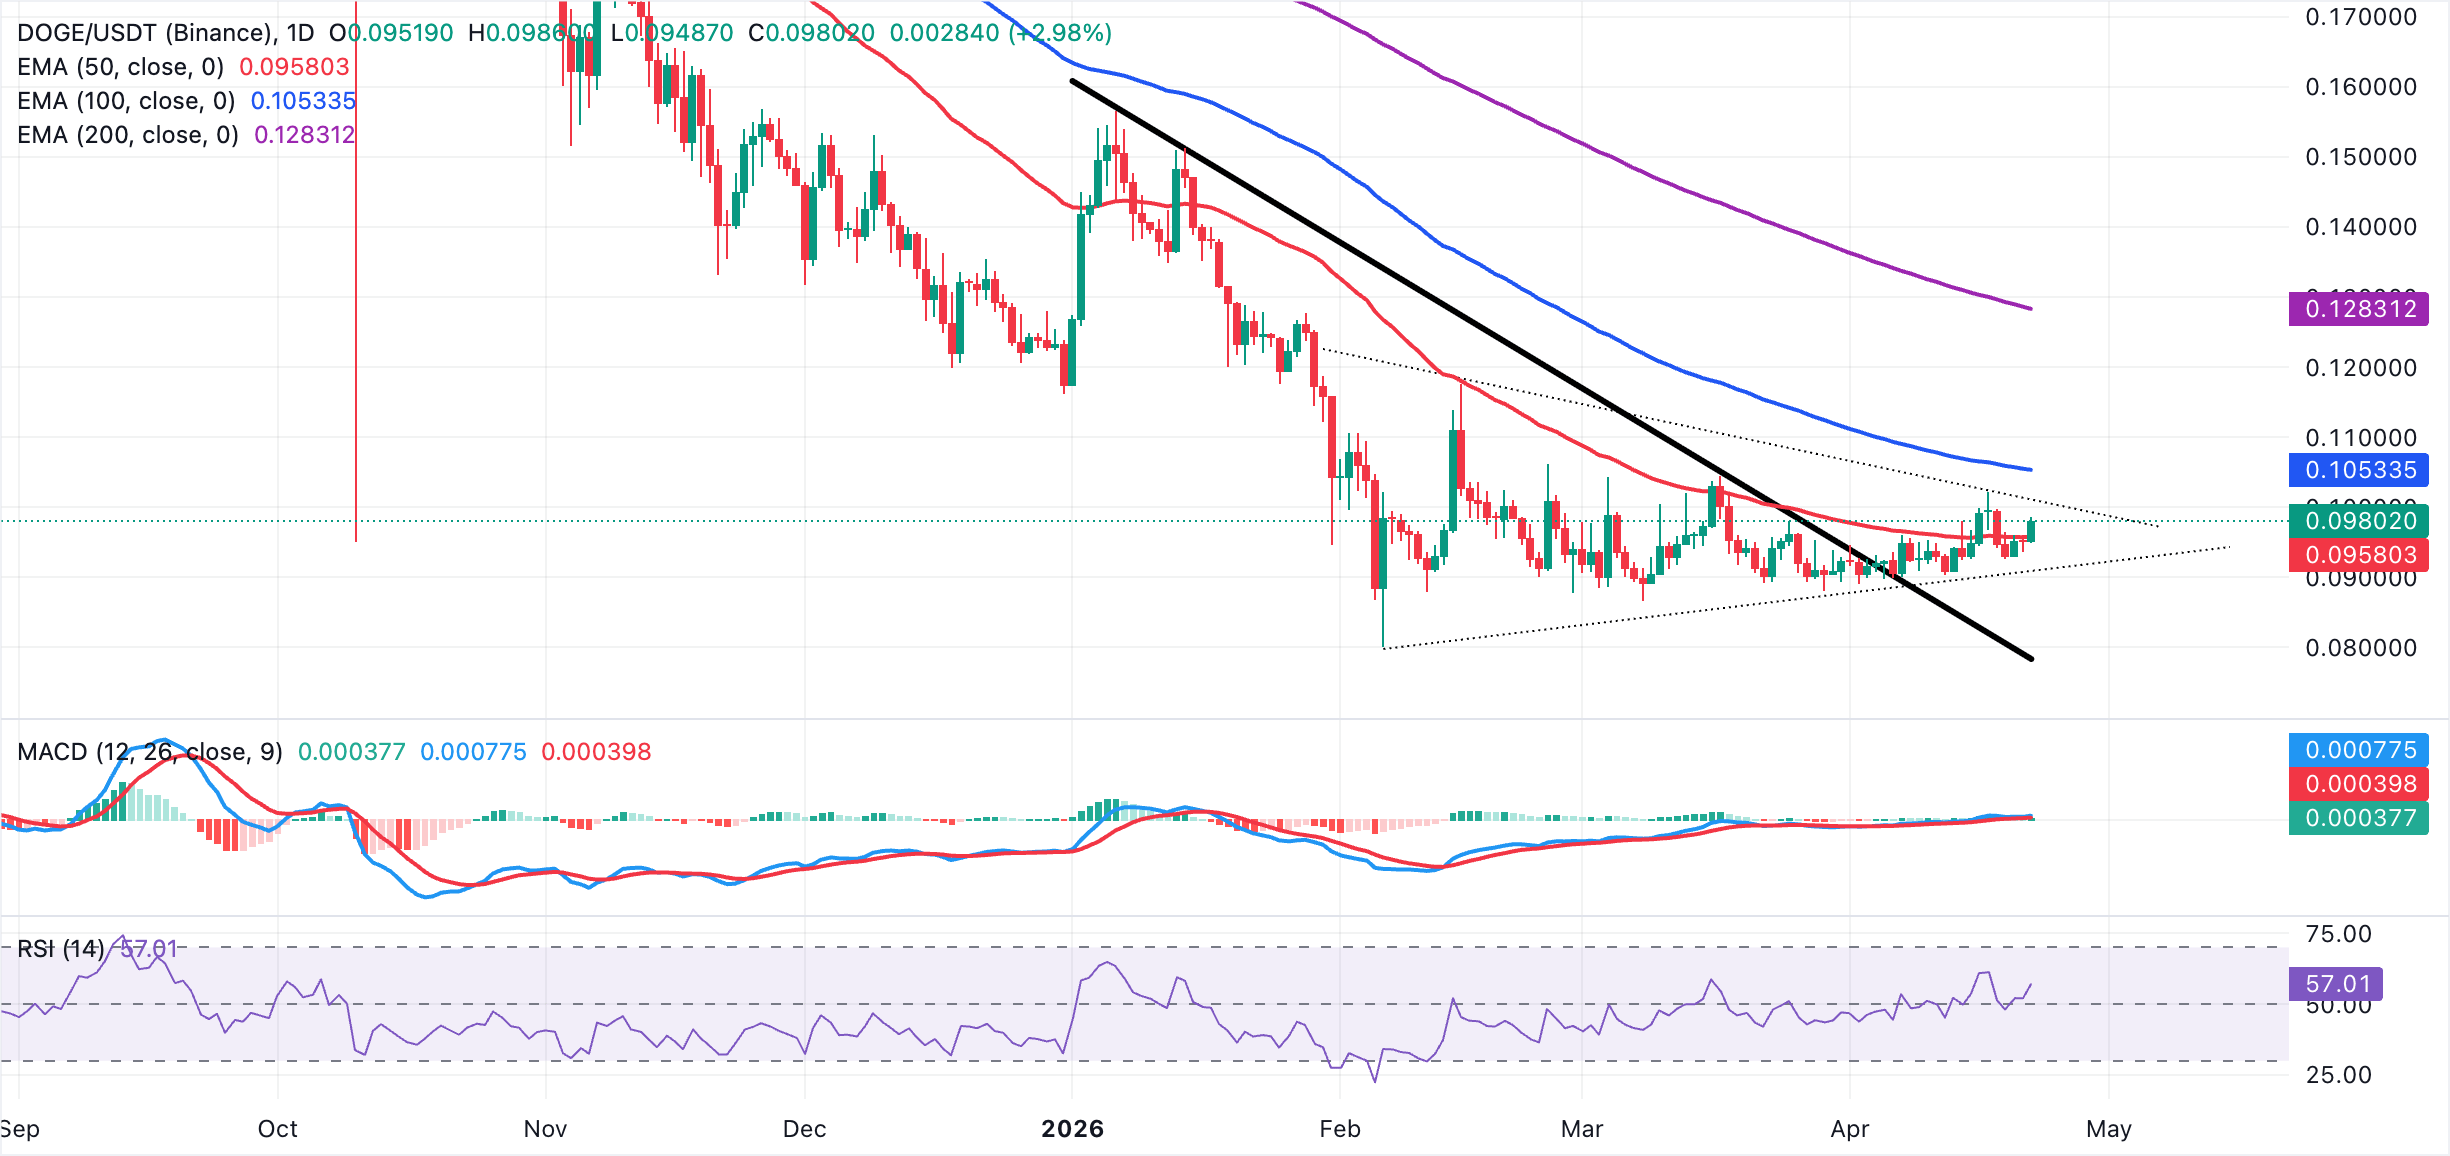
On the topside, initial resistance emerges at the descending trend line near $0.101, followed by the 100-day EMA at $0.105 and then the 200-day EMA at $0.128. A daily close above the cluster of moving averages would be needed to unlock a more decisive bullish phase. On the downside, the immediate support is the 50-day EMA at $0.0958. A break below that zone could expose the deeper structural floor associated with the ascending trendline (dotted) near $0.090.
(The technical analysis of this story was written with the help of an AI tool.)
Open Interest, funding rate FAQs
Higher Open Interest is associated with higher liquidity and new capital inflow to the market. This is considered the equivalent of increase in efficiency and the ongoing trend continues. When Open Interest decreases, it is considered a sign of liquidation in the market, investors are leaving and the overall demand for an asset is on a decline, fueling a bearish sentiment among investors.
Funding fees bridge the difference between spot prices and prices of futures contracts of an asset by increasing liquidation risks faced by traders. A consistently high and positive funding rate implies there is a bullish sentiment among market participants and there is an expectation of a price hike. A consistently negative funding rate for an asset implies a bearish sentiment, indicating that traders expect the cryptocurrency’s price to fall and a bearish trend reversal is likely to occur.

100만 명이 넘는 사용자가 FXStreet를 통해 실시간 시장 데이터, 차트 도구, 전문가 인사이트, 포렉스 뉴스를 이용합니다. 포괄적인 경제 캘린더와 교육 웨비나는 트레이더가 정보를 유지하고 신중한 결정을 내리도록 돕습니다. FXStreet는 바르셀로나 본사와 전 세계 지역에 걸쳐 약 60명의 팀으로 구성되어 있습니다.
더 읽기


